
Trade The World
Bitcoin Price Forecast: BTC steadies near $122,000 as market shows signs of overheating
作者 Manish Chhetri
發布日期: 8 Oct 2025 | 修改日期: 8 Oct 2025


POPULAR ARTICLES

Bitcoin (BTC) holds steady near $122,000 at the time of writing on Wednesday, following a 2.6% pullback the previous day, as rising profit-taking pressure kept investors cautious.
- Bitcoin steadies around $122,000 on Wednesday after falling 2.67% the previous day.
- BTC profit-taking activity continues to increase, posing downside risks for BTC.
- Traders should be cautious as reports suggest a temporarily overheated market with an elevated risk of short-term consolidation.
Bitcoin (BTC) holds steady near $122,000 at the time of writing on Wednesday, following a 2.6% pullback the previous day, as rising profit-taking pressure kept investors cautious. In addition to this, a K33 report suggests that the largest cryptocurrency by market capitalization could face short-term consolidation before its next major move.
Bitcoin dips as holders realize some profit
Bitcoin price started the week on a positive note, reaching a new all-time high of $126,199 on Monday. However, BTC experienced a 2.5% pullback on Tuesday, as holders realized some gains. This can be seen from the chart below, where Santiments’ Network Realized Profit/Loss (NPL) metric showed a spike on Monday and Tuesday for BTC. Moreover, on Wednesday, the metric recorded a massive spike, the highest since early October, indicating that holders are, on average, selling their bags at a significant profit and increasing the selling pressure.
 [14-1759918955485-1759918955489.59.01, 08 Oct, 2025].png)
Apart from the profit-taking activity, fears of a prolonged US government shutdown, now in its second week, heighten economic uncertainty and weigh on risk assets, such as Bitcoin.
Market participants’ focus now shifts to the release of the Federal Open Market Committee (FOMC) meeting Minutes, due later on Wednesday, which could bring fresh volatility to riskier assets such as Bitcoin. Apart from this, Federal Reserve (Fed) Chair Jerome Powell’s appearance on Thursday will be closely watched for more cues about the interest rate cut path. This, in turn, will drive the US Dollar (USD) and provide a fresh impetus to riskier assets.
On-chain data suggests a temporarily overheated condition
A K33 report released on Tuesday highlighted that current conditions suggest a temporarily overheated market with an elevated risk of short-term consolidation.
The analyst explained that the past week marked the strongest BTC accumulation so far this year, with a combined 63,083 BTC added across US Exchange Traded Funds (ETFs), the Chicago Mercantile Exchange (CME), and perpetual futures, surpassing the previous May record.
“This surge occurs without a clear macroeconomic catalyst and is driven by widespread long positioning, as yields rose sharply in both the CME and perpetuals. Historically, similar bursts in exposure have often coincided with local tops, and the current setup suggests a temporarily overheated market with elevated risk of short-term consolidation,” reported the K33 analyst.
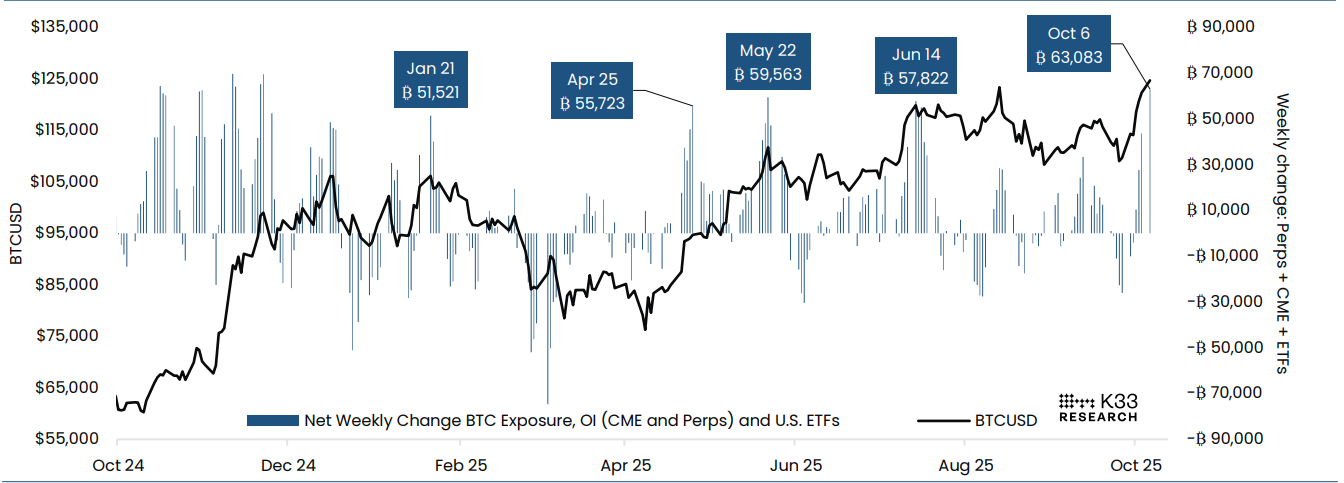
Combined Change in Notional BTC Exposure, Perps and Future OI + ETFs chart. Source: K33
QCP Capital analyst reported on Wednesday that the core signal remains intact: fade USD strength, expect Gold to outperform, and treat headline-driven corrections in BTC and risk assets as buyable, while staying alert to tariff and data gap volatility in the near term.
Bitcoin Price Forecast: BTC could extend its correction if $120,000 support is broken
Bitcoin reached a new all-time high of $126,199 on Monday after surging more than 10% in the previous week. However, BTC failed to continue its rally and corrected by 2.67% on Tuesday. At the time of writing on Wednesday, BTC hovers around $122,000.
If BTC continues its correction and closes below $120,000, it could extend the decline toward the next daily support level at $116,000.
The Relative Strength Index (RSI) on the daily chart reads 63 after falling from the overbought conditions on Monday, indicating a potential slowdown in bullish momentum and the likelihood of short-term consolidation.
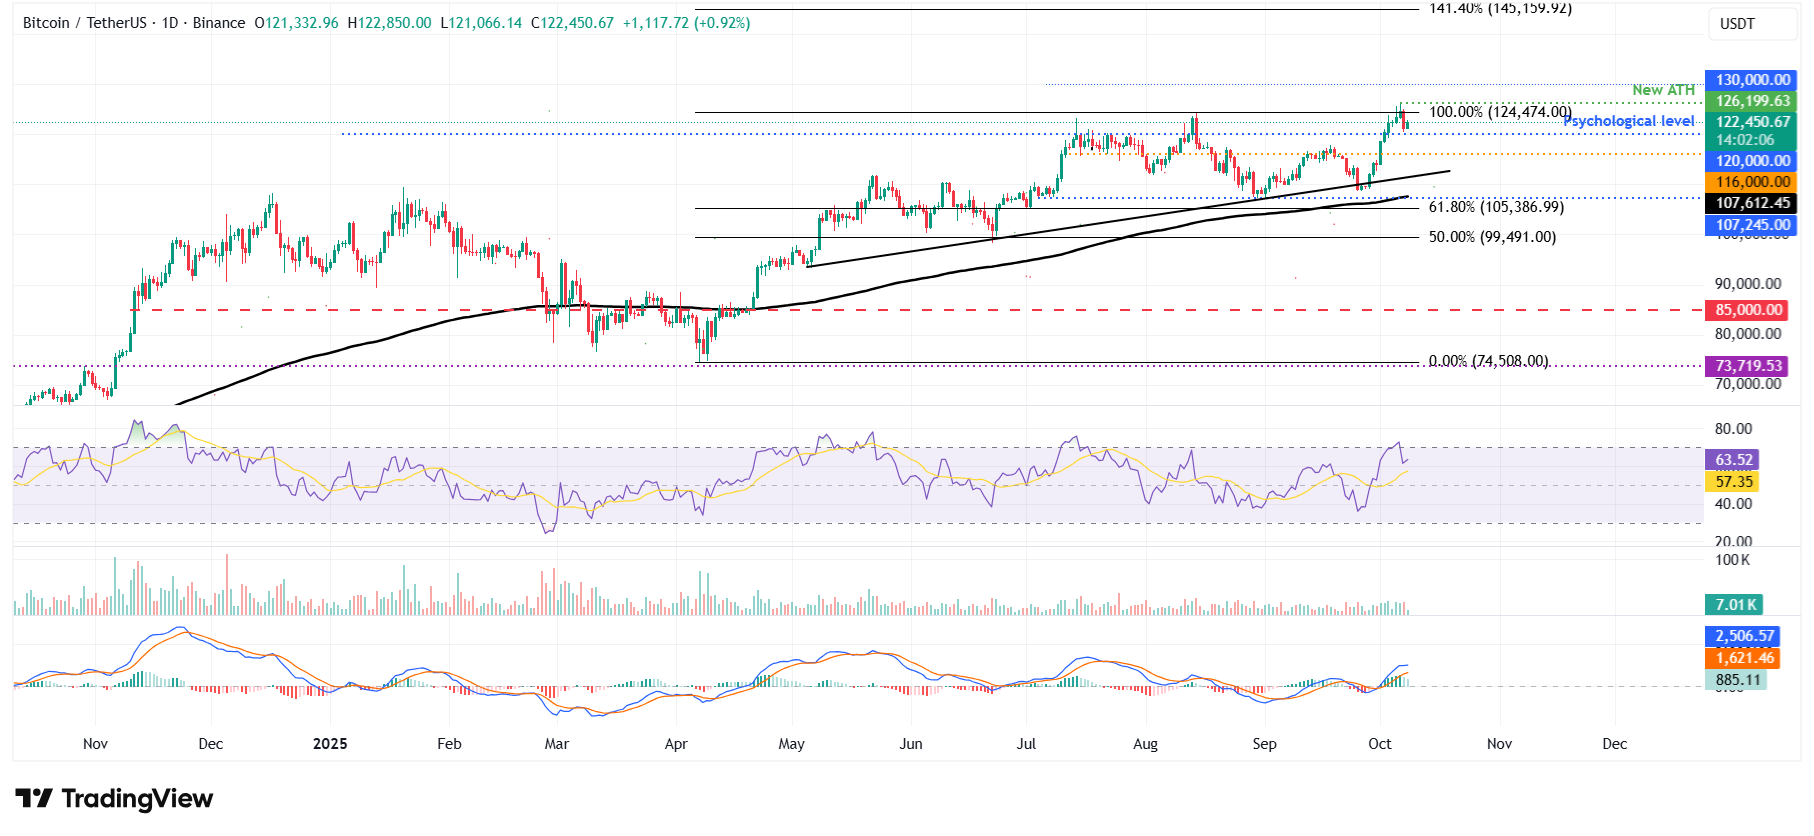
BTC/USDT daily chart
However, if BTC maintains its upward momentum, it could extend the rally toward the record high of $126,199.
Cryptocurrency metrics FAQs
The developer or creator of each cryptocurrency decides on the total number of tokens that can be minted or issued. Only a certain number of these assets can be minted by mining, staking or other mechanisms. This is defined by the algorithm of the underlying blockchain technology. On the other hand, circulating supply can also be decreased via actions such as burning tokens, or mistakenly sending assets to addresses of other incompatible blockchains.
Market capitalization is the result of multiplying the circulating supply of a certain asset by the asset’s current market value.
Trading volume refers to the total number of tokens for a specific asset that has been transacted or exchanged between buyers and sellers within set trading hours, for example, 24 hours. It is used to gauge market sentiment, this metric combines all volumes on centralized exchanges and decentralized exchanges. Increasing trading volume often denotes the demand for a certain asset as more people are buying and selling the cryptocurrency.
Funding rates are a concept designed to encourage traders to take positions and ensure perpetual contract prices match spot markets. It defines a mechanism by exchanges to ensure that future prices and index prices periodic payments regularly converge. When the funding rate is positive, the price of the perpetual contract is higher than the mark price. This means traders who are bullish and have opened long positions pay traders who are in short positions. On the other hand, a negative funding rate means perpetual prices are below the mark price, and hence traders with short positions pay traders who have opened long positions.

FXStreet
超過一百萬用戶依賴 FXStreet 獲取即時市場數據、圖表工具、專家洞見與外匯新聞。其全面的經濟日曆與教育網路研討會協助交易者保持資訊領先、做出審慎決策。FXStreet 擁有約 60 人的團隊,分布於巴塞隆納總部及全球各地。
Read More


