
Trade The World
Crypto Today: Bitcoin, XRP slip as supply in profit declines, Ethereum holds steady
作者 Vishal Dixit
發布日期: 22 Aug 2025 | 修改日期: 22 Aug 2025


POPULAR ARTICLES

Bitcoin (BTC) and Ripple (XRP) are at a crucial crossroads as the supply in profit declines and the technical outlook indicates increasing downside risk. Ethereum (ETH) remains steady, despite the risk of a broader market correction looming.
- Bitcoin loses intraday gains as momentum weakens before Fed Powell’s speech at the Jackson Hole Symposium.
- Ethereum upholds recovery within a rising channel pattern.
- XRP risks further losses to test the monthly low near the $2.75 support zone.
Bitcoin (BTC) and Ripple (XRP) are at a crucial crossroads as the supply in profit declines and the technical outlook indicates increasing downside risk. Ethereum (ETH) remains steady, despite the risk of a broader market correction looming.
BTC and XRP are on the verge of losing a crucial support level as intraday gains disappear, while Ethereum upholds optimism within a rising channel pattern.
The supply in profit drops, signaling lowered confidence
The percentage of the total amount of coins held by investors in profit is a crucial on-chain trend indicator. An increase in percentage points would mark an uptrend in motion, signaling increased confidence among investors and vice versa.
Santiment data shows that the percentage of BTC and XRP supply in profit has declined to 92.138% and 91.74%, respectively, from 100% (at Bitcoin’s all-time high) and 98.2% (XRP's monthly high) on August 8. This indicates a steep decline in investors’ conviction towards an uptrend.
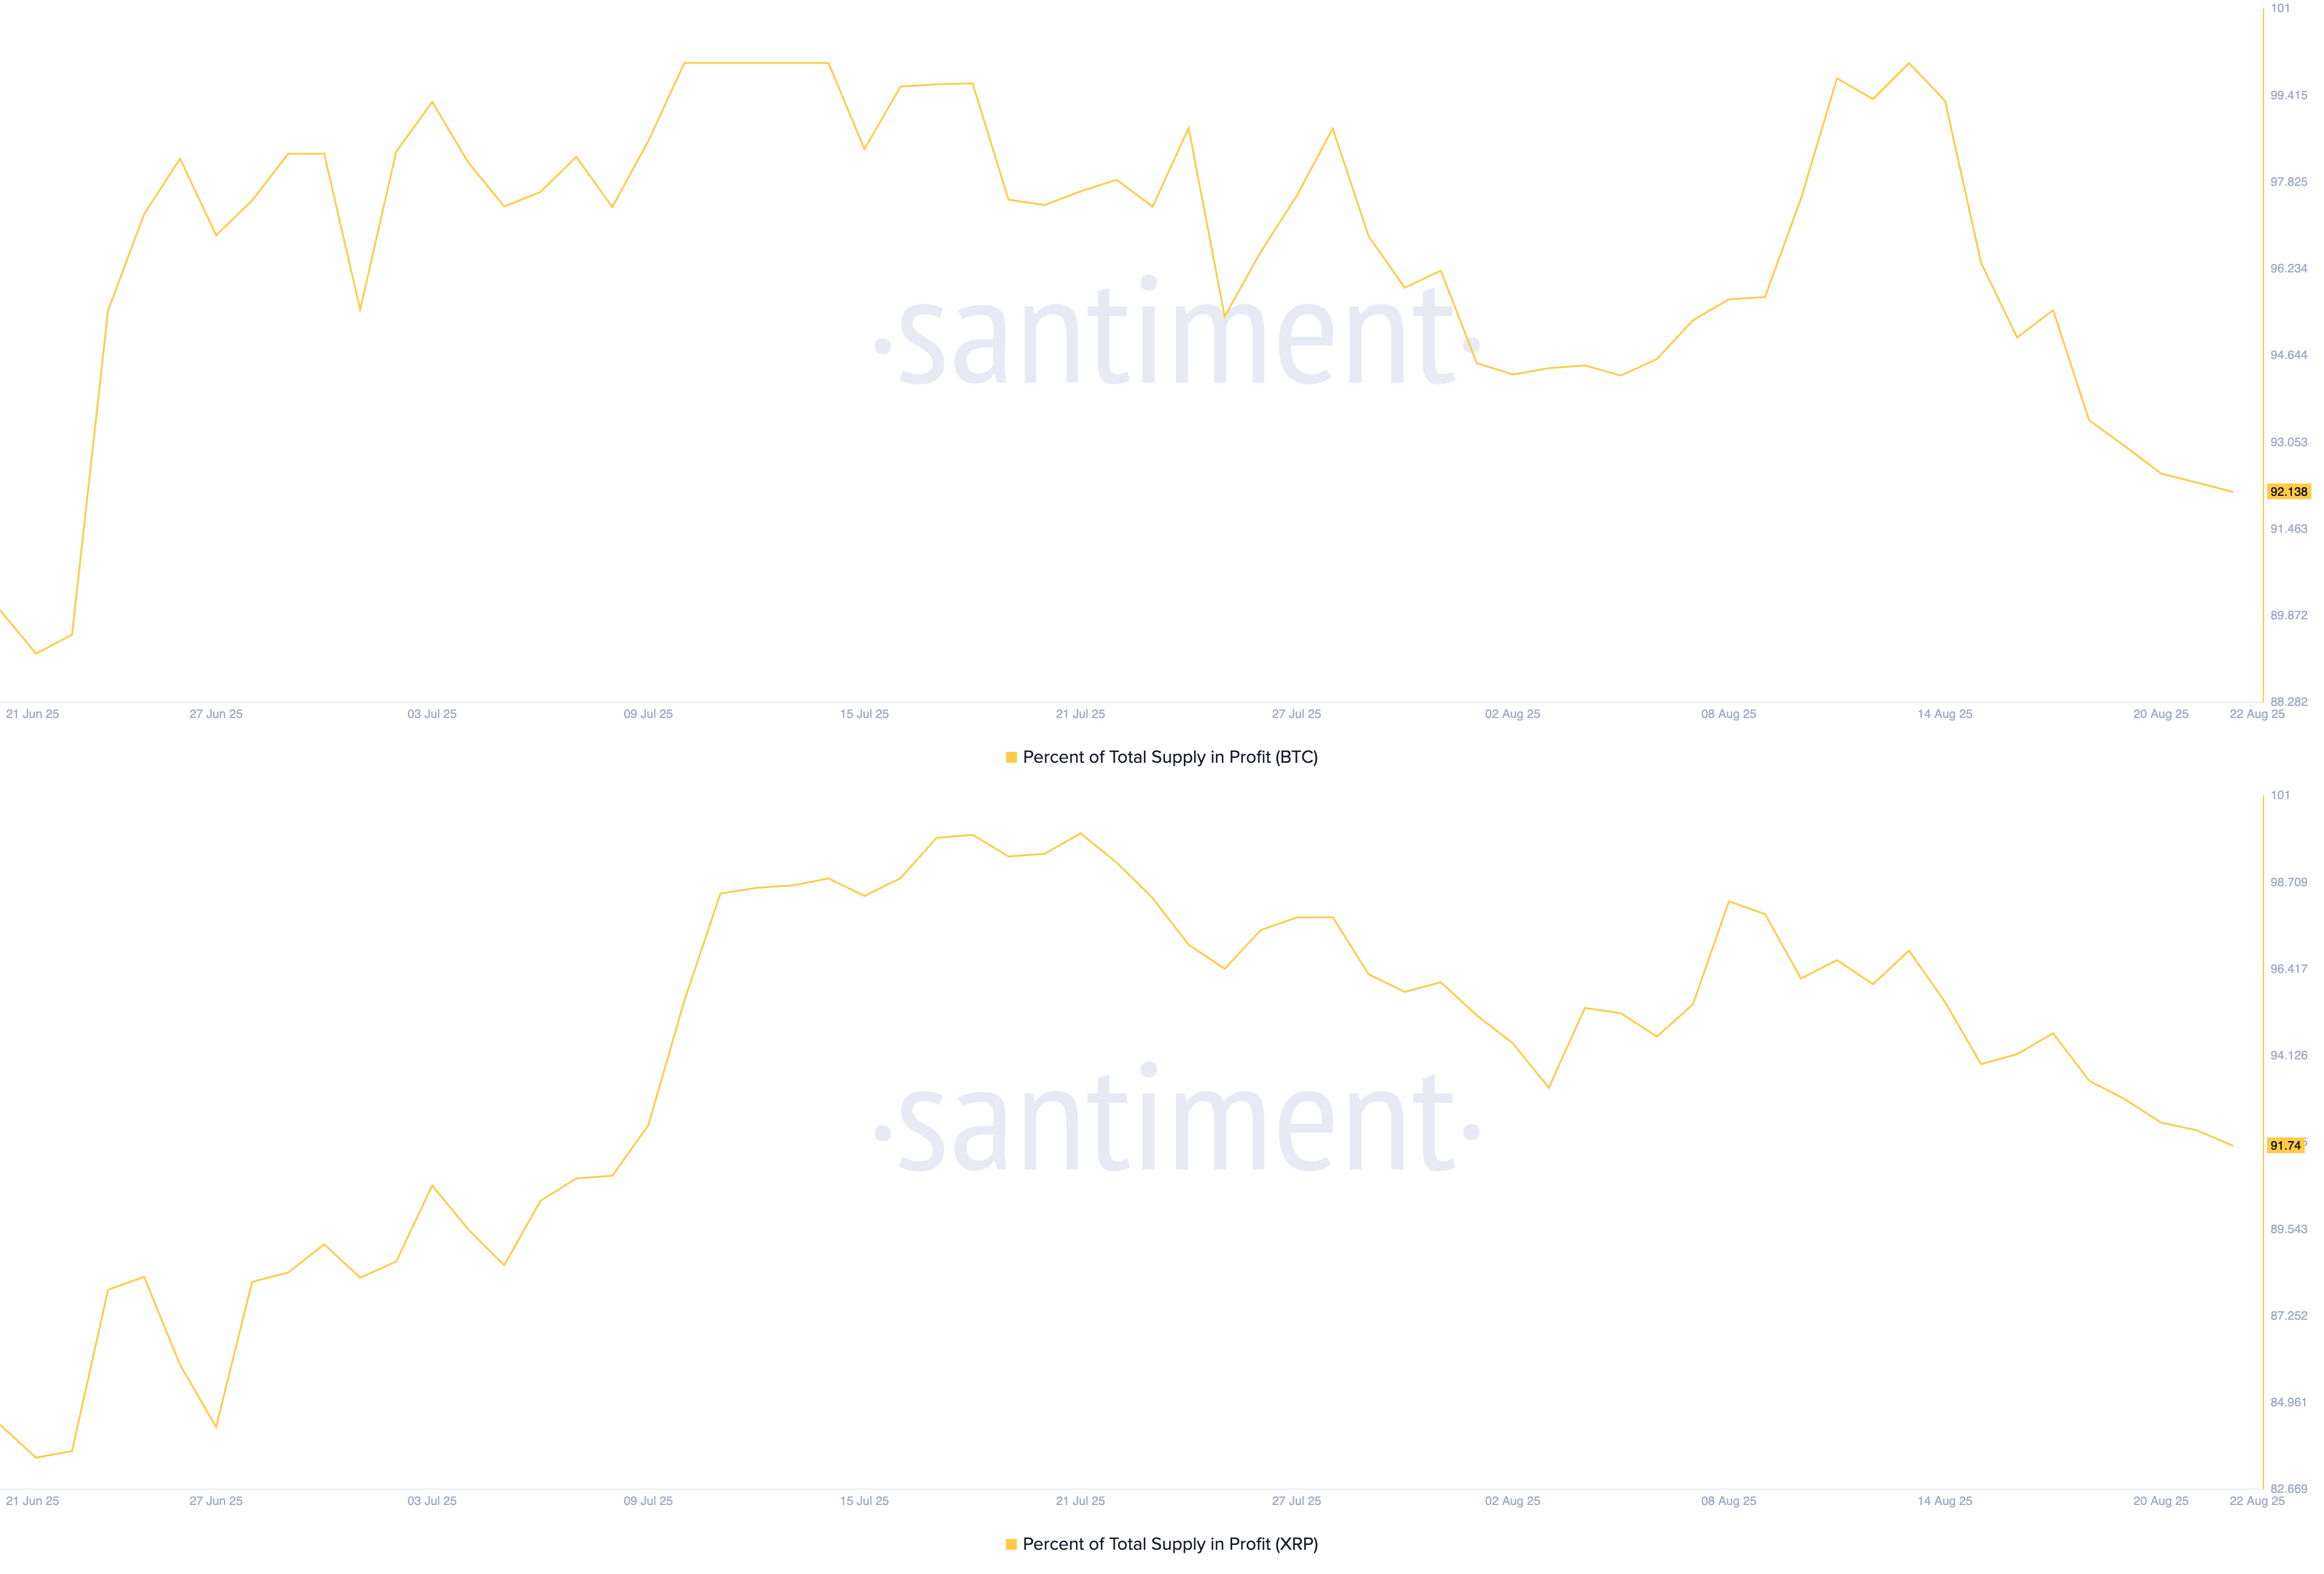
BTC, XRP supply in profit. Source: Santiment
Still, the euphoria in Ethereum is underpinned by institutional demand and altseason hype, retaining the percentage of supply in profit at 96.75%, slightly under the 99.86% high from August 13.
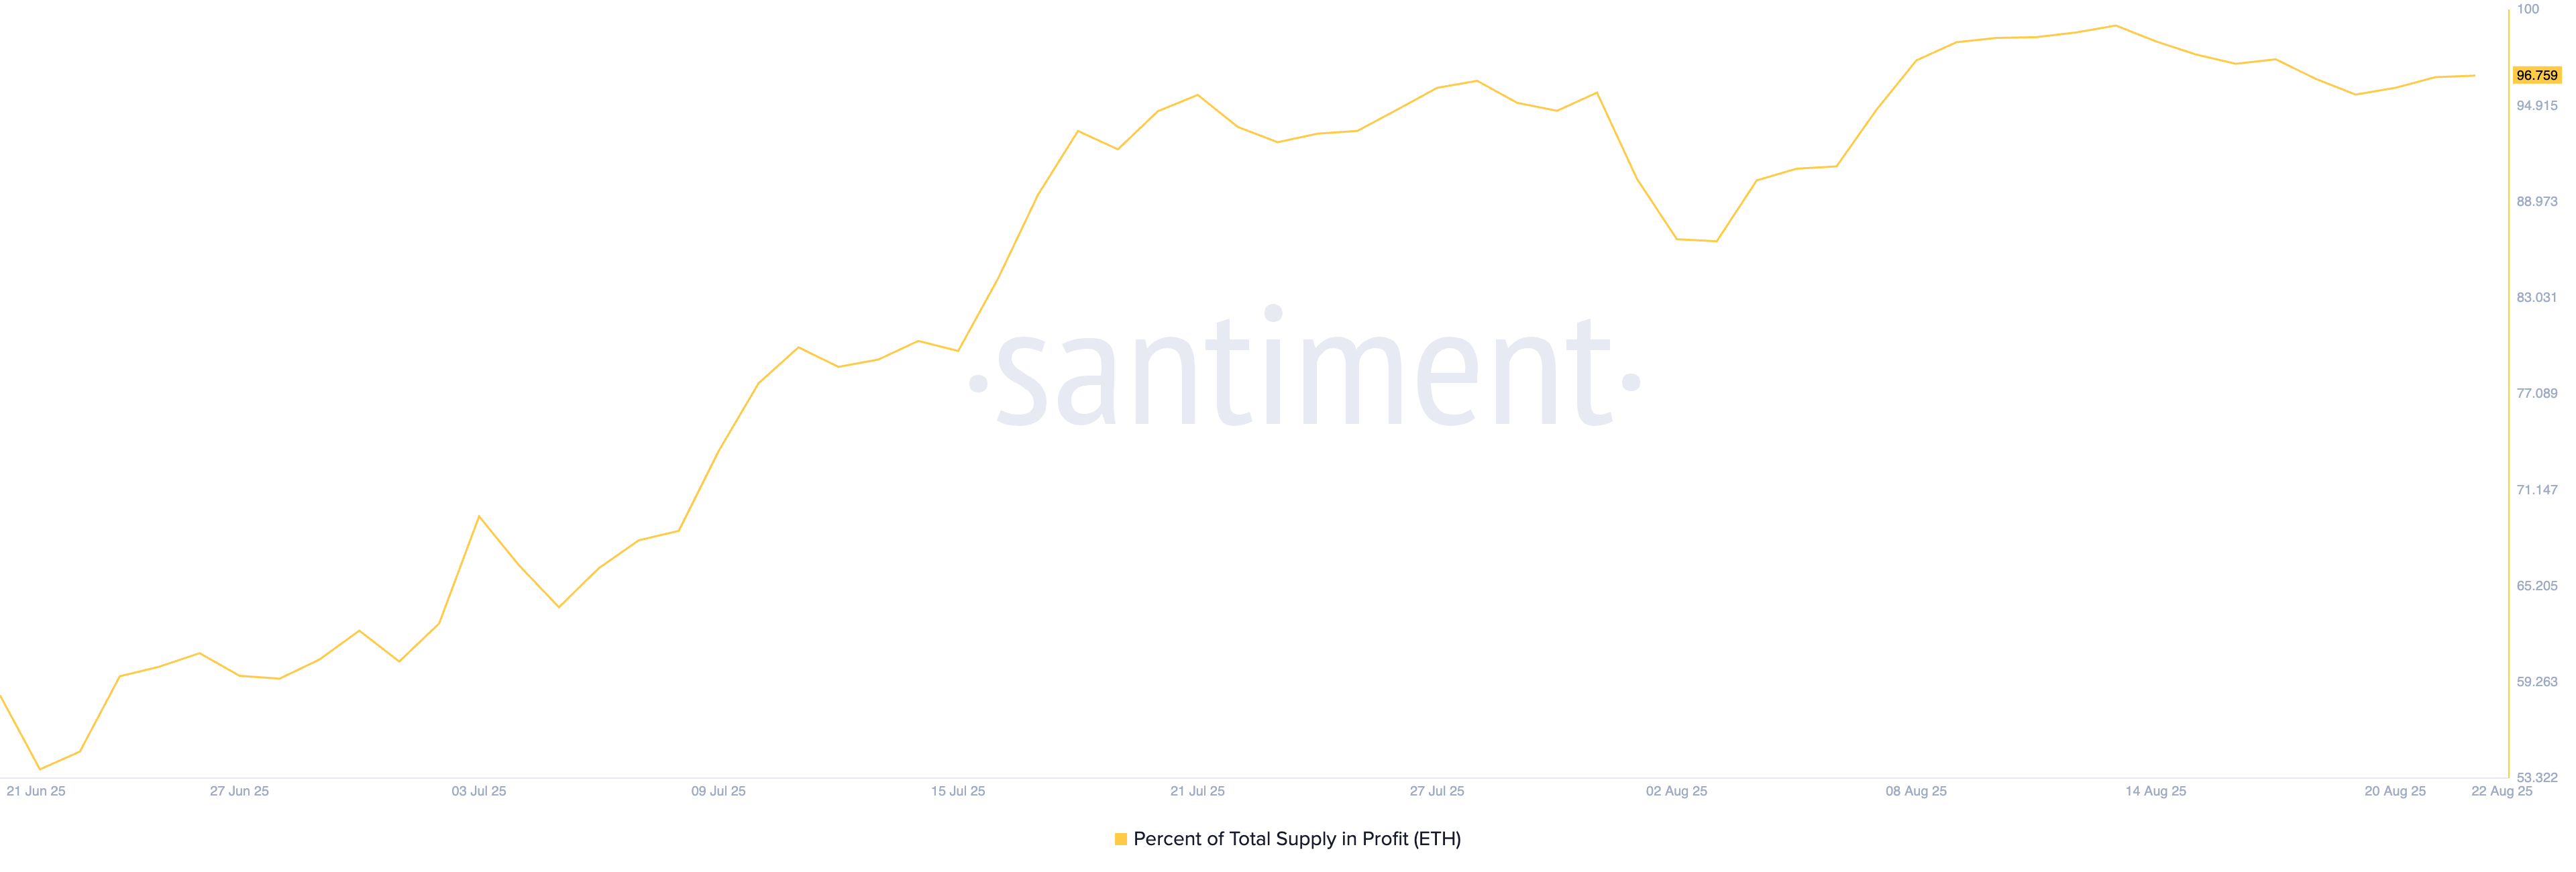
ETH supply in profit. Source: Santiment
Bitcoin at risk of further losses
Bitcoin edges lower to trade at $112,736 at the time of writing on Friday, retracing from the high of 113,525 earlier on the day. The loss of ground puts pressure on the $111,920 support level, a pivot point formed on August 3, which resulted in the early August recovery.
A potential daily close below this support level could ignite a freefall in BTC to the $107,245 level, marked by the July 4 low.
The momentum indicators flash mixed neutral to bearish signals on the daily chart. The Moving Average Convergence Divergence (MACD) falls below the zero line after crossing its signal line on Friday. A consecutive rise in red histogram bars indicates rising bearish momentum.
Still, the Relative Strength Index (RSI) at 41 holds above the oversold zone with a sideways shift. The slightly upwards-pointing RSI signals declining buying pressure struggling to absorb the incoming supply.
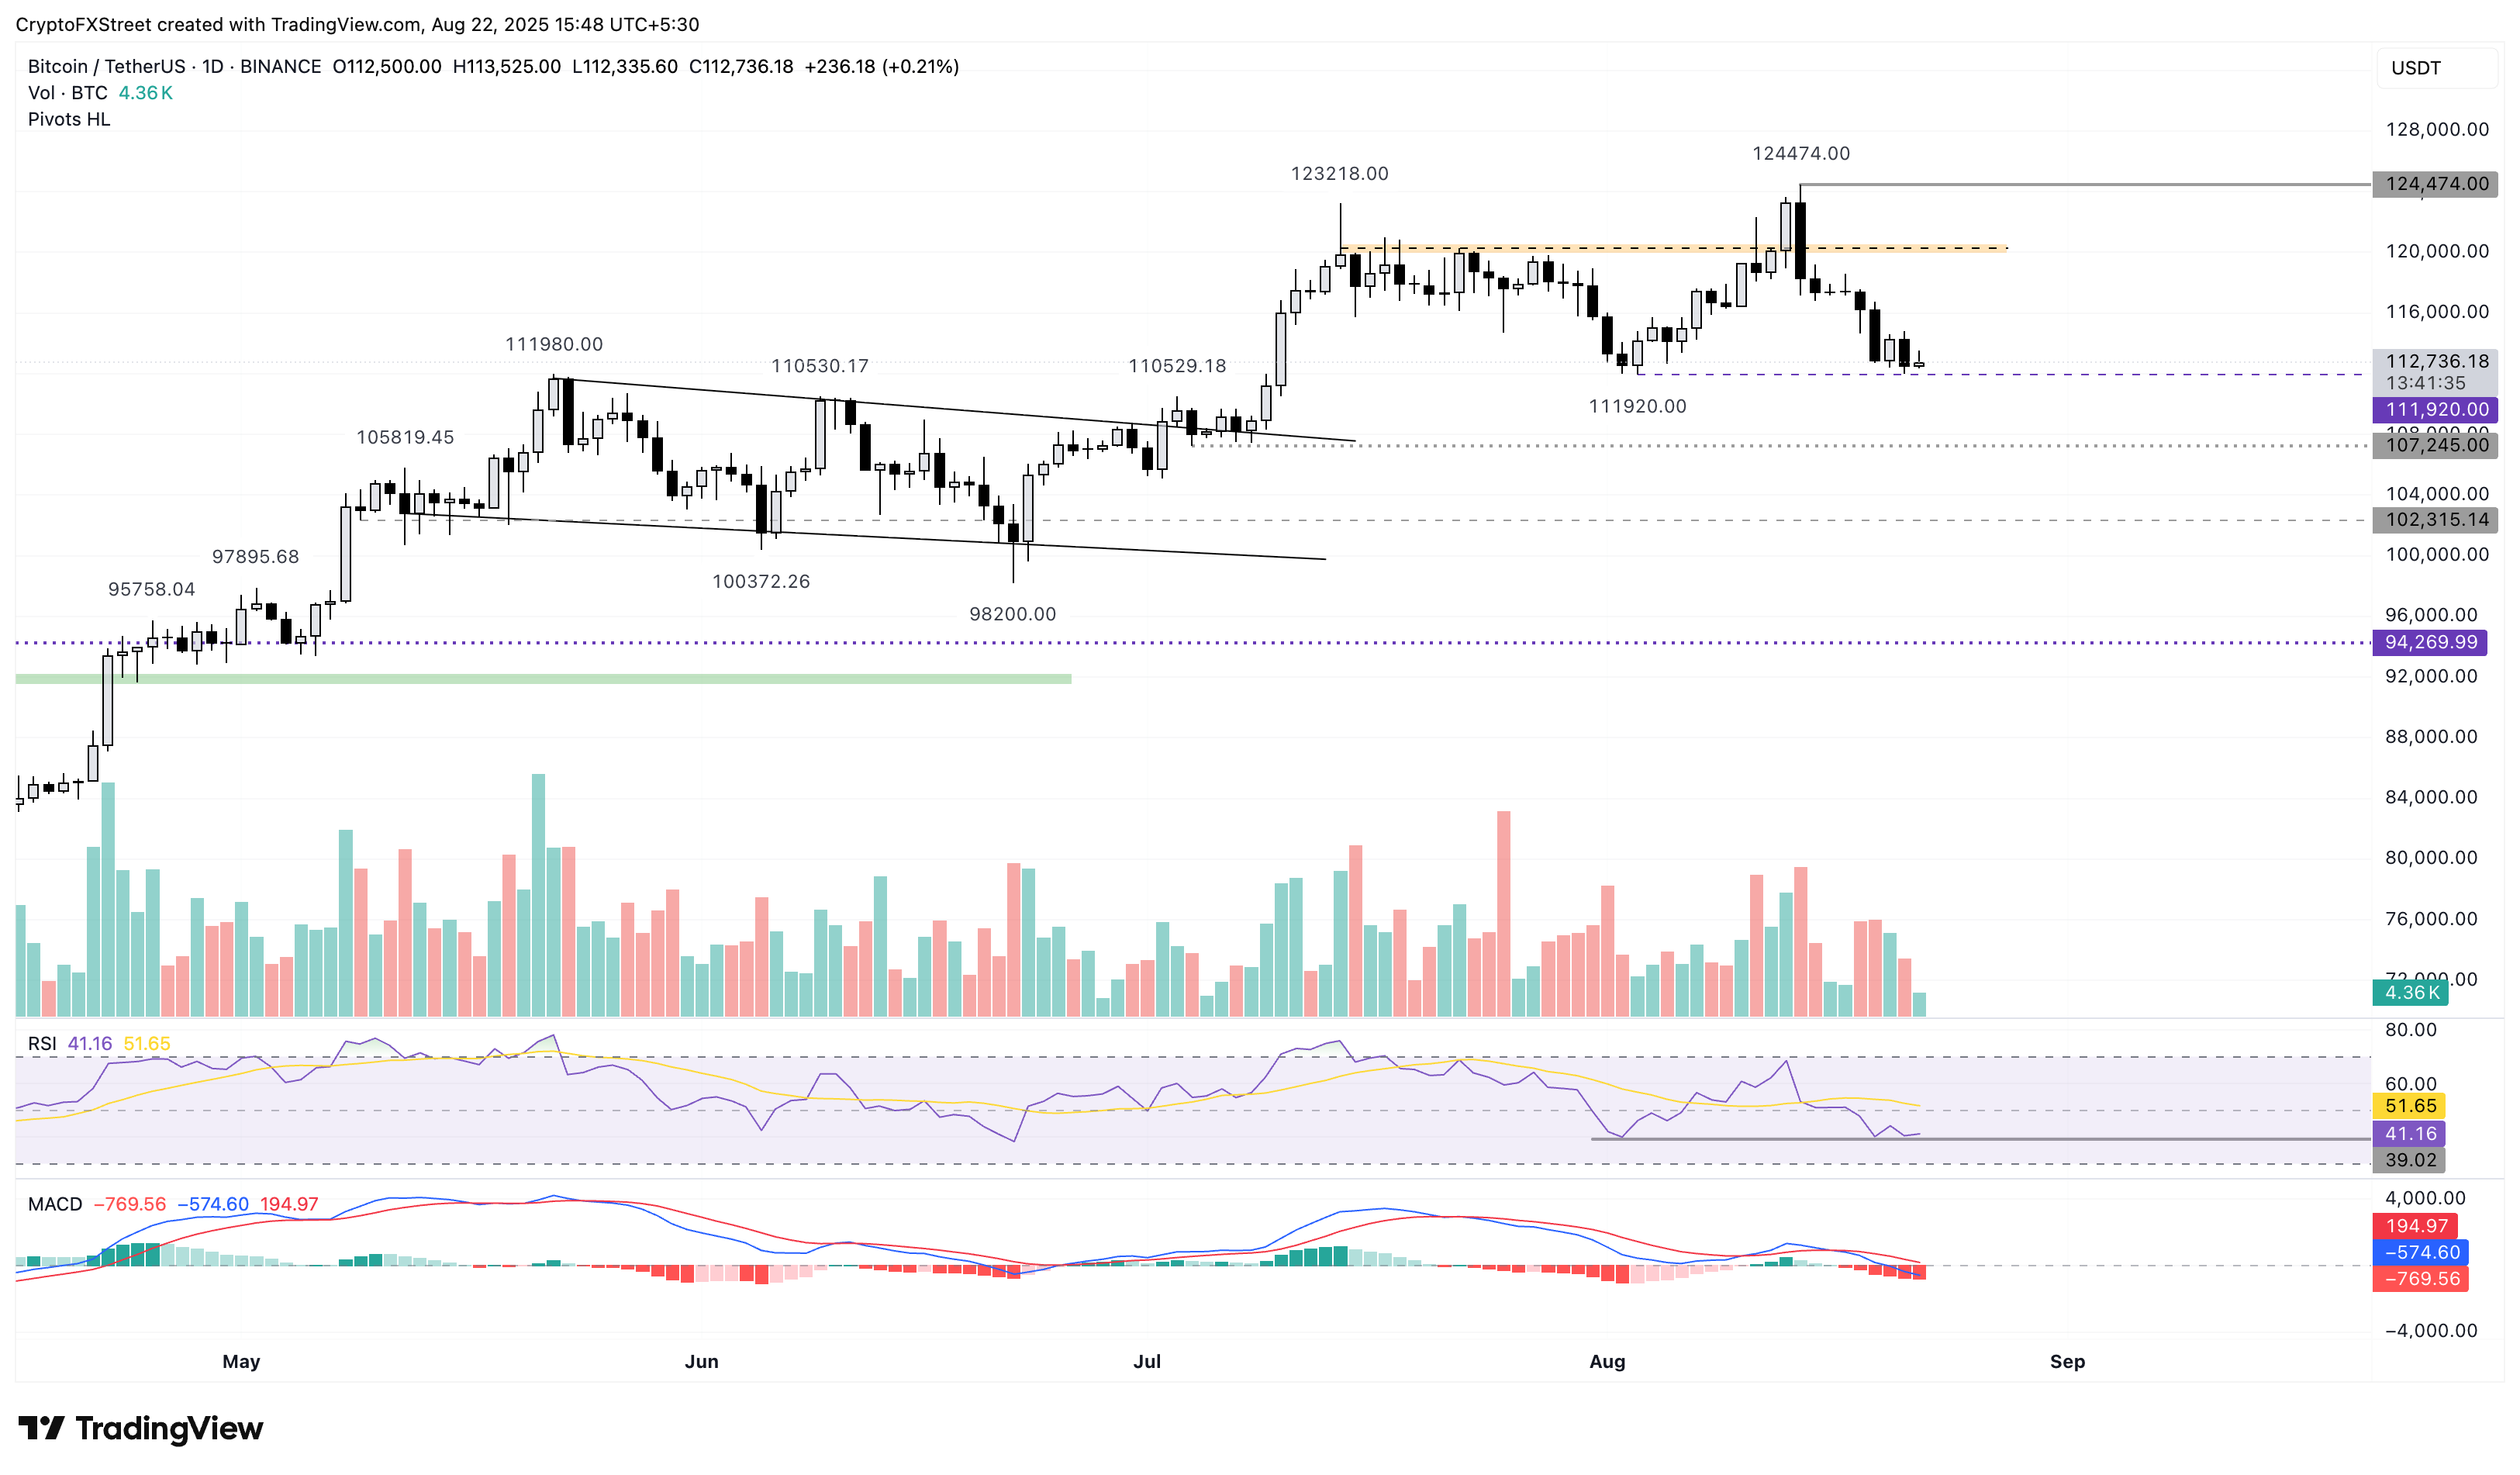
BTC/USDT price daily chart.
A bounce back in Bitcoin could kickstart the BTC rally, aiming towards the $120,000 supply zone.
Ethereum in a rising channel upholds optimism
Ethereum edges higher by over 1.50% at press time on Friday, following the 2.56% drop from the previous day. The largest altcoin by market capitalization, at $518 billion, struggles to retrace higher within a rising channel pattern.
A potential continuation of the uptrend in ETH could target the all-time high of $4,868.
The MACD indicator on the daily chart suggests a bearish bias as the average lines decline towards the zero line, accompanied by rising red histogram bars. Still, the RSI reads 56 on the same chart, pointing upwards, with room for growth above the neutral levels.
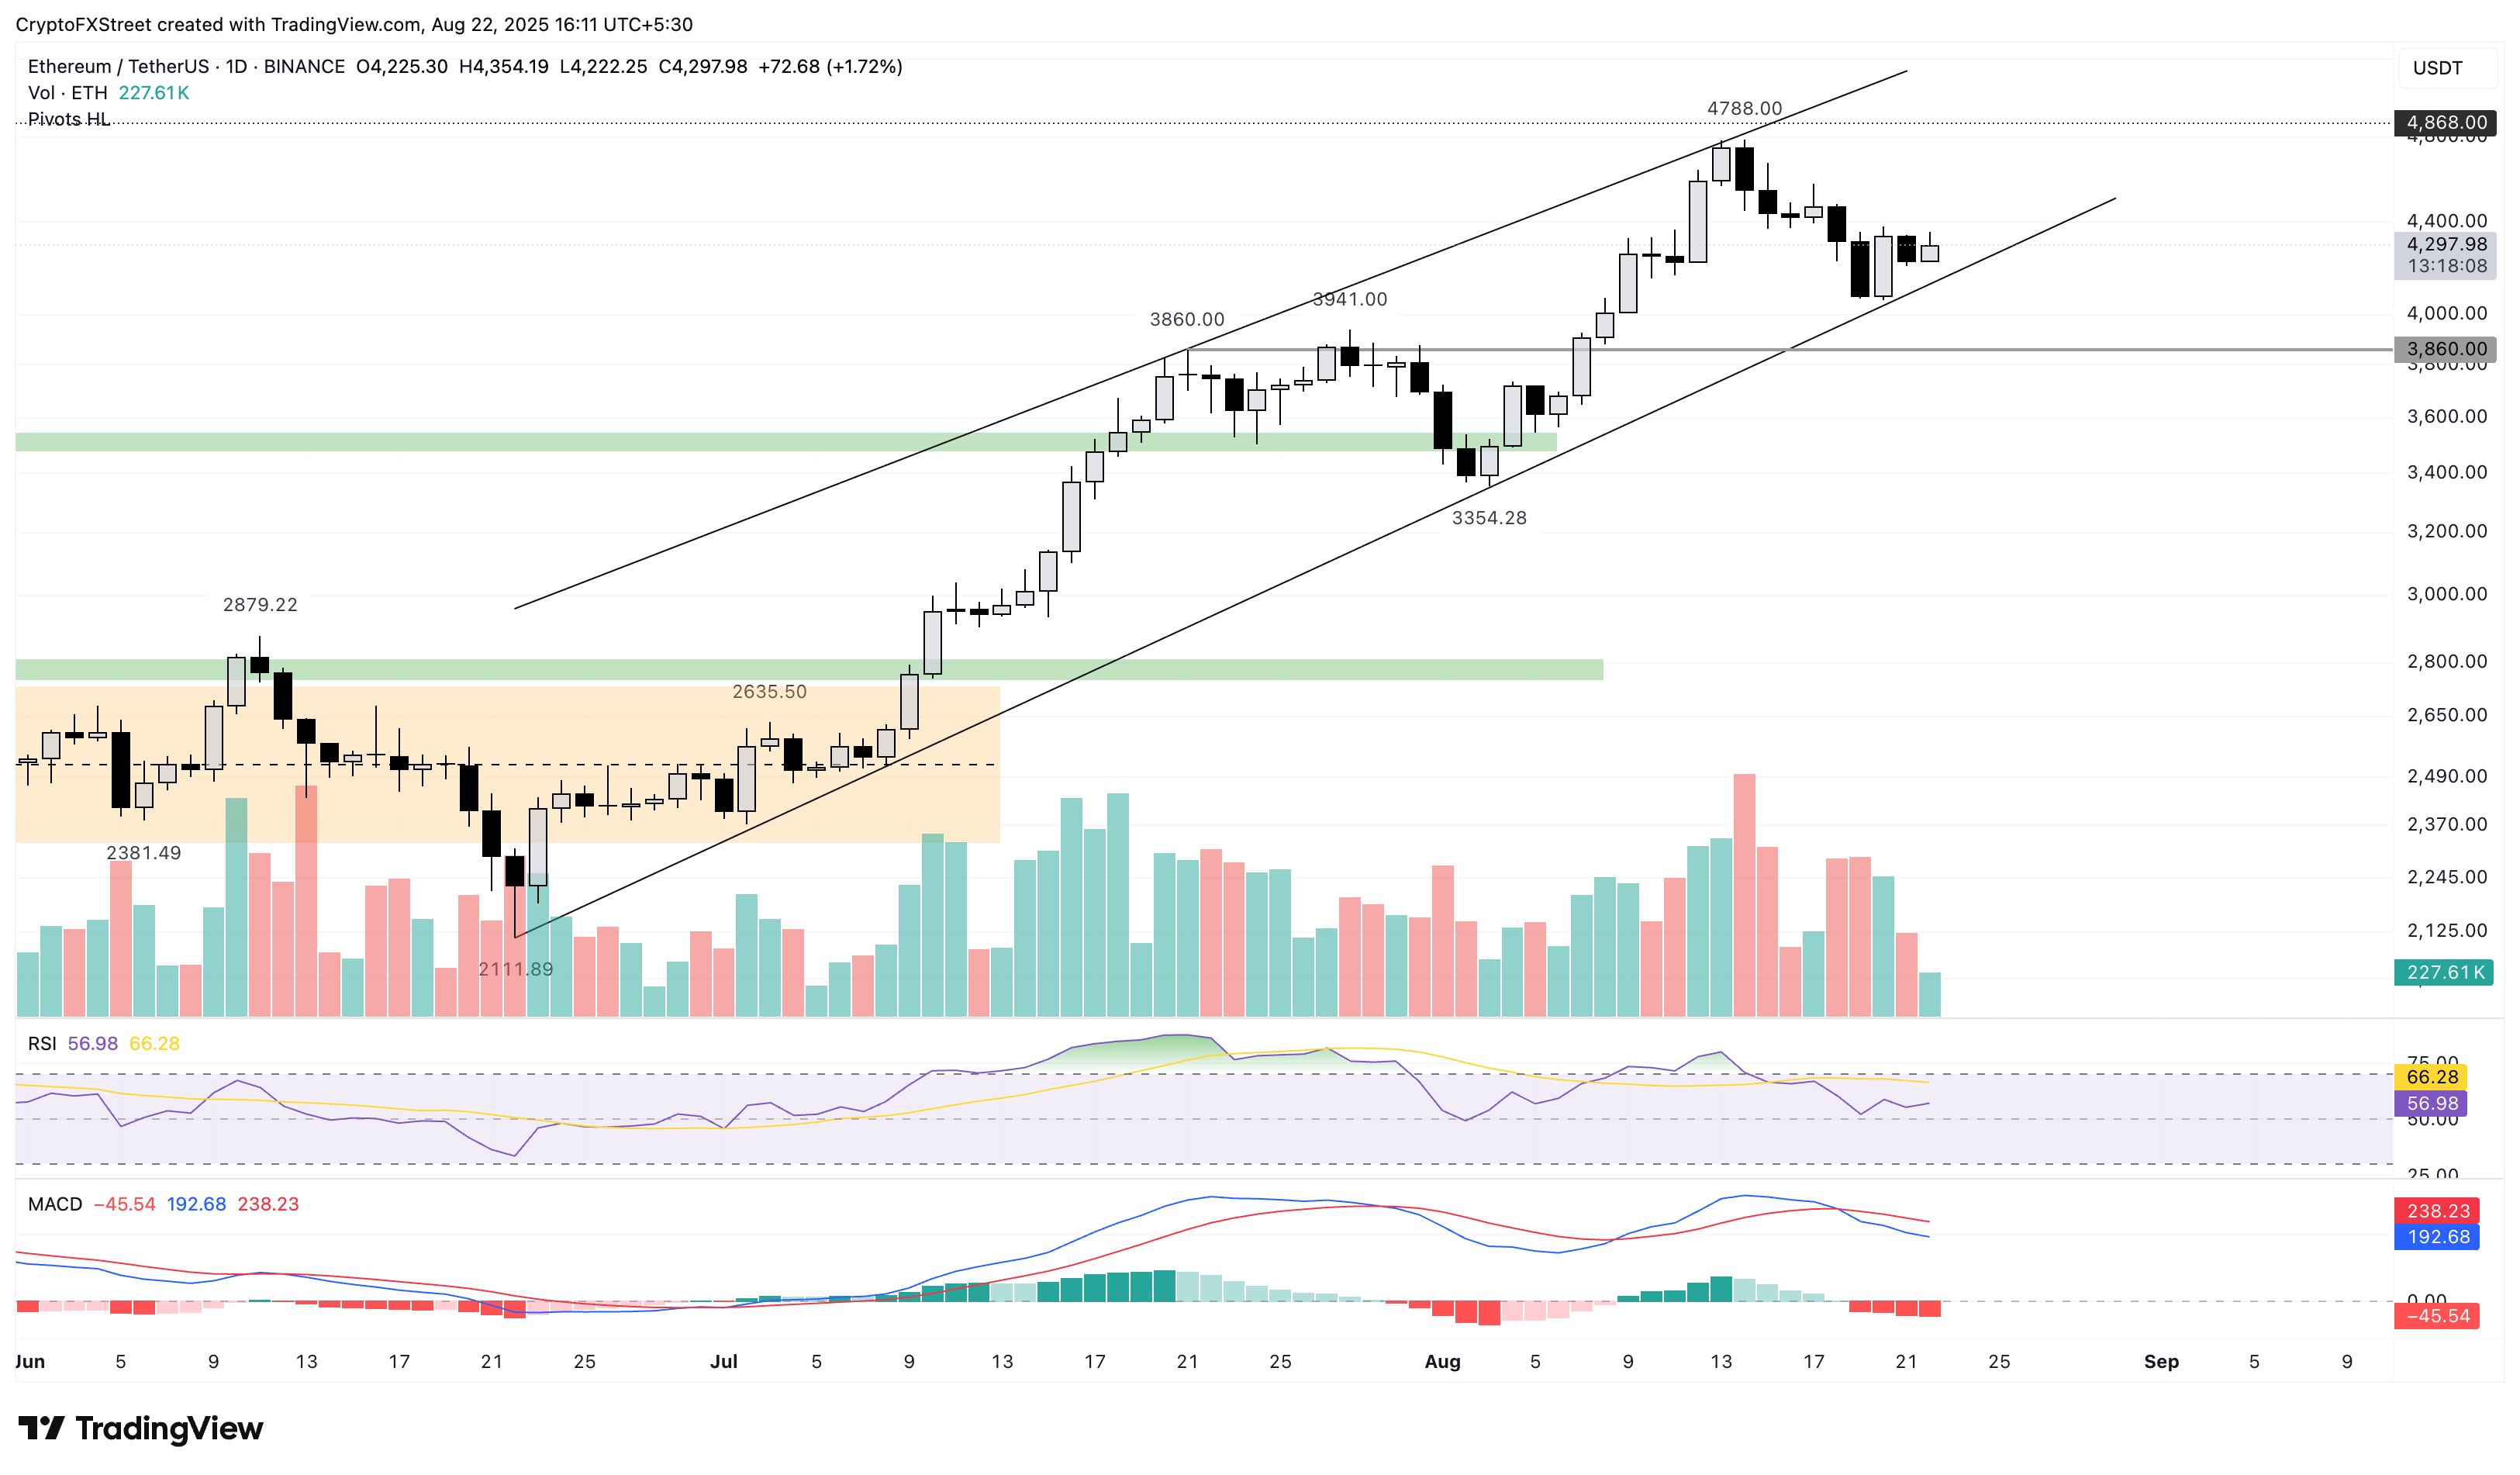
ETH/USDT price daily chart.
Looking down, a potential reversal in Ethereum below the support trendline, close to the $4,100 level, could cause prices to crash to the $3,860 level, marked by the high of July 21.
XRP eyes monthly low as selling pressure increases
XRP edges lower by under 0.50% at press time on Friday, extending the 3.36% loss from Thursday. The declining trend ticks below the 38.2% Fibonacci level at $2.85, which is drawn from the $1.90 low on June 22 to the $3.66 peak on July 18, risking further losses.
XRP could test the $2.75 demand zone, highlighted in yellow on the daily chart (shared below), if supply pressure increases.
The momentum indicators support double down on the downside risk as the MACD and its signal line trend lower amid rising red histogram bars. This indicates risk-off sentiment among investors.
Additionally, the RSI at 41, pointing downwards, eyes the oversold zone with further room for correction.
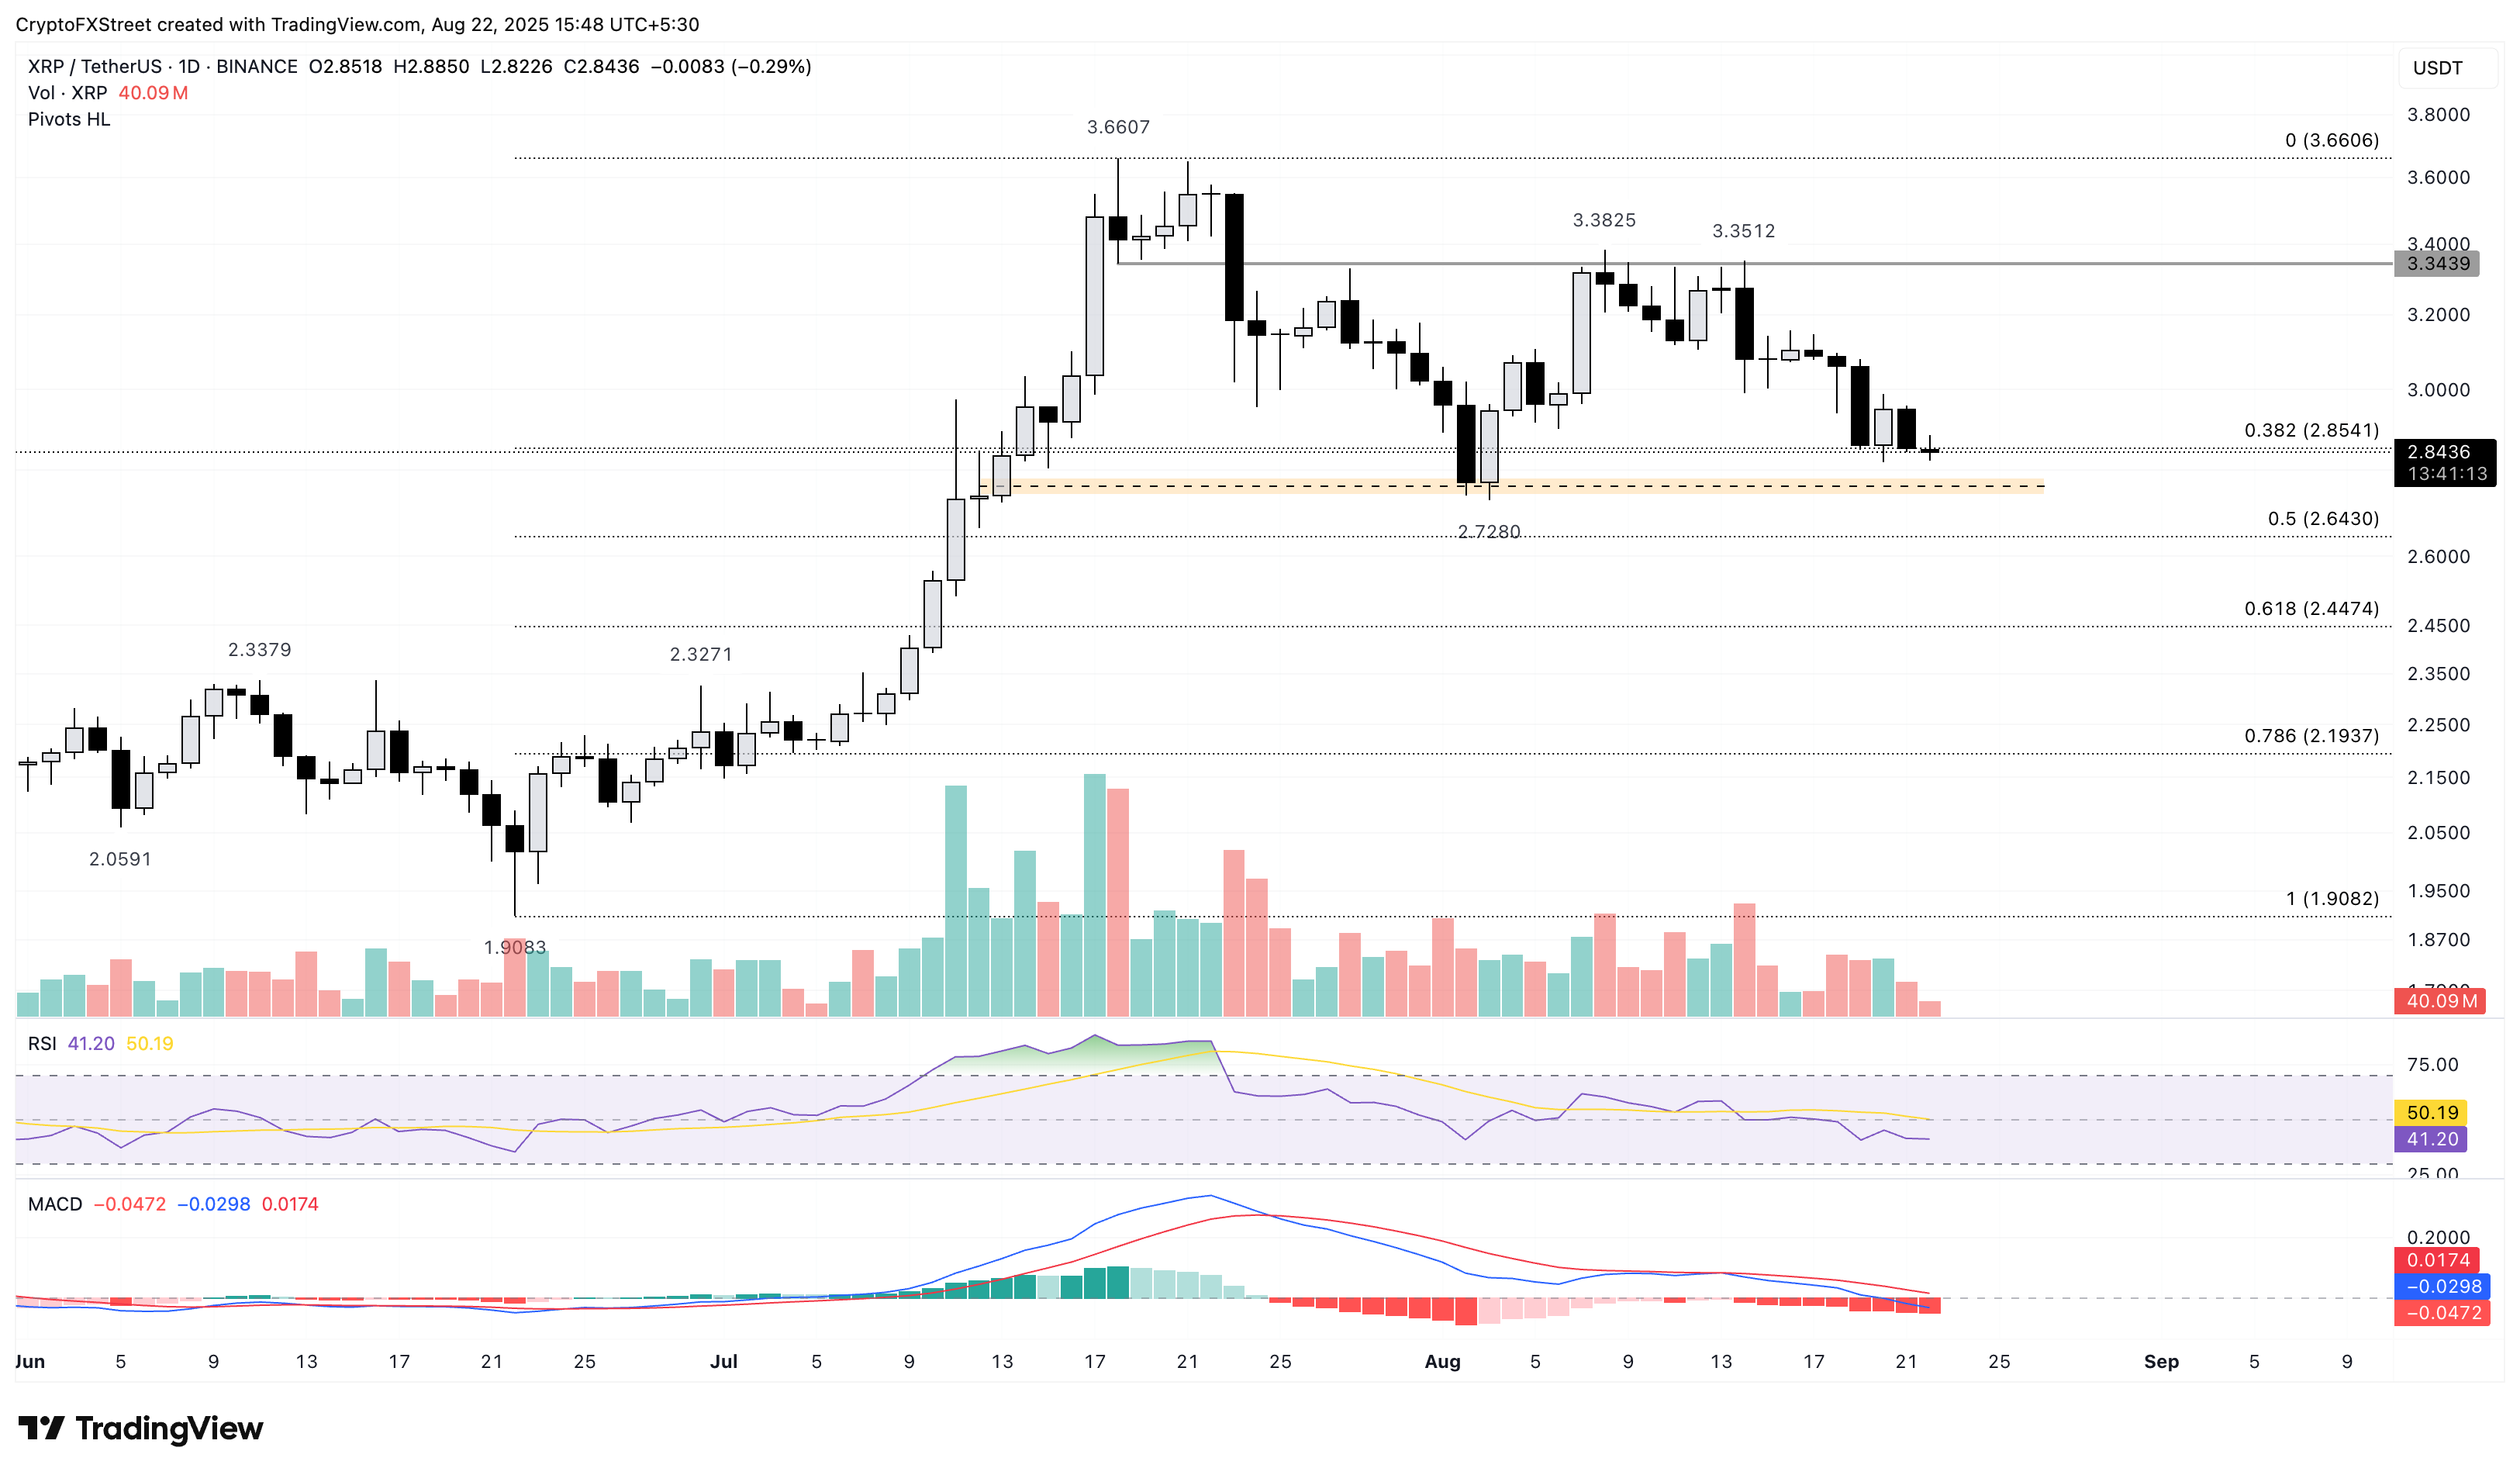
XRP/USDT price daily chart.
On the contrary, if XRP reclaims the $3.00 psychological level, the rejuvenated uptrend could target the $3.66 peak.
Cryptocurrency prices FAQs
Token launches influence demand and adoption among market participants. Listings on crypto exchanges deepen the liquidity for an asset and add new participants to an asset’s network. This is typically bullish for a digital asset.
A hack is an event in which an attacker captures a large volume of the asset from a DeFi bridge or hot wallet of an exchange or any other crypto platform via exploits, bugs or other methods. The exploiter then transfers these tokens out of the exchange platforms to ultimately sell or swap the assets for other cryptocurrencies or stablecoins. Such events often involve an en masse panic triggering a sell-off in the affected assets.
Macroeconomic events like the US Federal Reserve’s decision on interest rates influence crypto assets mainly through the direct impact they have on the US Dollar. An increase in interest rate typically negatively influences Bitcoin and altcoin prices, and vice versa. If the US Dollar index declines, risk assets and associated leverage for trading gets cheaper, in turn driving crypto prices higher.
Halvings are typically considered bullish events as they slash the block reward in half for miners, constricting the supply of the asset. At consistent demand if the supply reduces, the asset’s price climbs.

FXStreet
超過一百萬用戶依賴 FXStreet 獲取即時市場數據、圖表工具、專家洞見與外匯新聞。其全面的經濟日曆與教育網路研討會協助交易者保持資訊領先、做出審慎決策。FXStreet 擁有約 60 人的團隊,分布於巴塞隆納總部及全球各地。
Read More


