
Trade The World
Dogecoin Price Forecast: DOGE bulls aiming for $0.30 mark
作者 Manish Chhetri
發布日期: 7 Oct 2025 | 修改日期: 7 Oct 2025


POPULAR ARTICLES

Dogecoin (DOGE) trades in green on Tuesday after rallying more than 5% the previous day. On-chain metrics indicate a growing accumulation by holders, while the technical outlook suggests further gains, with the $0.30 mark emerging as the next key target.
- Dogecoin price trades in the green on Tuesday after rallying more than 5% the previous day.
- On-chain data show that holders are accumulating DOGE tokens.
- The technical outlook suggests a continuation of the rally, targeting the $0.30 mark.
Dogecoin (DOGE) trades in green on Tuesday after rallying more than 5% the previous day. On-chain metrics indicate a growing accumulation by holders, while the technical outlook suggests further gains, with the $0.30 mark emerging as the next key target.
Dogecoin holders buy the dips
Santiment’s Supply Distribution data supports a bullish outlook for Dogecoin. The metric indicates that whales holding between 100,000 and 1 million (red line), and between 10 million and 100 million (blue line), have accumulated 390 million tokens since September 23. During the same period, wallets holding between 1 million and 10 million DOGE tokens (yellow line) have shed 10 million tokens.
This shows that the second cohort of whales could have fallen prey to the capitulation event. In contrast, the first set of wallets seized the opportunity and accumulated DOGE at a discount.
 [08-1759813708931-1759813708933.26.51, 07 Oct, 2025].png)
Dogecoin supply distribution chart. Source: Santiment
Dogecoin Price Forecast: DOGE bulls aiming for $0.30 mark
Dogecoin price found support around the 50% Fibonacci retracement level at $0.22 on September 26 and rallied nearly 20% until Monday, closing above the daily resistance at $0.25. At the time of writing on Tuesday, it trades around $0.26.
If DOGE continues its upward momentum, it could extend the rally toward the key psychological level at $0.30.
The Relative Strength Index (RSI) on the daily chart reads 59, which is above the neutral level of 50, indicating that bullish momentum is gaining traction. Moreover, the Moving Average Convergence Divergence (MACD) also showed a bullish crossover last week. Additionally, the rising green histogram bars above the neutral level further indicate a bullish momentum and continuation of an upward trend.
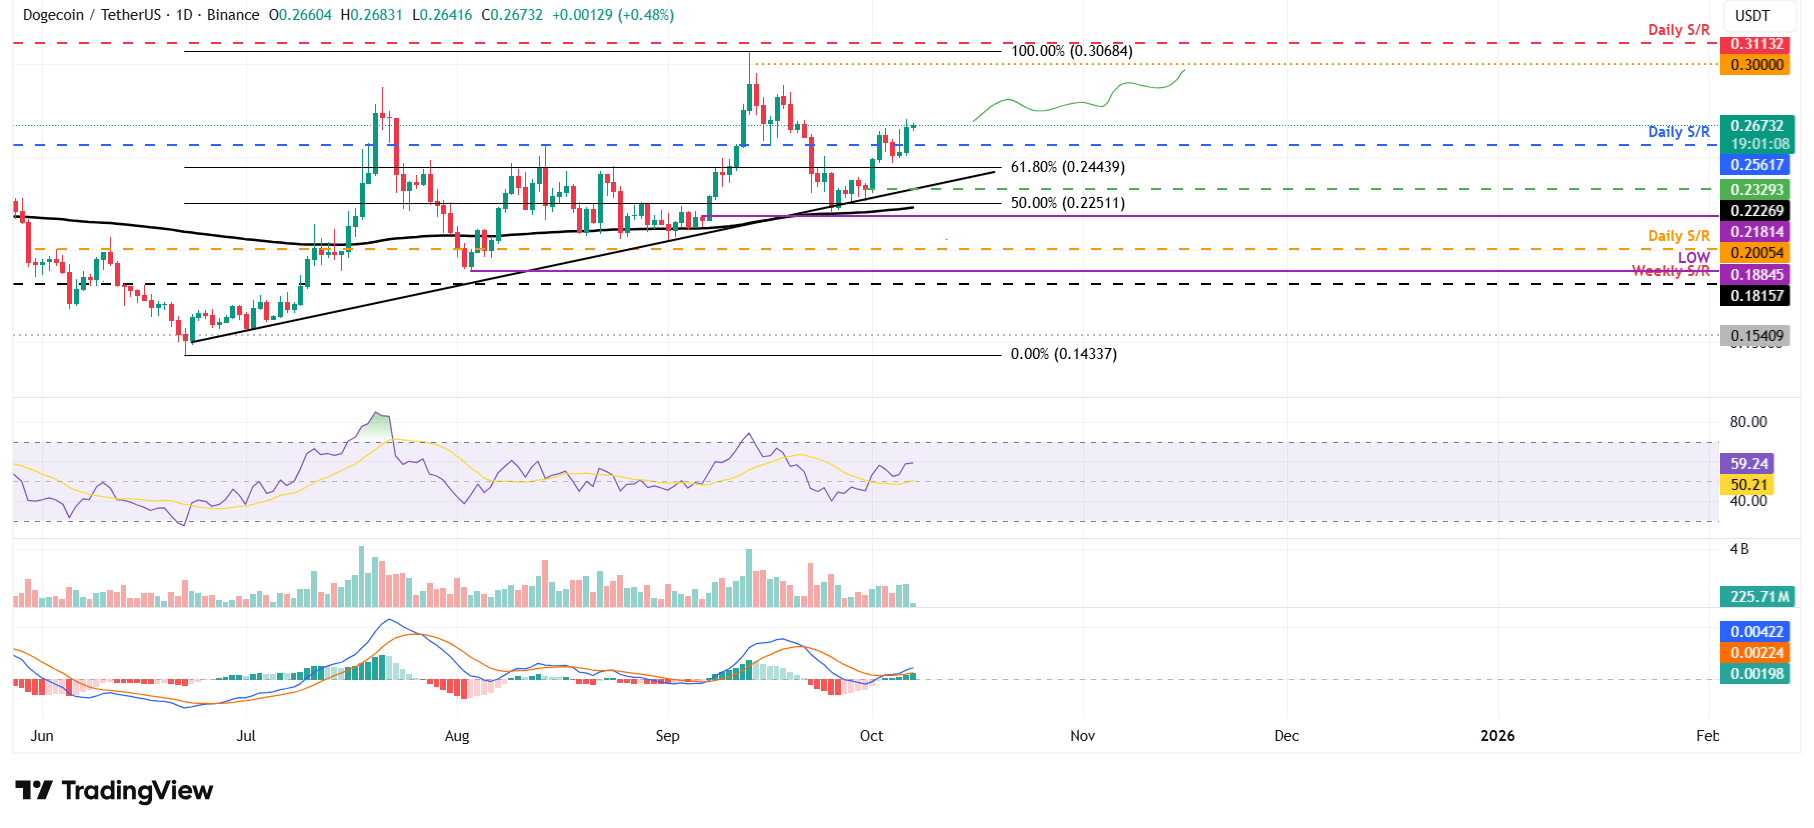
DOGE/USDT daily chart
However, if DOGE faces a correction, it could extend the decline toward the daily support at $0.25.

FXStreet
超過一百萬用戶依賴 FXStreet 獲取即時市場數據、圖表工具、專家洞見與外匯新聞。其全面的經濟日曆與教育網路研討會協助交易者保持資訊領先、做出審慎決策。FXStreet 擁有約 60 人的團隊,分布於巴塞隆納總部及全球各地。
Read More


