
Trade The World
Dogecoin price offers multiple sell signals as crypto pullback dims optimism for altcoin season
作者 John Isige
發布日期: 26 Jul 2025 | 修改日期: 26 Jul 2025


POPULAR ARTICLES

Dogecoin (DOGE) leads the retreat of meme coins, trading at $0.2251 on Friday. The decline reflects risk-off sentiment building after cryptocurrency prices generally rallied over the past three weeks, pushing the total market capitalization above the $4 trillion mark.
- Dogecoin extends its decline by 22% from its recent high as meme coins aggressively claw back gains.
- The RSI reversal indicates a decline in speculative demand ahead of a potential MACD sell signal.
- A neutral Spot Volume Bubble Map suggests that the market is not overheating and a bullish reversal is possible.
Dogecoin (DOGE) leads the retreat of meme coins, trading at $0.2251 on Friday. The decline reflects risk-off sentiment building after cryptocurrency prices generally rallied over the past three weeks, pushing the total market capitalization above the $4 trillion mark.
If the sell-off persists in upcoming sessions, DOGE could slide below a recently broken descending trendline resistance and retest a robust support provided by several moving averages around $0.2000 zone on the daily chart.
Dogecoin uptrend snaps as run-up to the altcoin season falters
The overall rally in altcoins over the past three weeks saw a spike in the Altcoin Season Index, which peaked at 59 before reversing to 45 at the time of writing.
The altcoin season refers to a period when cryptocurrencies other than Bitcoin (BTC), including Ethereum (ETH), Ripple (XRP), Dogecoin (DOGE) and others, outperform BTC over 90 days.
Such a signal is triggered with the index crossing above 75. The next few weeks could be instrumental in providing insight into the market's status and whether altcoins are poised to rally, indicating targeted capital rotation from Bitcoin.
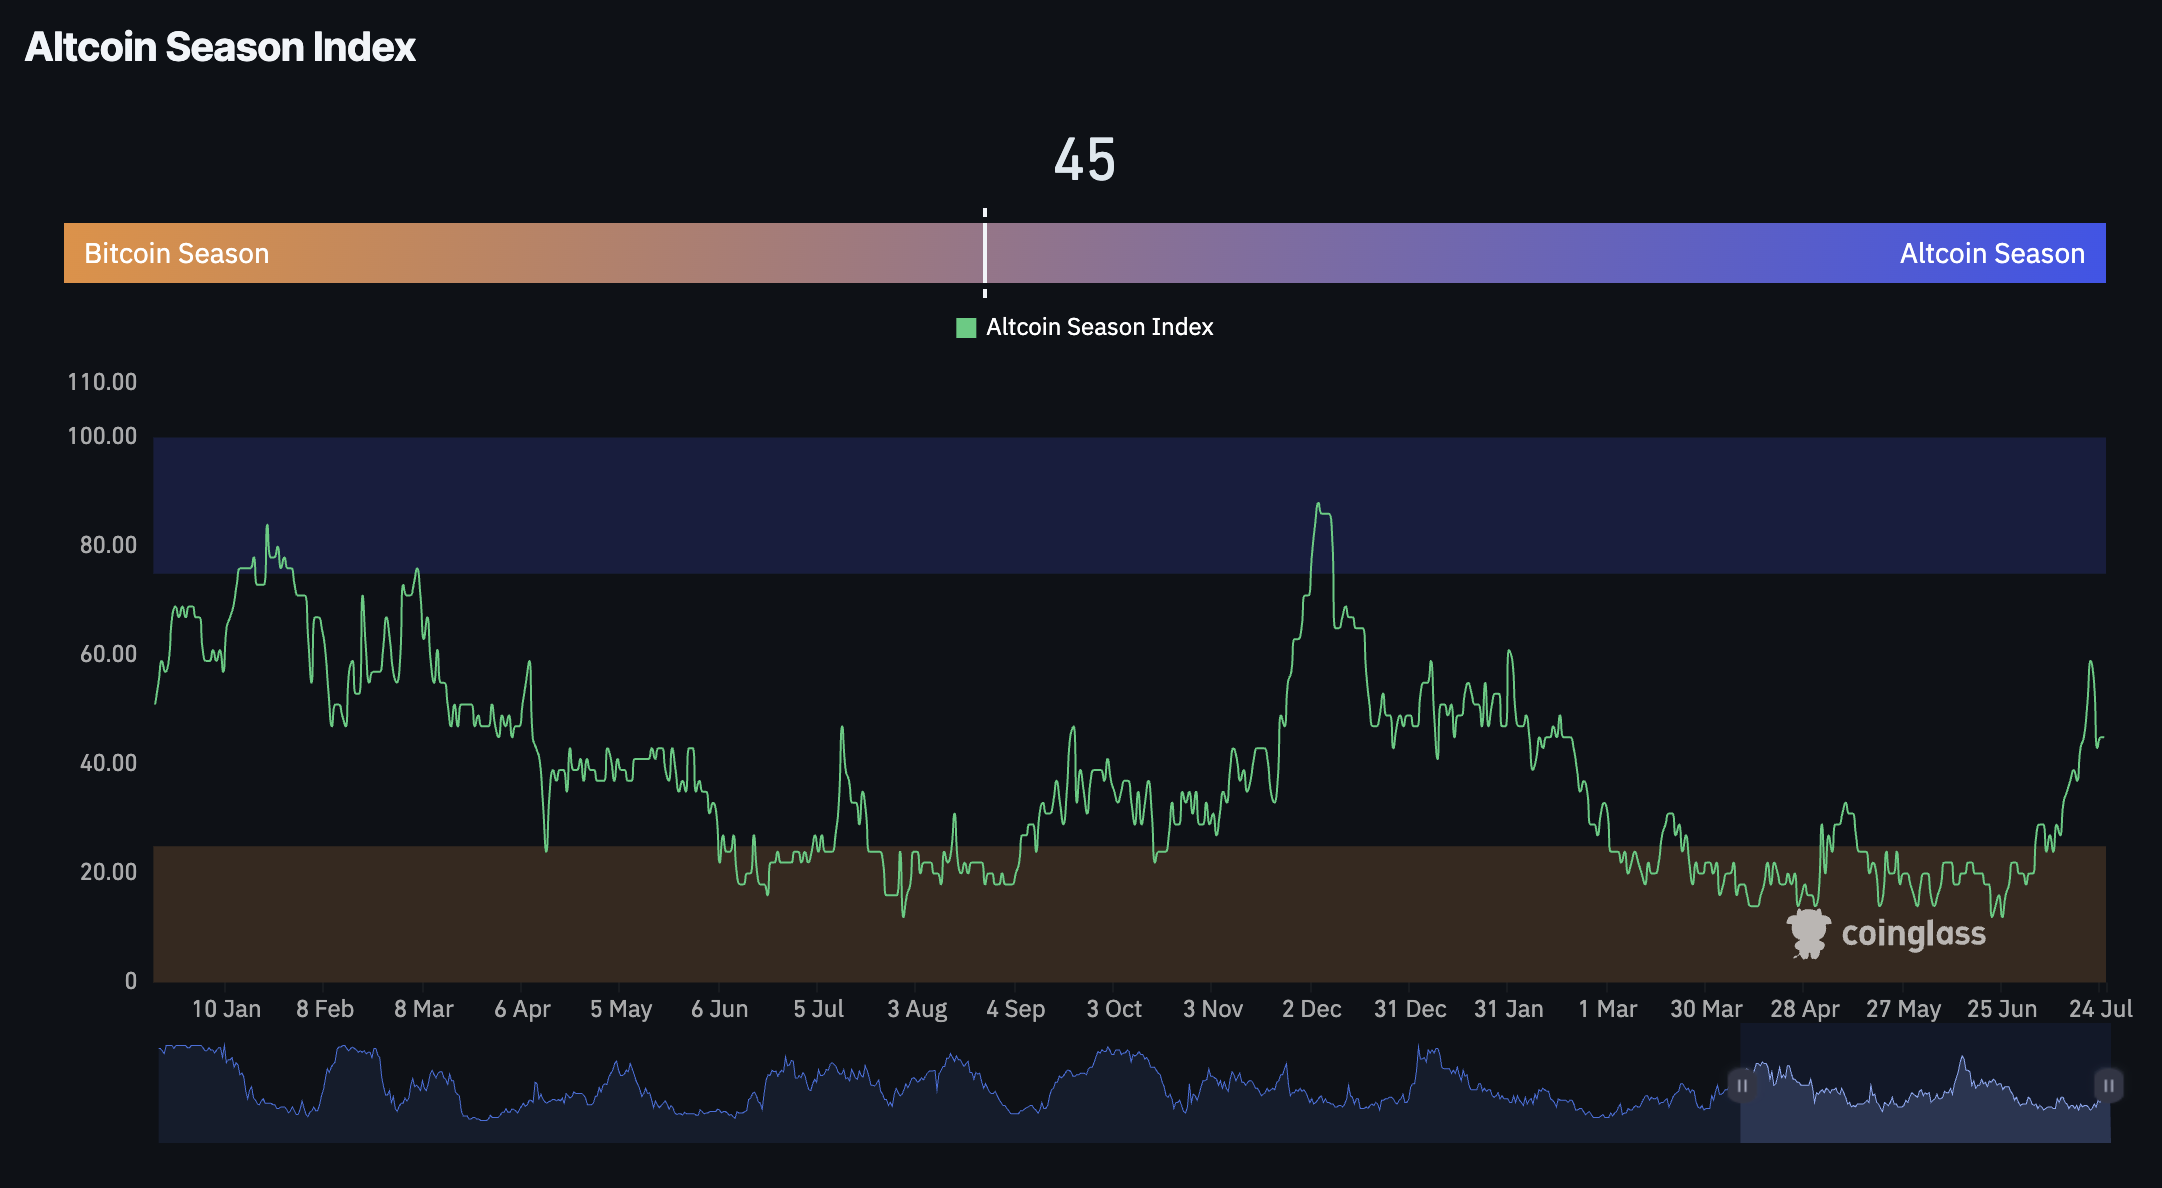
Altcoin Season Index | Source: CoinGlass
Technical outlook: What's next for Dogecoin as downside risk persists
Dogecoin price holds above the support provided by a recently broken descending trendline as shown on the daily chart below. Its technical structure exhibits a bearish bias, as evidenced by the Relative Strength Index (RSI) falling toward the midline after peaking at 85 during the rally to a five-month high of $0.2873.
If the RSI decline continues below the midline, it will indicate bearish momentum amid a significant reduction in speculative demand. The Moving Average Convergence Divergence (MACD) is on the verge of validating a sell signal. Traders will consider reducing exposure if the blue MACD line crosses and settles below the red signal line.
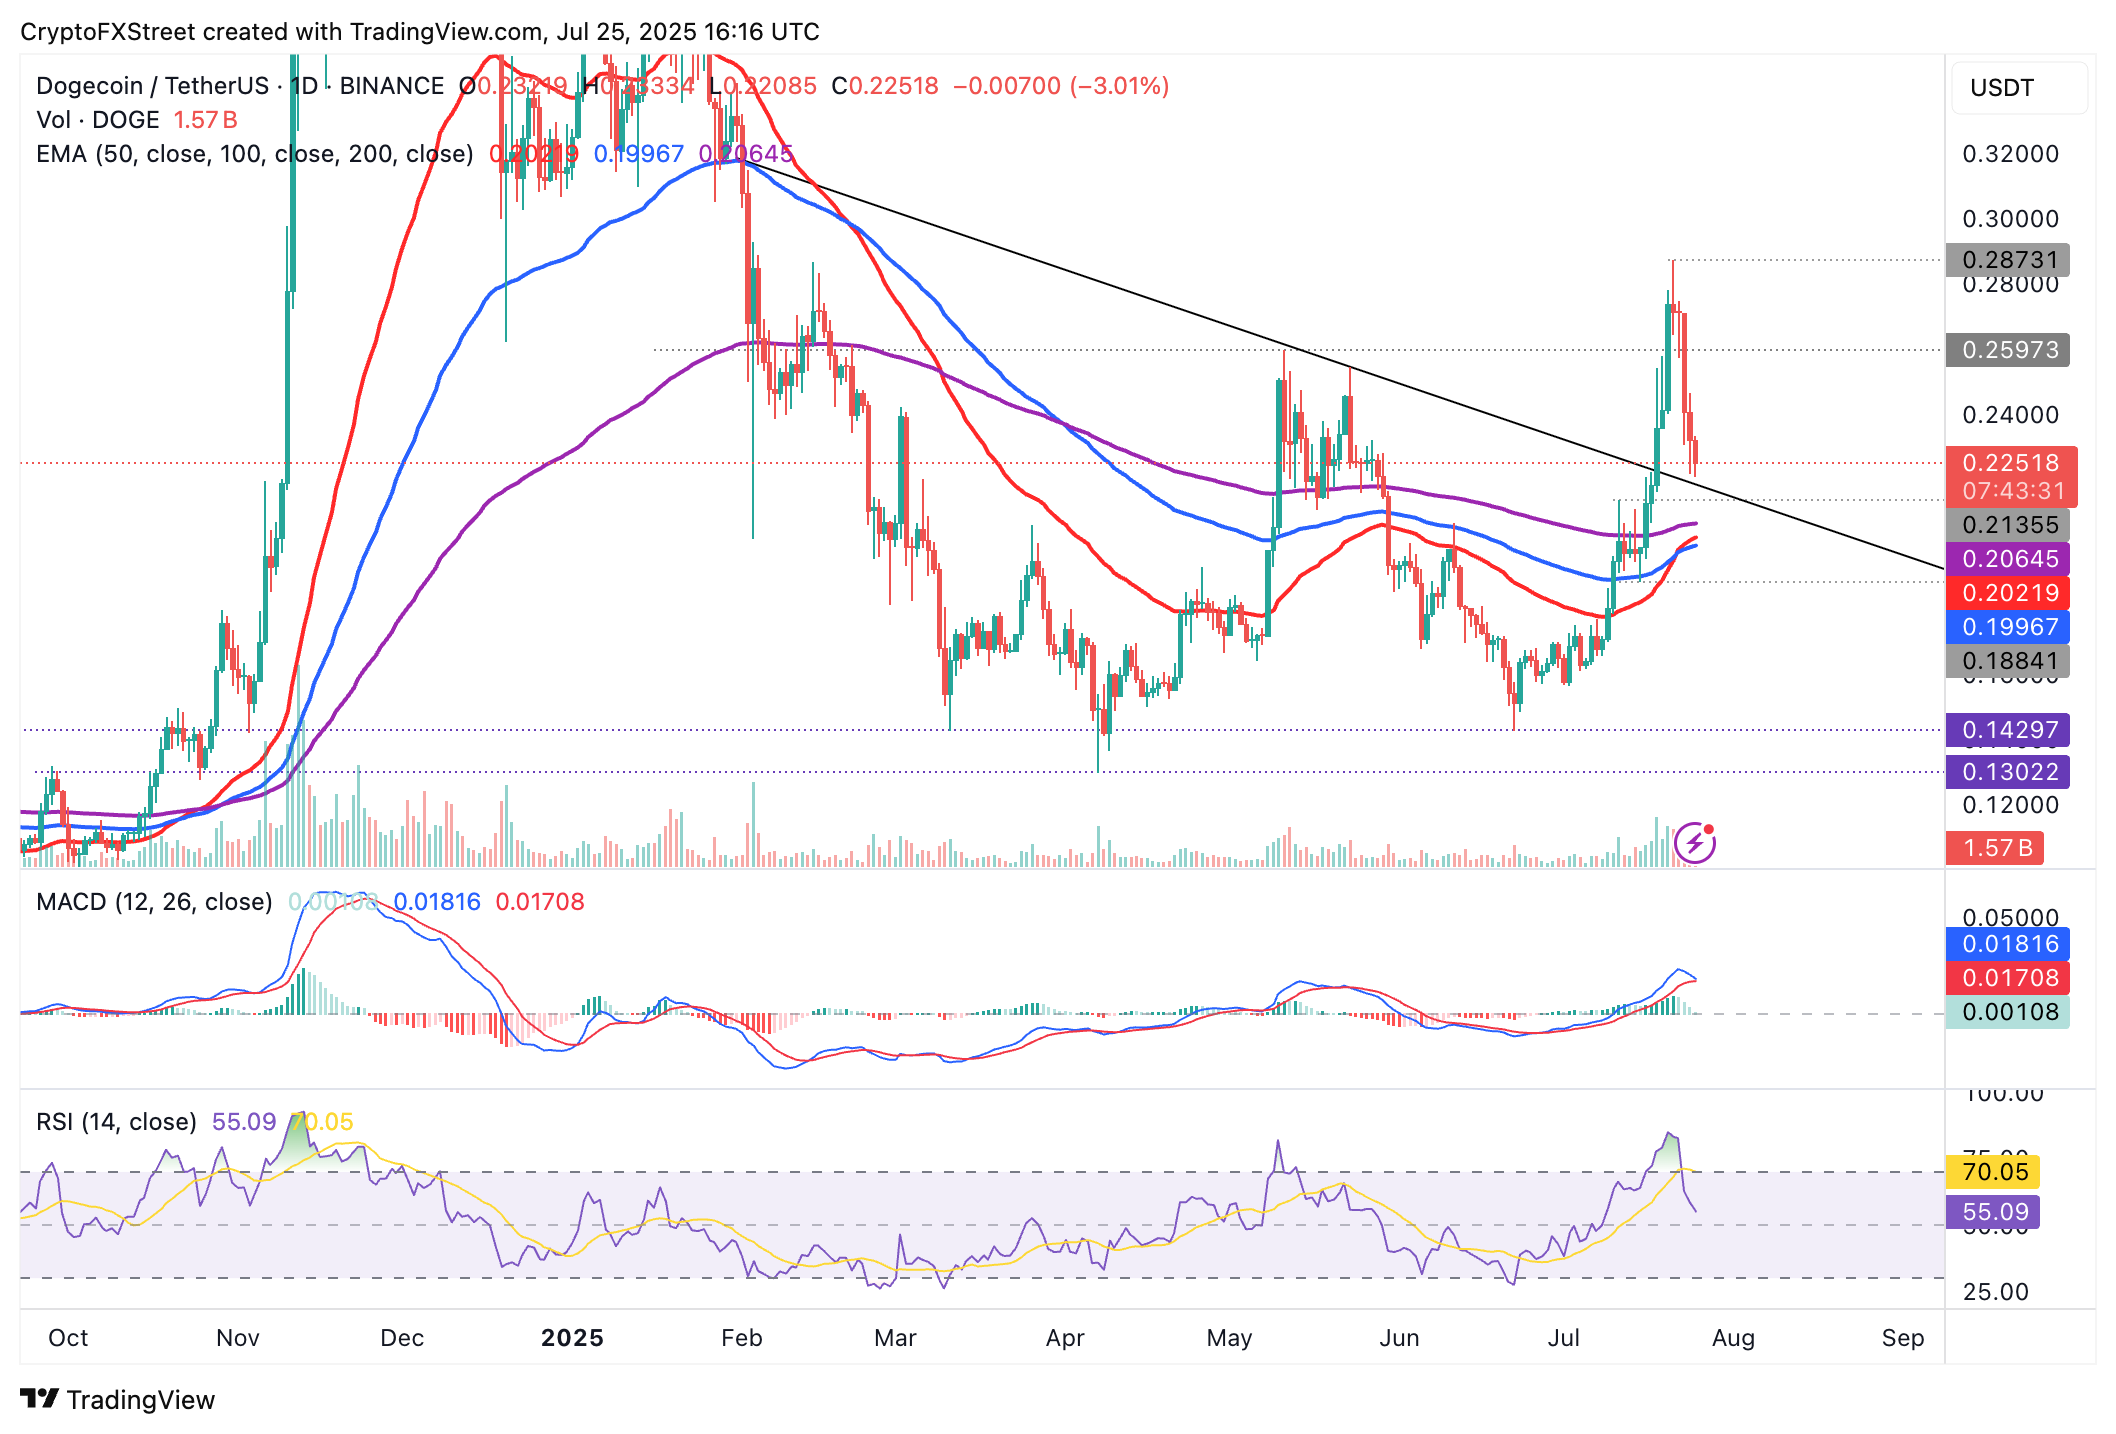
DOGE/USDT daily chart
In the event the price extends the decline beyond the descending trendline, the 200-day Exponential Moving Average (EMA), the 100-day EMA and the 50-day EMA, all clustered in the range of $0.1996 to $0.2064, would serve as support to prevent the down leg from accelerating toward June lows of $0.1429.
Still, traders should consider tempering their bullish expectations, especially given that the Spot Volume Bubble Map remains neutral, as highlighted by CryptoQuant.
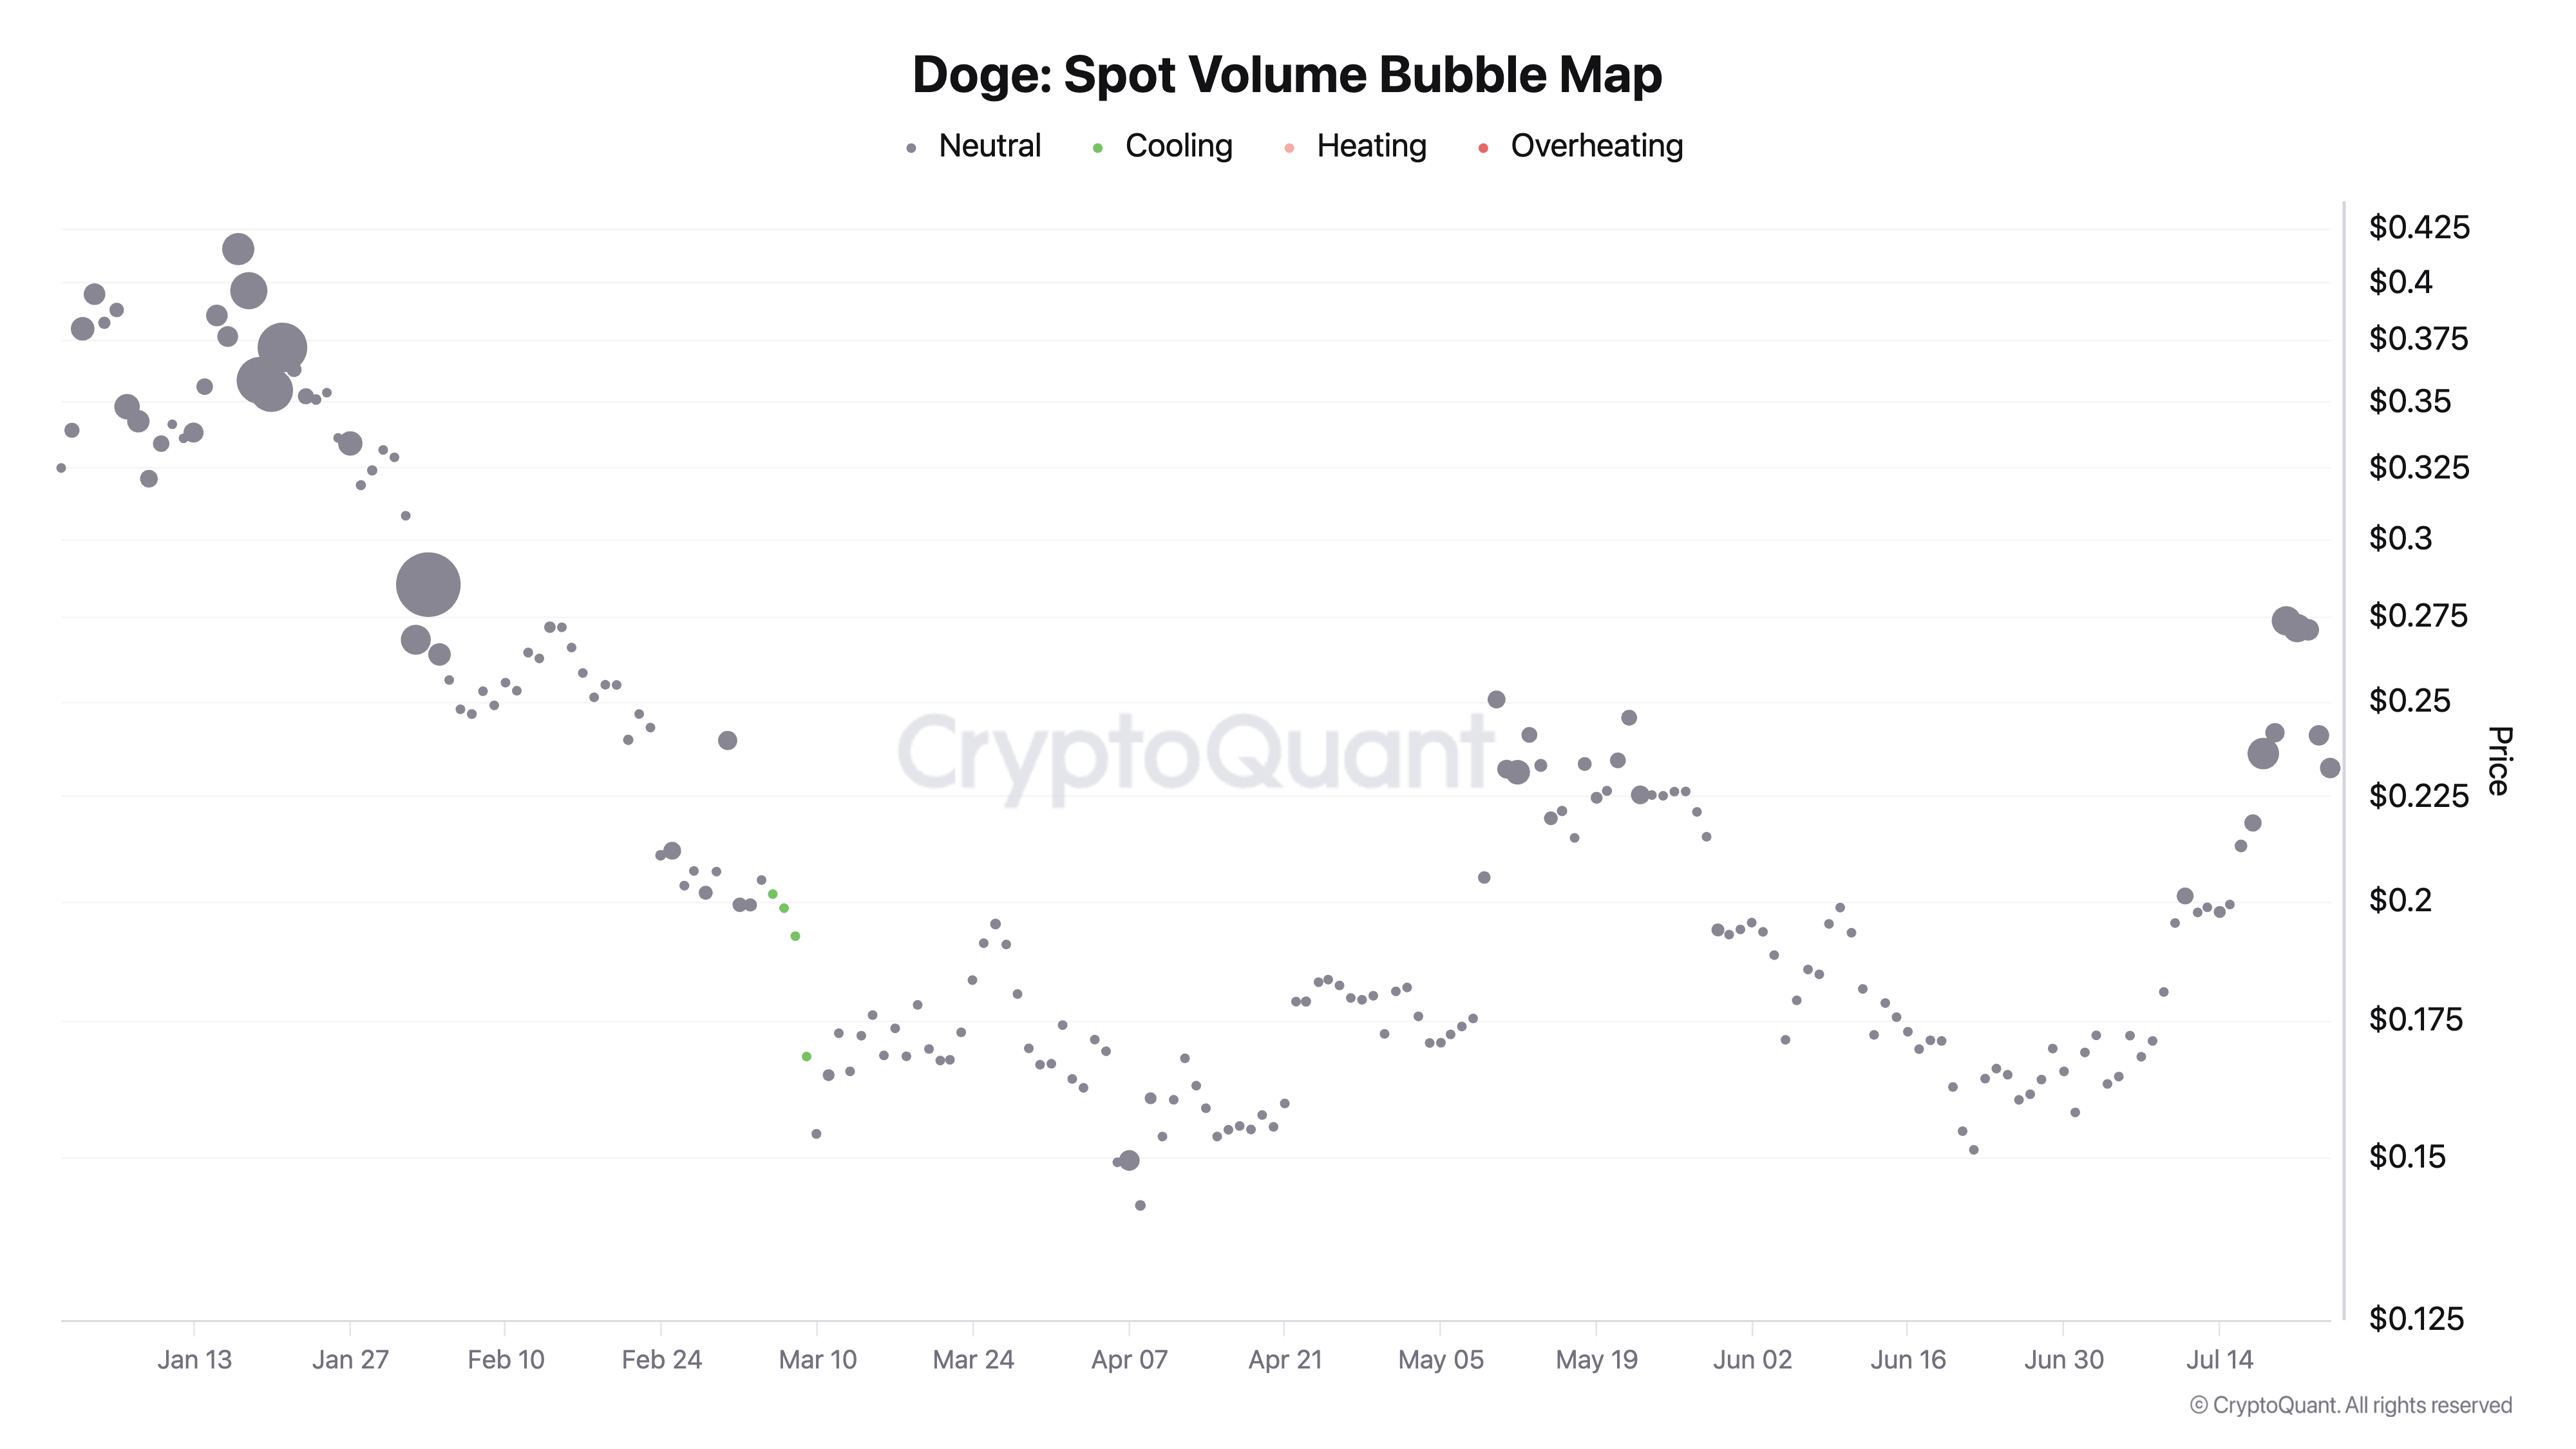
Dogecoin Spot Volume Bubble Map | Source: CryptoQuant
Neutral in this metric implies trading volume is decreasing and not overheating. Hence, if Dogecoin stabilizes, a recovery could ensue, boosting the uptrend to target key levels, such as the yearly high of $0.4331.
Cryptocurrency metrics FAQs
The developer or creator of each cryptocurrency decides on the total number of tokens that can be minted or issued. Only a certain number of these assets can be minted by mining, staking or other mechanisms. This is defined by the algorithm of the underlying blockchain technology. On the other hand, circulating supply can also be decreased via actions such as burning tokens, or mistakenly sending assets to addresses of other incompatible blockchains.
Market capitalization is the result of multiplying the circulating supply of a certain asset by the asset’s current market value.
Trading volume refers to the total number of tokens for a specific asset that has been transacted or exchanged between buyers and sellers within set trading hours, for example, 24 hours. It is used to gauge market sentiment, this metric combines all volumes on centralized exchanges and decentralized exchanges. Increasing trading volume often denotes the demand for a certain asset as more people are buying and selling the cryptocurrency.
Funding rates are a concept designed to encourage traders to take positions and ensure perpetual contract prices match spot markets. It defines a mechanism by exchanges to ensure that future prices and index prices periodic payments regularly converge. When the funding rate is positive, the price of the perpetual contract is higher than the mark price. This means traders who are bullish and have opened long positions pay traders who are in short positions. On the other hand, a negative funding rate means perpetual prices are below the mark price, and hence traders with short positions pay traders who have opened long positions.

FXStreet
超過一百萬用戶依賴 FXStreet 獲取即時市場數據、圖表工具、專家洞見與外匯新聞。其全面的經濟日曆與教育網路研討會協助交易者保持資訊領先、做出審慎決策。FXStreet 擁有約 60 人的團隊,分布於巴塞隆納總部及全球各地。
Read More


