
Trade The World
EUR/JPY Price Forecast: Rises above 183.00 to test nine-day EMA barrier
作者 Akhtar Faruqui
發布日期: 9 Jan 2026 | 修改日期: 9 Jan 2026


POPULAR ARTICLES

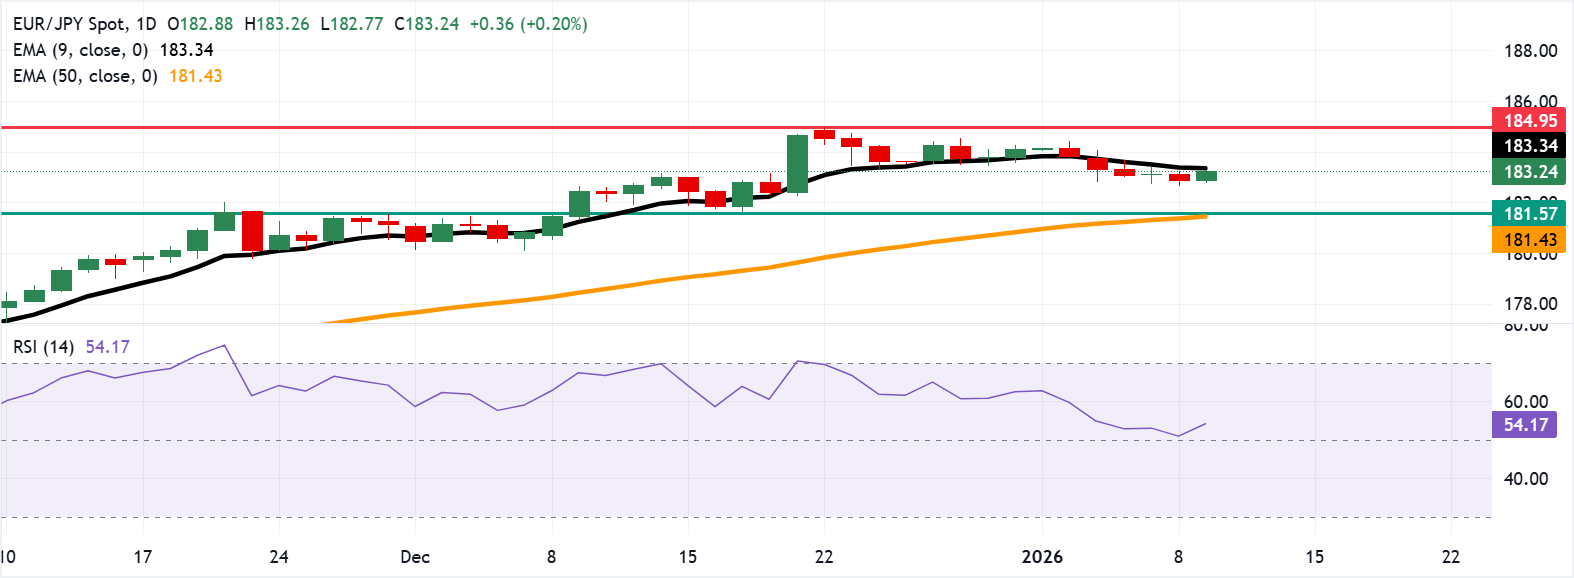
EUR/JPY has recovered its recent losses registered in the previous session, trading around 183.20 during the Asian hours on Friday. The technical analysis of the daily chart suggests that the 14-day Relative Strength Index (RSI) at 54 (neutral) signals steady momentum after easing from overbought.
- EUR/JPY eyes the immediate resistance at the nine-day EMA of 183.34.
- The 14-day Relative Strength Index at 54 signals neutral, steady momentum after easing from overbought levels.
- The primary support lies at the four-week low of 181.57 near the medium-term average.
EUR/JPY has recovered its recent losses registered in the previous session, trading around 183.20 during the Asian hours on Friday. The technical analysis of the daily chart suggests that the 14-day Relative Strength Index (RSI) at 54 (neutral) signals steady momentum after easing from overbought. RSI edging higher toward the mid-50s supports stabilization without signaling a stretch.
The 50-day Exponential Moving Average (EMA) rises to 181.43, underpinning the medium-term uptrend. The nine-day EMA has slipped and now caps intraday advances, pointing to consolidation above the 50-day line. The backdrop favors dip-buying while the rising medium-term average holds.
A close back above the nine-day EMA at 183.34 would improve near-term traction toward overhead barriers around the all-time high of 184.95, which was recorded on December 22, aligned with the psychological level of 185.00.
Failure to reclaim the short-term average would leave the cross vulnerable to a deeper mean-reversion phase. The EUR/JPY cross may navigate the region around the initial support at the four-week low of 181.57, recorded on December 17, followed by the 50-day EMA at 181.43. Holding above the medium-term average preserves the broader bullish bias.
Euro Price Today
The table below shows the percentage change of Euro (EUR) against listed major currencies today. Euro was the strongest against the Japanese Yen.
| USD | EUR | GBP | JPY | CAD | AUD | NZD | CHF | |
|---|---|---|---|---|---|---|---|---|
| USD | -0.05% | 0.02% | 0.16% | 0.10% | 0.07% | 0.14% | 0.00% | |
| EUR | 0.05% | 0.06% | 0.20% | 0.14% | 0.12% | 0.18% | 0.05% | |
| GBP | -0.02% | -0.06% | 0.15% | 0.08% | 0.05% | 0.12% | -0.02% | |
| JPY | -0.16% | -0.20% | -0.15% | -0.05% | -0.09% | -0.03% | -0.16% | |
| CAD | -0.10% | -0.14% | -0.08% | 0.05% | -0.04% | 0.03% | -0.10% | |
| AUD | -0.07% | -0.12% | -0.05% | 0.09% | 0.04% | 0.07% | -0.07% | |
| NZD | -0.14% | -0.18% | -0.12% | 0.03% | -0.03% | -0.07% | -0.13% | |
| CHF | -0.00% | -0.05% | 0.02% | 0.16% | 0.10% | 0.07% | 0.13% |
The heat map shows percentage changes of major currencies against each other. The base currency is picked from the left column, while the quote currency is picked from the top row. For example, if you pick the Euro from the left column and move along the horizontal line to the US Dollar, the percentage change displayed in the box will represent EUR (base)/USD (quote).
(The technical analysis of this story was written with the help of an AI tool.)

FXStreet
超過一百萬用戶依賴 FXStreet 獲取即時市場數據、圖表工具、專家洞見與外匯新聞。其全面的經濟日曆與教育網路研討會協助交易者保持資訊領先、做出審慎決策。FXStreet 擁有約 60 人的團隊,分布於巴塞隆納總部及全球各地。
Read More


