
Trade The World
Hyperliquid Price Forecast: HYPE consolidates below 50-day EMA as bullish bias strengthens
作者 Vishal Dixit
發布日期: 7 Jan 2026 | 修改日期: 7 Jan 2026


POPULAR ARTICLES

Hyperliquid (HYPE) experiences a pullback of over 1% at press time on Wednesday, struggling to extend the breakout rally of a resistance trendline.
- Hyperliquid is down 1% following Tuesday’s 6% rise, struggling to reach the 50-day EMA near $30.00.
- Derivatives data suggests buy-side bias amid rising Open Interest and positive funding rates.
- Technical outlook for HYPE remains optimistic, with bulls aiming to surpass 50-day EMA following a breakout of a resistance trendline.
Hyperliquid (HYPE) experiences a pullback of over 1% at press time on Wednesday, struggling to extend the breakout rally of a resistance trendline. Derivatives data suggests a buy-side dominance among traders, as capital inflows align with positive funding rates and increased interest from large wallet investors, commonly referred to as whales. The technical outlook for HYPE focuses on the overhead 50-day Exponential Moving Average (EMA) near $30.00 as a crucial resistance.
Derivatives data show renewed retail and whale demand
Hyperliquid regains retail interest as the broader cryptocurrency recovery fuels user demand over the perpetuals-focused Decentralized Exchange (DEX). CoinGlass data shows that the HYPE futures Open Interest (OI) has surged over 7.06% in the last 24 hours, reaching $1.50 billion. This indicates an inflow of fresh capital building new positions, including longs and shorts.
However, the positive funding rates of 0.0045% indicate a bullish incline in the capital inflow as traders are paying premiums to hold long positions.
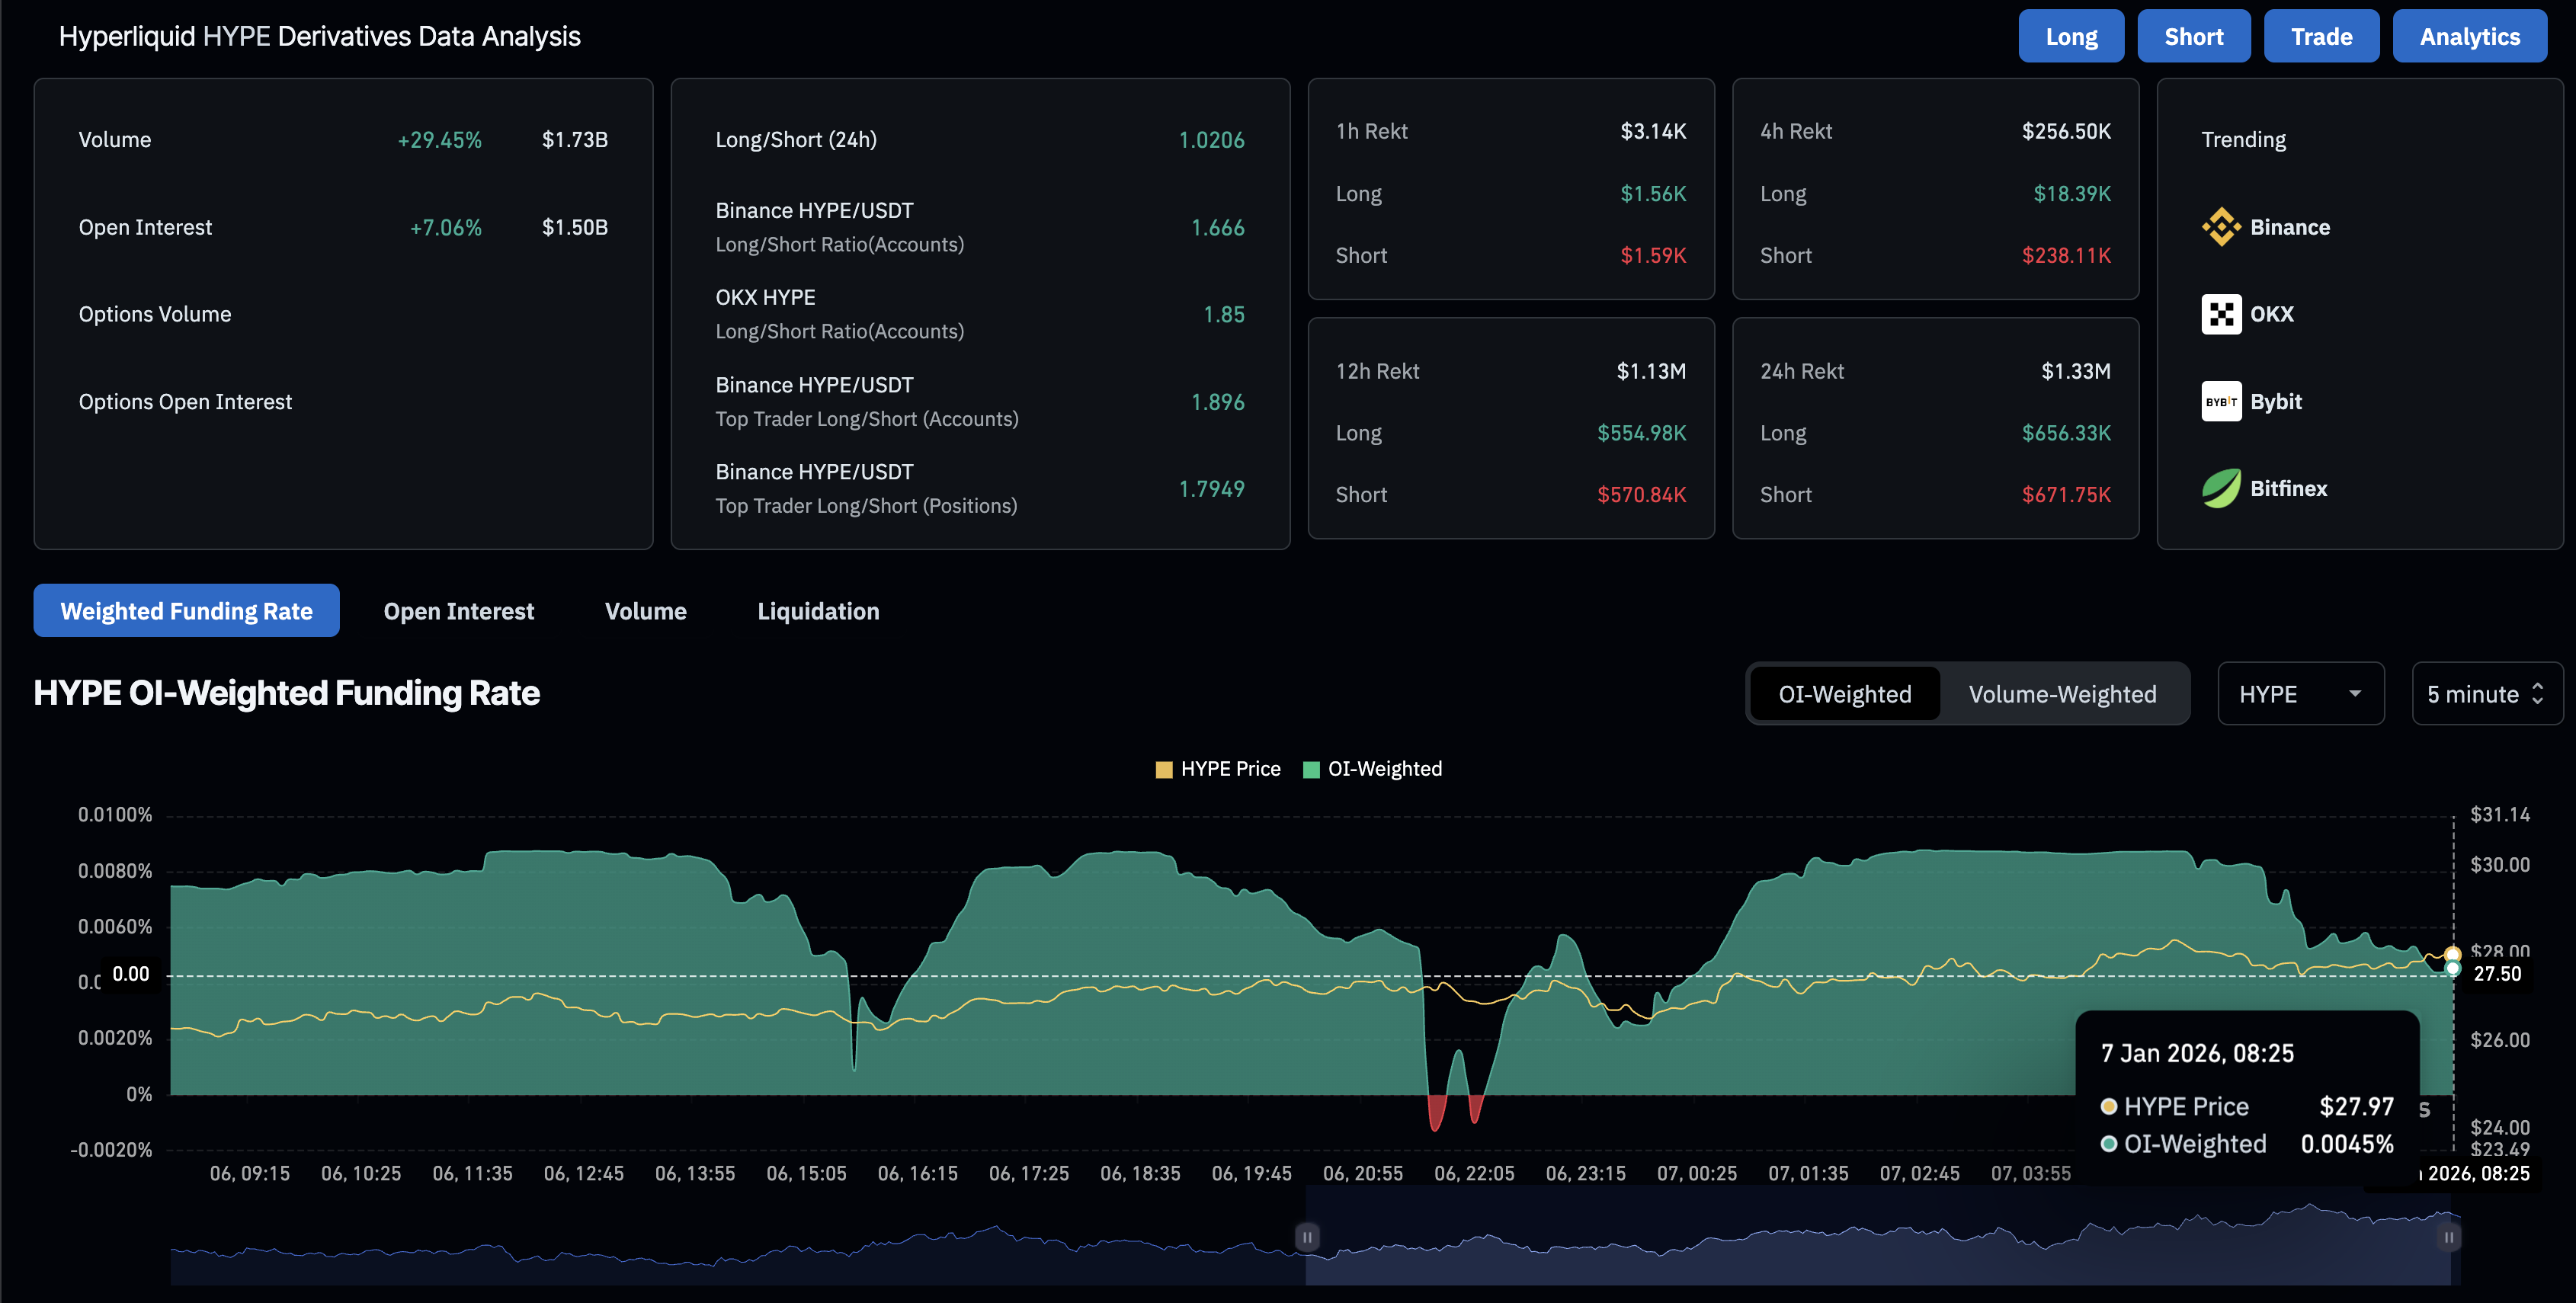
Additionally, CryptoQuant’s data suggests a surge in whale orders based on the increasing average order size in HYPE futures. Typically, an interest spike from whales tends to boost the refreshed trend, which in this case, suggests further upside potential.
Technical outlook: Could Hyperliquid surpass $30?
Hyperliquid broke above the local resistance trendline connecting the November 18 and December 4 highs, rising nearly 6% on Sunday. Despite the intraday pullback, the short-term recovery in HYPE aims for the 50-day EMA at $29.29, roughly aligning with the Supertrend indicator line at $29.49.
If the DEX token clears $30.00 round figure, it could trigger a buy signal from Supertrend indicator and an upward trend targeting the 200-day EMA at $34.82.
The technical indicators on the daily chart suggest that HYPE’s recovery is gaining traction. The Relative Strength Index (RSI) at 53 hovers above the halfway line after crossing above it last week, suggesting that renewed demand persists.
At the same time, the Moving Average Convergence Divergence (MACD) approaches the zero line, indicating a steady rise in bullish momentum.
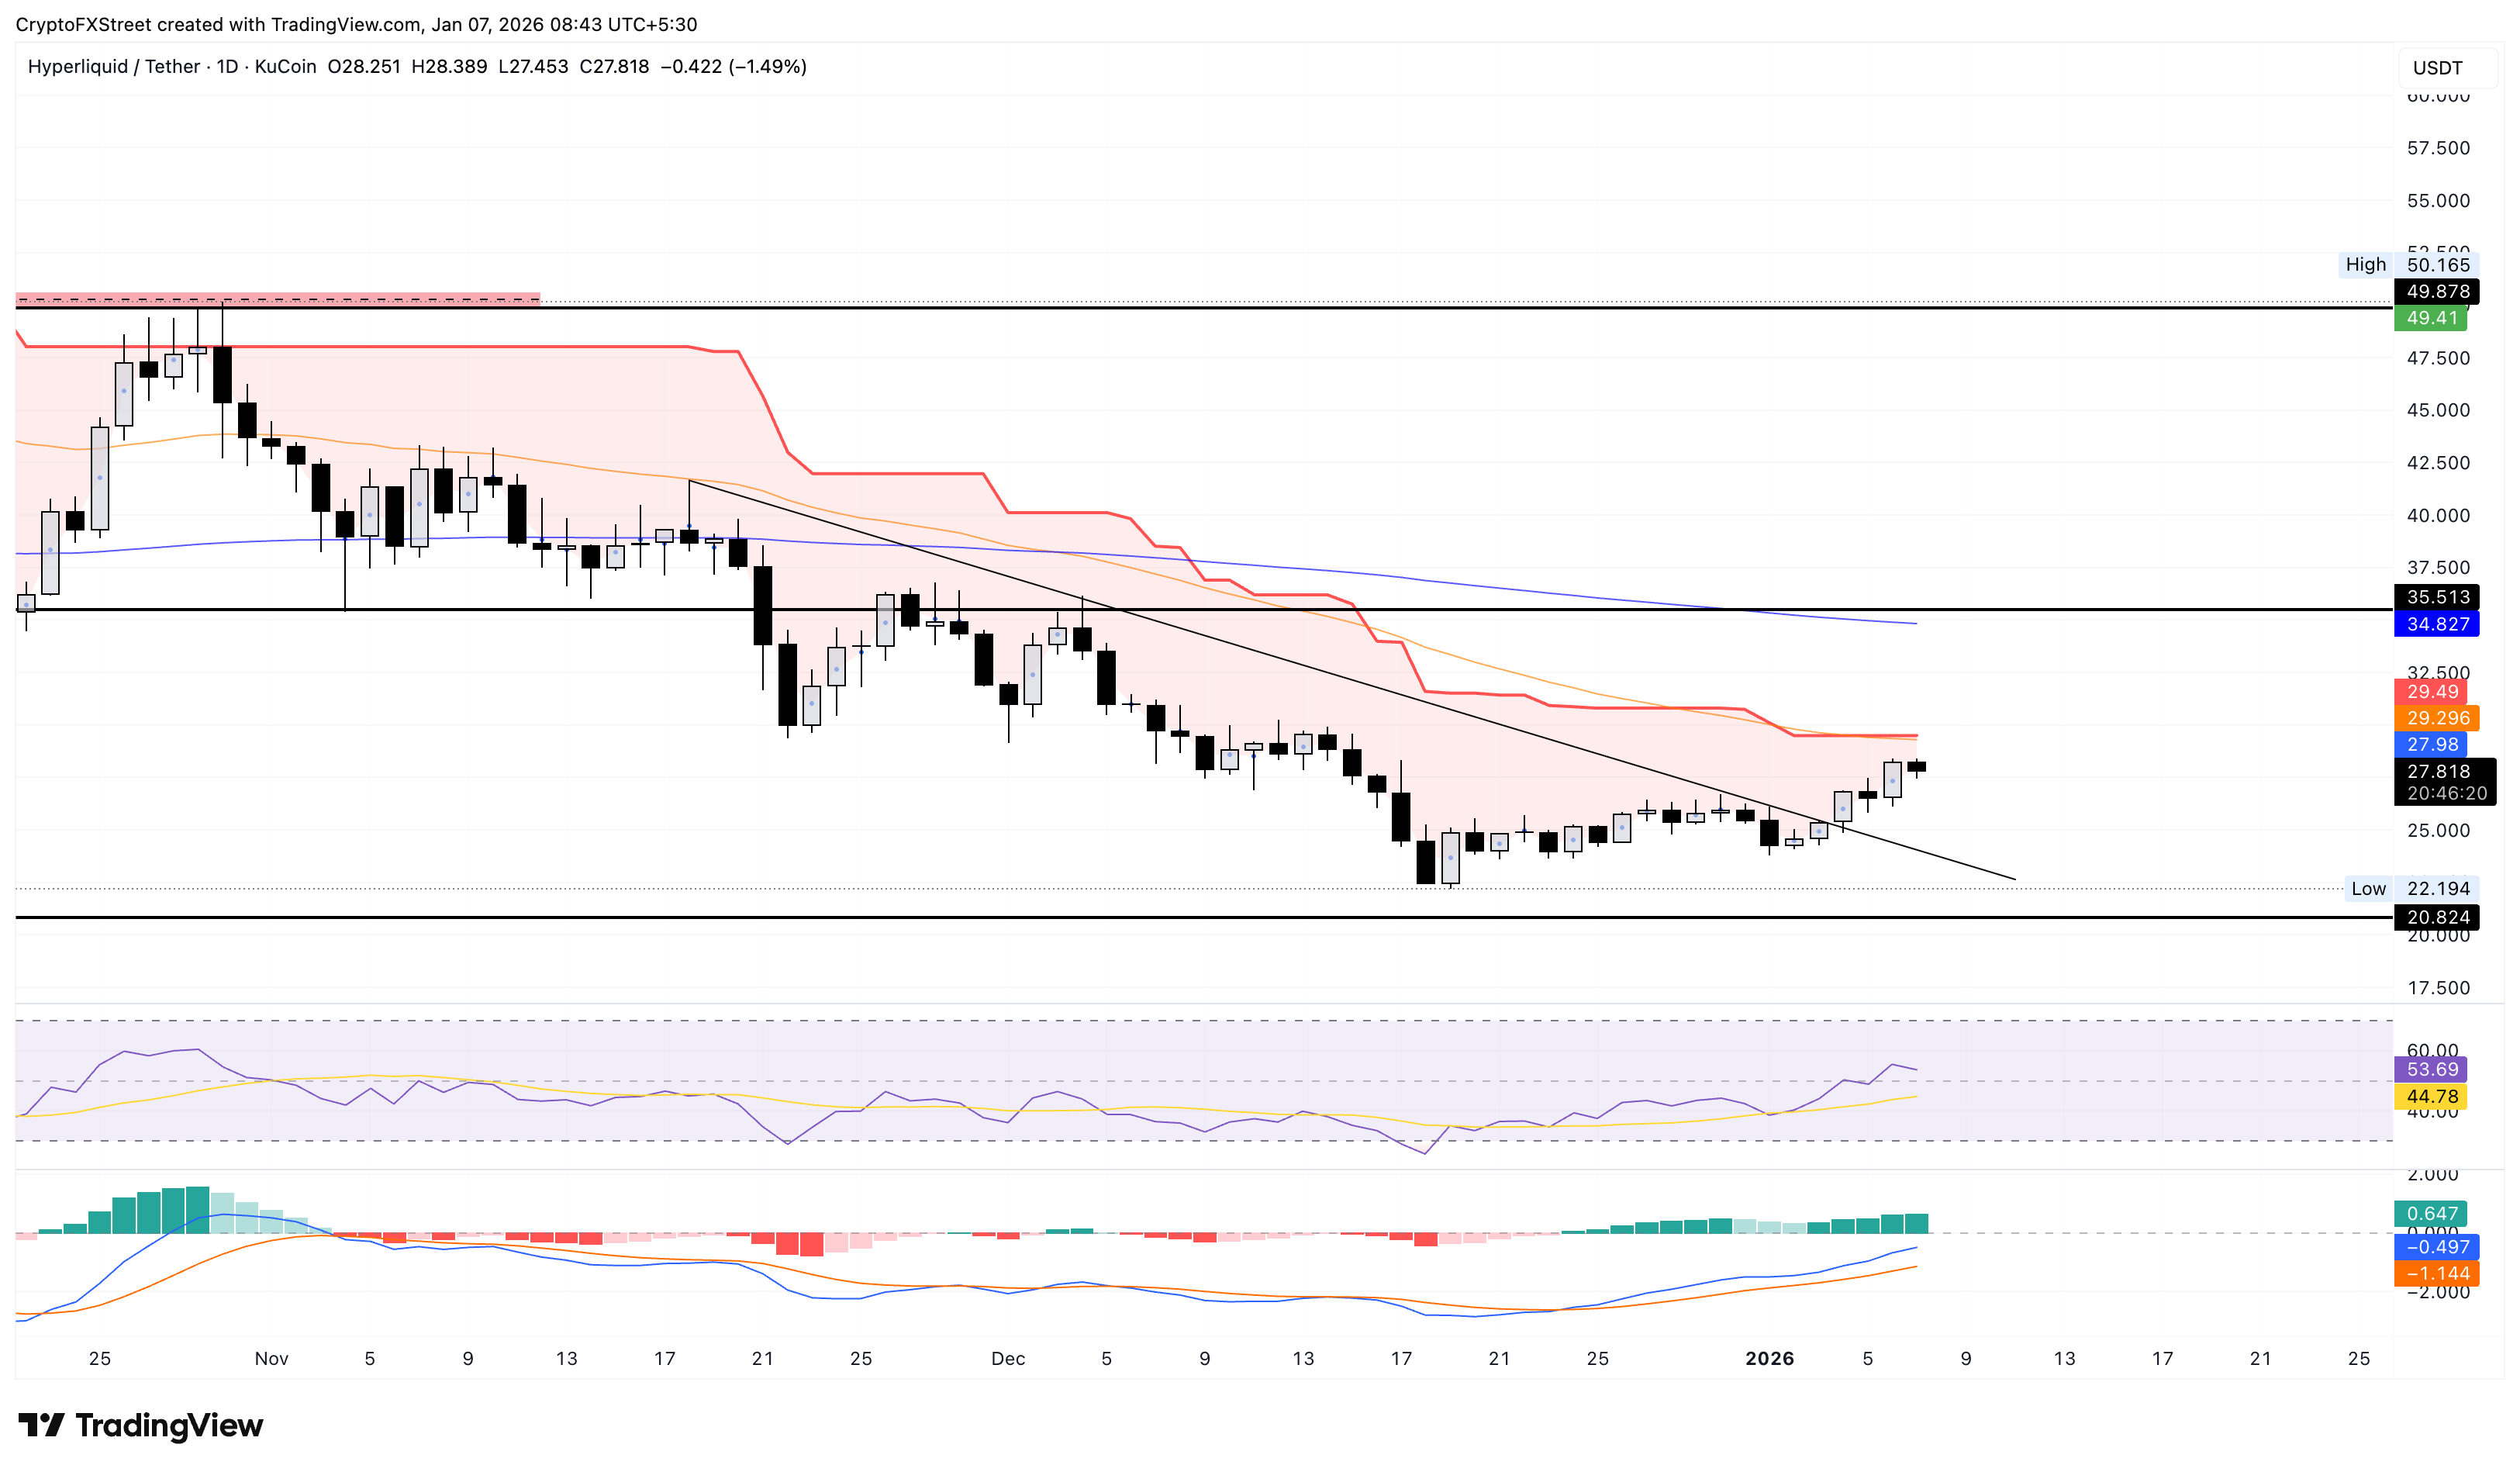
If HYPE reverses to the downside, it could retest the broken trendline near $23.50.

FXStreet
超過一百萬用戶依賴 FXStreet 獲取即時市場數據、圖表工具、專家洞見與外匯新聞。其全面的經濟日曆與教育網路研討會協助交易者保持資訊領先、做出審慎決策。FXStreet 擁有約 60 人的團隊,分布於巴塞隆納總部及全球各地。
Read More


