
Trade The World
Memecoins Price Prediction: Dogecoin, Shiba Inu test key resistance levels ahead of FOMC meeting
作者 Michael Ebiekutan
發布日期: 9 Dec 2025 | 修改日期: 9 Dec 2025


POPULAR ARTICLES
Memecoins Dogecoin (DOGE) and Shiba Inu (SHIB) are testing key resistance levels ahead of the Federal Open Market Committee (FOMC) interest rate decision on Wednesday. With market participants expecting a 25-basis-point rate cut, both memecoins could face pressure near key levels.
- Dogecoin could test $0.180 if it flips a descending trendline resistance and the 20-day EMA.
- SHIB eyes a rise to $0.0000097, but must clear $0.0000087 and the 50-day EMA.
- A rate cut in the upcoming FOMC meeting could put DOGE and SHIB under pressure.
Memecoins Dogecoin (DOGE) and Shiba Inu (SHIB) are testing key resistance levels ahead of the Federal Open Market Committee (FOMC) interest rate decision on Wednesday. With market participants expecting a 25-basis-point rate cut, both memecoins could face pressure near key levels.
DOGE could flip descending trendline resistance
Dogecoin is looking to rise above the $0.142 level, but it faces a key descending trendline resistance extending from October 27. The resistance is strengthened by the 20-day Exponential Moving Average (EMA), which DOGE has failed to sustain a rise above since the October 10 crash.
A firm move above the descending trendline could see DOGE rise past the 50-day EMA to test the $0.180 resistance.
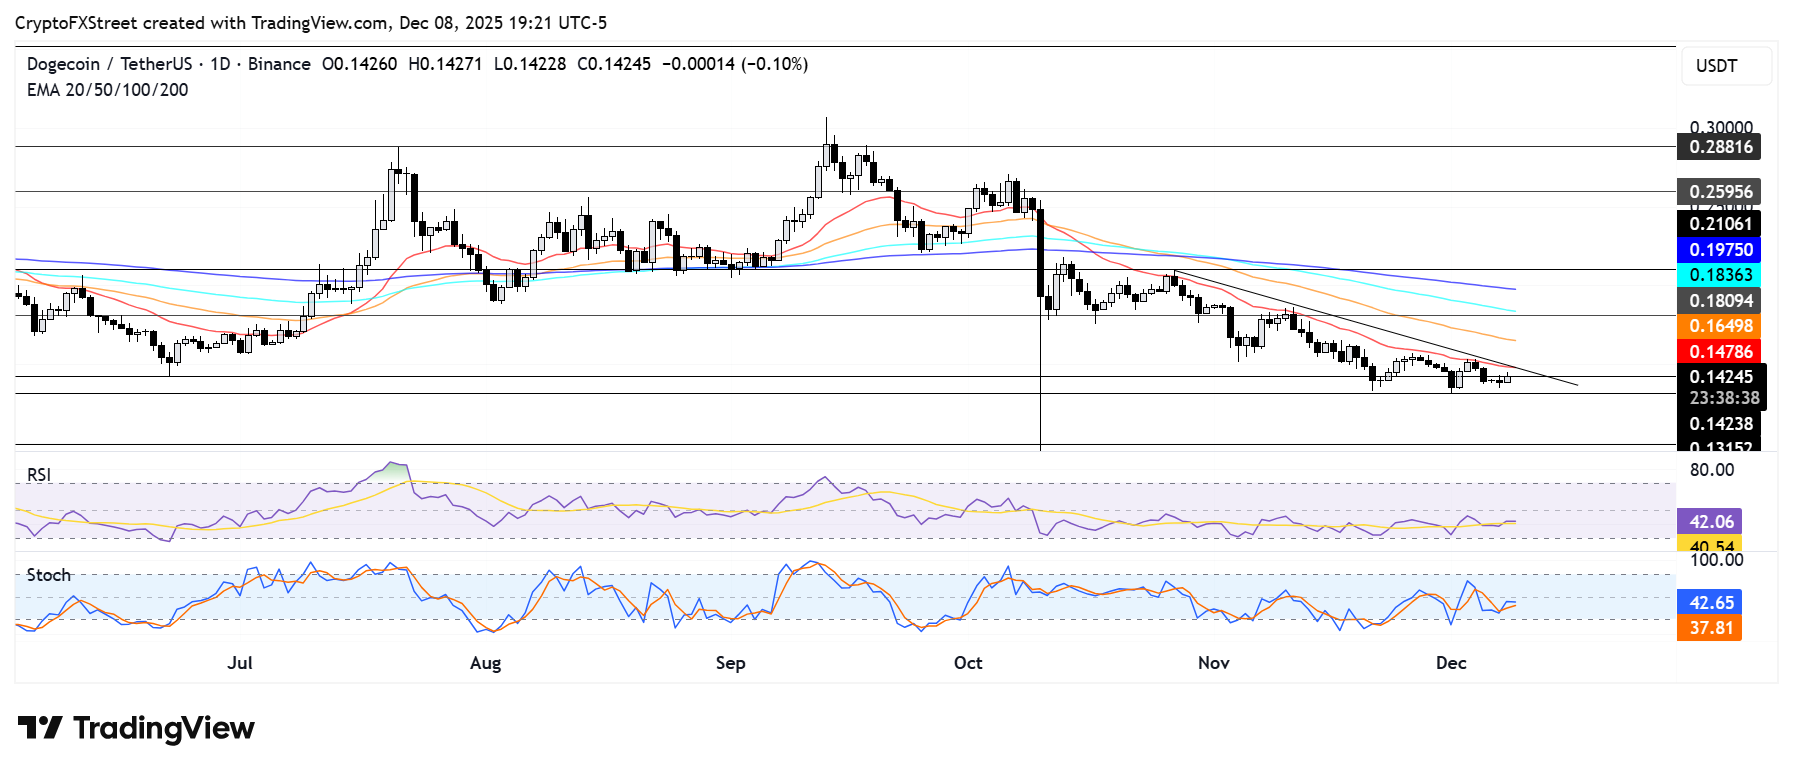
On the downside, DOGE could find support near $0.131. The top memecoin risks a further decline to the $0.100 psychologically important level if it breaks below $0.131.
The Relative Strength Index (RSI) and Stochastic Oscillator (Stoch) are approaching their neutral level. A firm cross above will flip the momentum toward bullish dominance.
SHIB eyes $0.0000097 but faces EMAs’ test
Shiba Inu is testing the $0.0000087 resistance level. The level coincides with the 20-day Exponential Moving Average (EMA), which has proven a critical resistance over the past two months.
A move above $0.0000087 and the 20-day EMA could see SHIB rise to test the $0.0000097 resistance. However, it has to clear the 50-day EMA on the way up. Further up, SHIB faces resistance at the 100-day and 200-day EMAs before it can stage a move to $0.0000123.
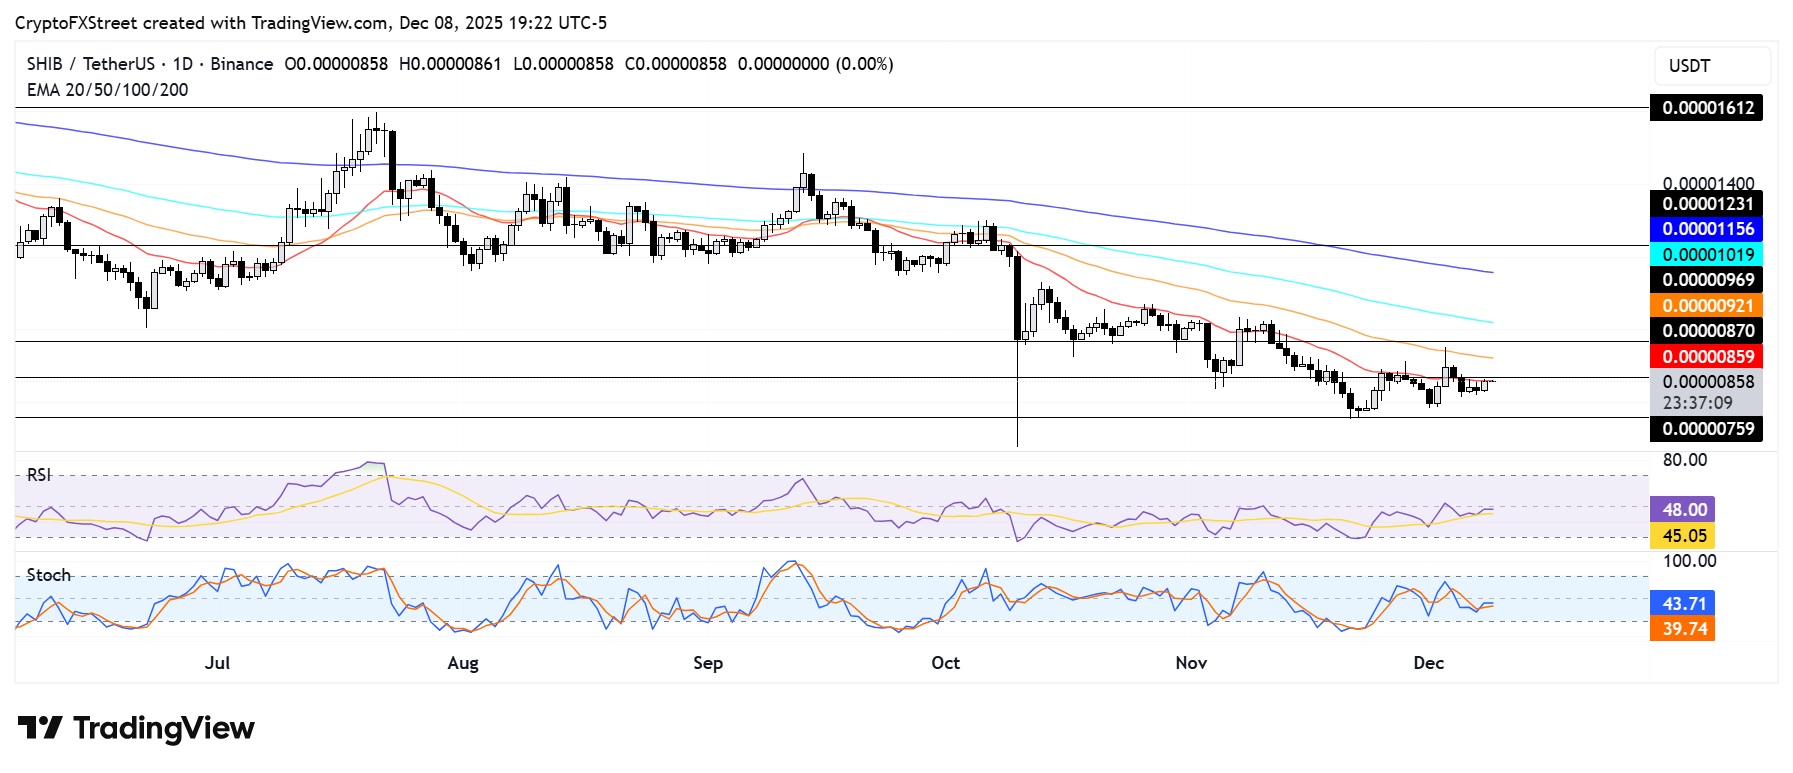
On the downside, SHIB could decline to $0.0000076 if it sees a rejection at $0.0000087.
The Relative Strength Index (RSI) and Stochastic Oscillator (Stoch) are testing their neutral levels. A cross above will accelerate a dominant bullish momentum.

FXStreet
超過一百萬用戶依賴 FXStreet 獲取即時市場數據、圖表工具、專家洞見與外匯新聞。其全面的經濟日曆與教育網路研討會協助交易者保持資訊領先、做出審慎決策。FXStreet 擁有約 60 人的團隊,分布於巴塞隆納總部及全球各地。
Read More


