
Pi Network Price Forecast: PI steadies as market sentiment lifts recovery prospects
作者 Vishal Dixit
發布日期: 14 Jan 2026 | 修改日期: 14 Jan 2026


熱門文章
Pi Network (PI) trades around $0.2100 at press time on Wednesday, steadying after a 1% bounce back from a crucial support trendline on the previous day. The rebound aligns with improving sentiment across the broader cryptocurrency market as Bitcoin (BTC) resurfaces above $95,000.
- Pi Network holds above $0.2000 on Wednesday after bouncing over 1% from a local support trendline the previous day.
- A recovery in broader market sentiment signals renewed risk appetite among investors.
- Technically, Pi Network remains vulnerable to supply pressure due to a lack of conviction in momentum indicators.
Pi Network (PI) trades around $0.2100 at press time on Wednesday, steadying after a 1% bounce back from a crucial support trendline on the previous day. The rebound aligns with improving sentiment across the broader cryptocurrency market as Bitcoin (BTC) resurfaces above $95,000. Still, the technical outlook for PI remains mixed as recovery approaches a key resistance but lacks strength.
Pi Network flashes mixed potential amid elevating market sentiment
Pi Network jumped 1.55% on Tuesday, recovering from the 1% decline at the start of this week. This recovery aligned with the broader market recovery, driven by a softer-than-expected US core Consumer Price Index (CPI) and a draft bill on a new crypto market structure by the US Senate.
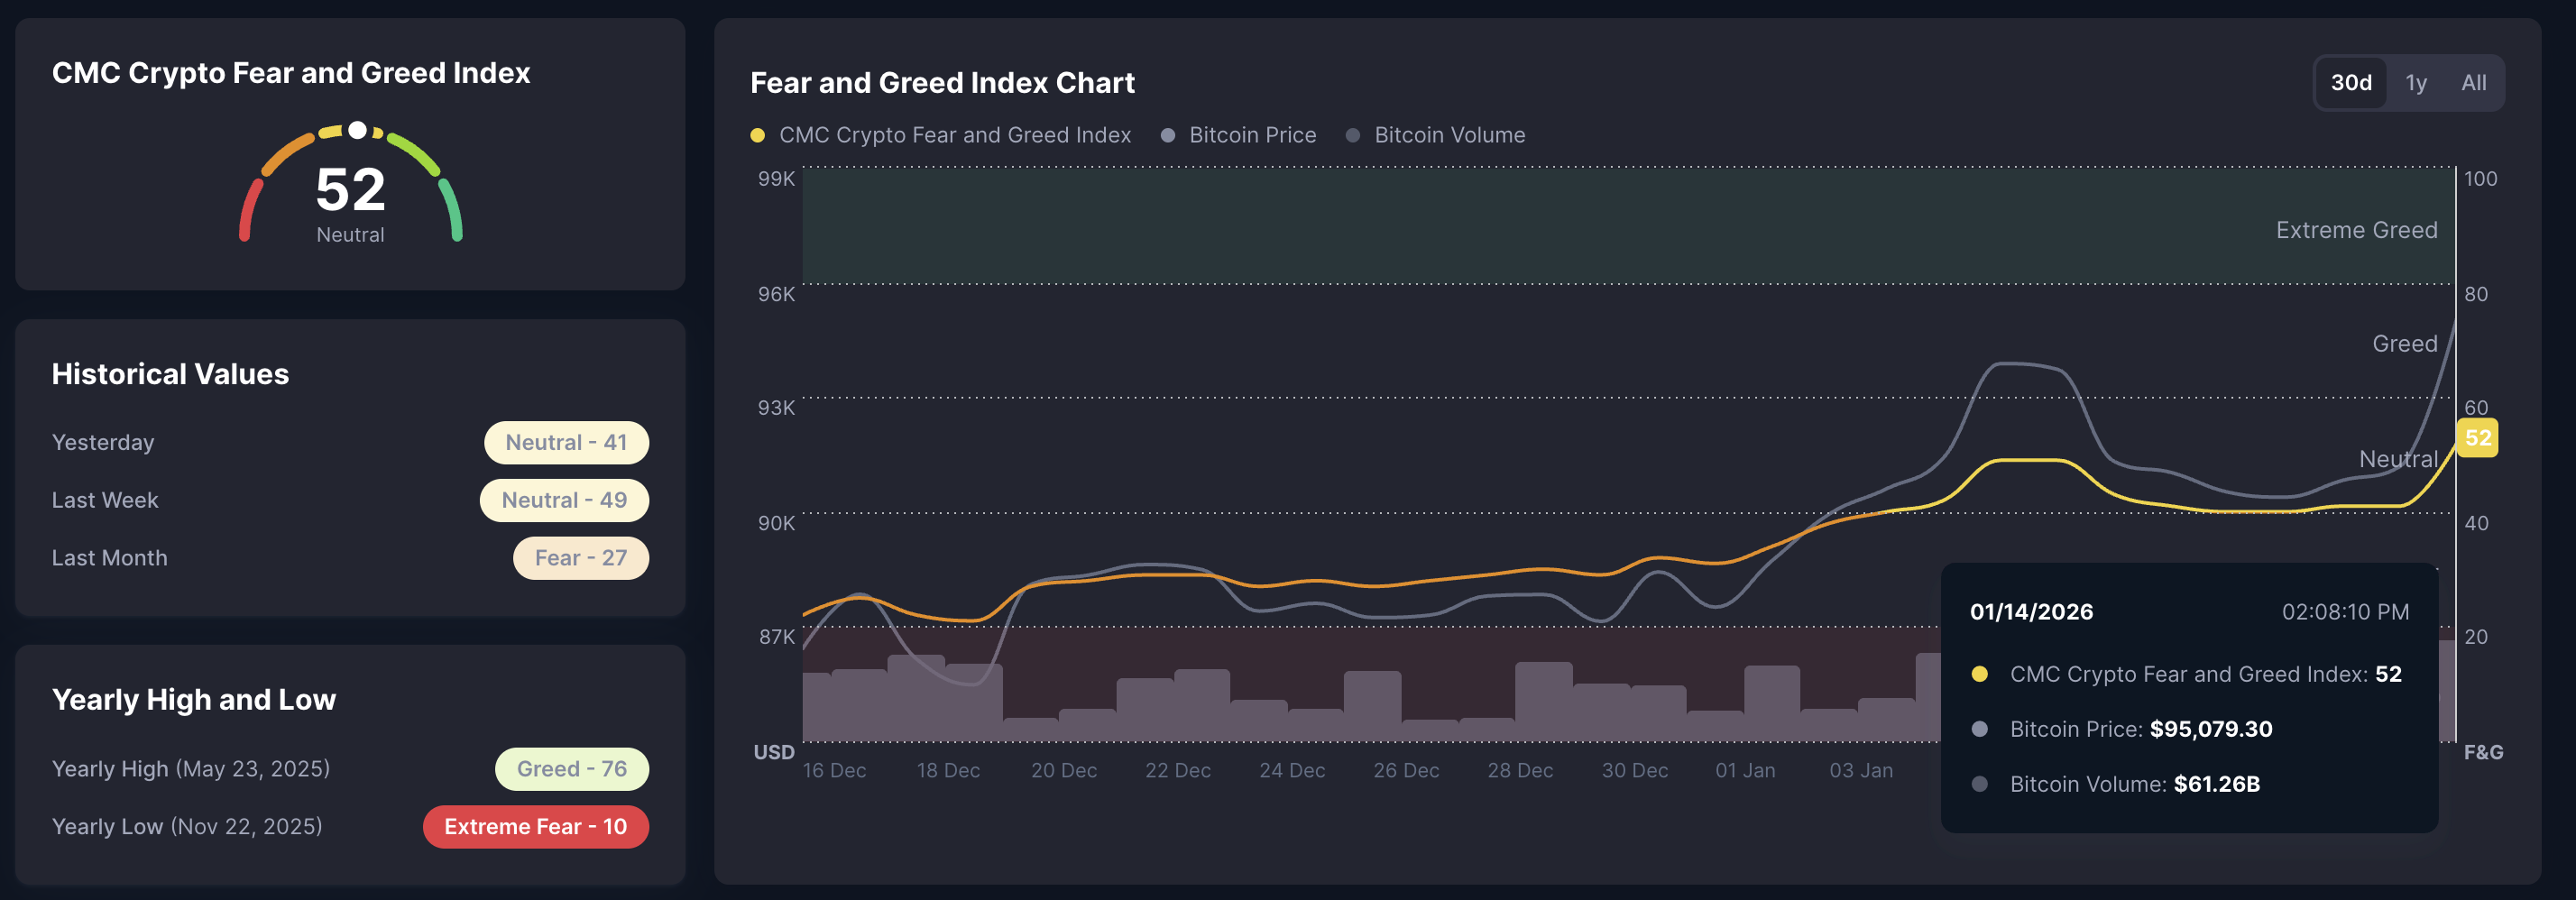
This lift in bullish sentiment across the crypto market is evident in the Fear and Greed Index, which is at 52, up from 31 on January 1, suggesting a shift from fear-dominant to neutral sentiment. Typically, values above 60 indicate greed, between 40 and 60 reflect neutral sentiment, and below 40 point to fear.
Unlike the muted price movement since the announcement of Pi Library on January 9, which offered Pi Payments integrations in Pi applications, a sentiment-driven recovery could provide a short-term, sustained recovery.
Pi shows a lack of conviction in momentum indicators
At the time of writing, PI stabilizes near $0.2100 after a rebound from a local support trendline connecting the December 17 and 30 lows.
The Relative Strength Index (RSI) is at 50 on the daily logarithmic chart, flattening near the midline, suggesting a lack of a clear momentum. At the same time, the Moving Average Convergence Divergence (MACD) indicator hovers above the signal line, avoiding a bearish crossover, but the declining histogram bars suggest weakness in bullish momentum.
If PI clears the overhead resistance levels, including the 50-day Exponential Moving Average (EMA) at $0.2149 and the December 19 high at $0.2177, it could extend the rally to the September 23 low at $0.2613.
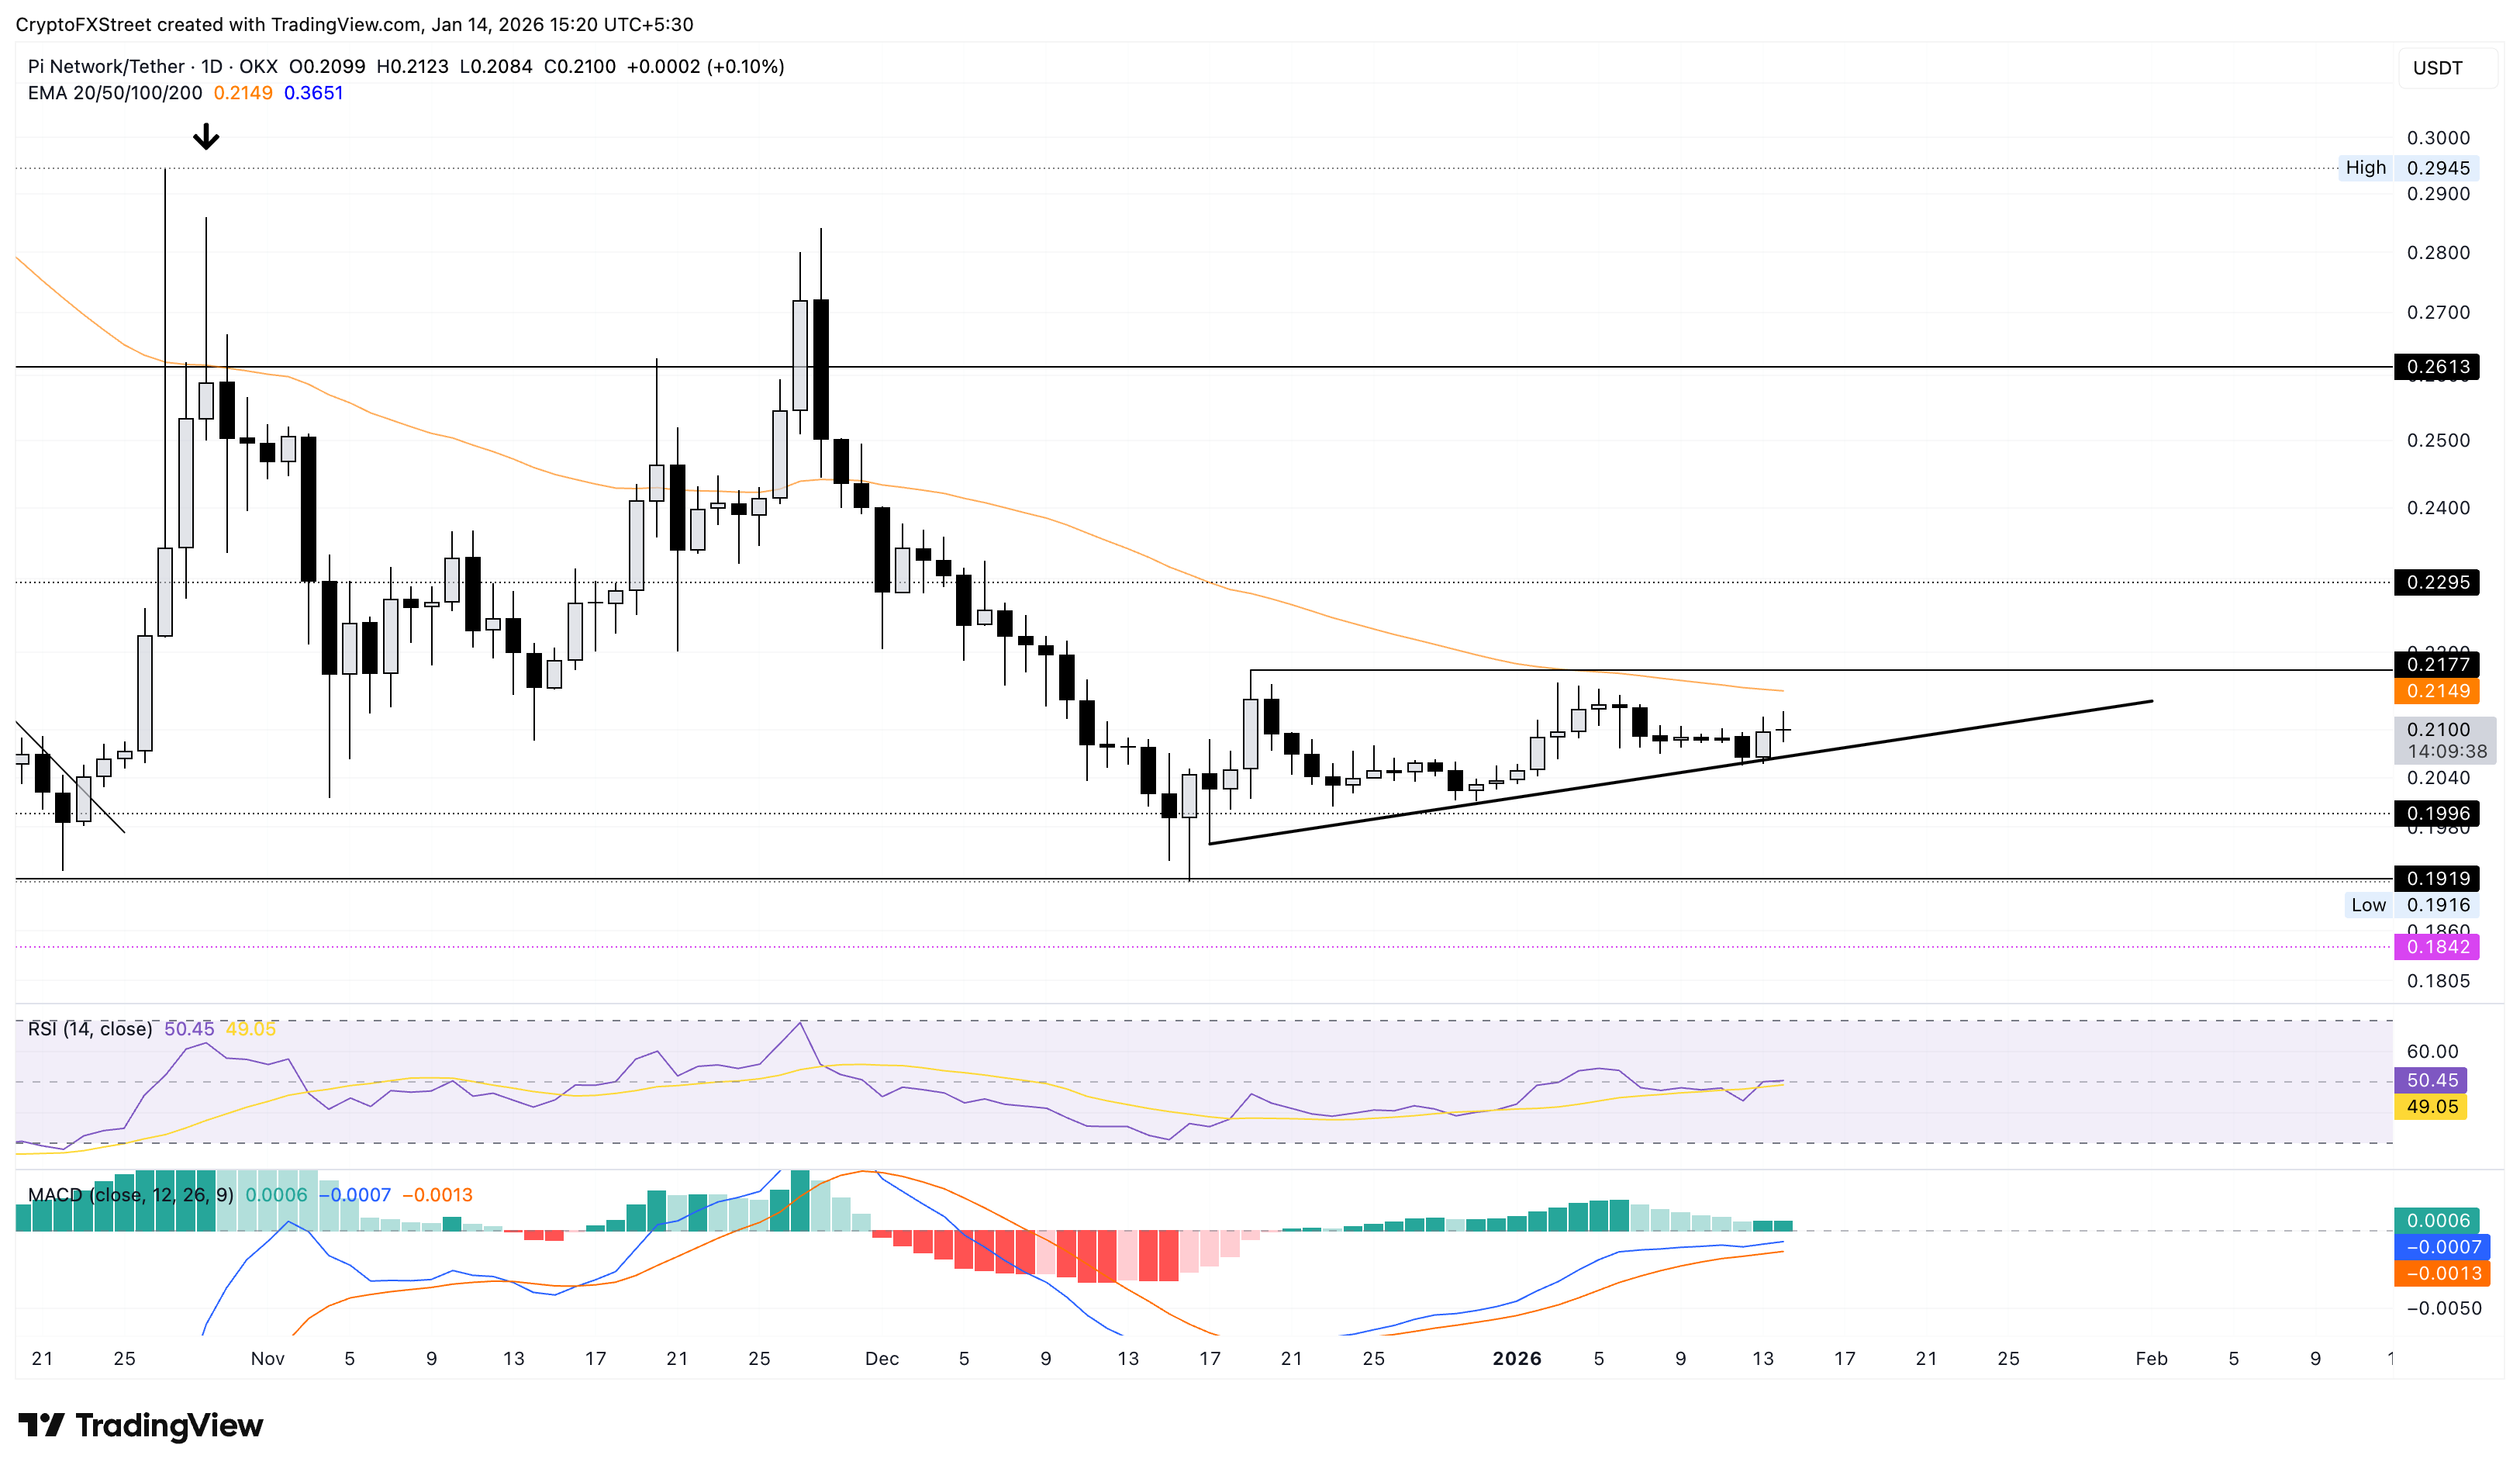
On the flip side, a reversal below $0.2000 could test the October 11 low at $0.1919.
Crypto ETF FAQs
An Exchange-Traded Fund (ETF) is an investment vehicle or an index that tracks the price of an underlying asset. ETFs can not only track a single asset, but a group of assets and sectors. For example, a Bitcoin ETF tracks Bitcoin’s price. ETF is a tool used by investors to gain exposure to a certain asset.
Yes. The first Bitcoin futures ETF in the US was approved by the US Securities & Exchange Commission in October 2021. A total of seven Bitcoin futures ETFs have been approved, with more than 20 still waiting for the regulator’s permission. The SEC says that the cryptocurrency industry is new and subject to manipulation, which is why it has been delaying crypto-related futures ETFs for the last few years.
Yes. The SEC approved in January 2024 the listing and trading of several Bitcoin spot Exchange-Traded Funds, opening the door to institutional capital and mainstream investors to trade the main crypto currency. The decision was hailed by the industry as a game changer.
The main advantage of crypto ETFs is the possibility of gaining exposure to a cryptocurrency without ownership, reducing the risk and cost of holding the asset. Other pros are a lower learning curve and higher security for investors since ETFs take charge of securing the underlying asset holdings. As for the main drawbacks, the main one is that as an investor you can’t have direct ownership of the asset, or, as they say in crypto, “not your keys, not your coins.” Other disadvantages are higher costs associated with holding crypto since ETFs charge fees for active management. Finally, even though investing in ETFs reduces the risk of holding an asset, price swings in the underlying cryptocurrency are likely to be reflected in the investment vehicle too.

超過一百萬用戶依賴 FXStreet 獲取即時市場數據、圖表工具、專家洞見與外匯新聞。其全面的經濟日曆與教育網路研討會協助交易者保持資訊領先、做出審慎決策。FXStreet 擁有約 60 人的團隊,分布於巴塞隆納總部及全球各地。
閱讀更多


