
Trade The World
Pi Network Price Forecast: Downside risk escalates for PI ahead of major token unlock, on-ramp delay
作者 Vishal Dixit
發布日期: 31 Jul 2025 | 修改日期: 31 Jul 2025


POPULAR ARTICLES

Pi Network (PI) loses steam on Thursday, trading below $0.4200 at the time of writing, falling from a daily high of $0.4364 earlier in the day.
- Pi Network faces increasing overhead pressure as it struggles to avoid a drop below $0.40, close to its all-time low.
- Around 160 million PI tokens will be unlocked in August, increasing the circulating supply by 2.1%.
- The price fails to find support as the Pi Network on-ramp service, allowing users to buy PI directly, is delayed.
Pi Network (PI) loses steam on Thursday, trading below $0.4200 at the time of writing, falling from a daily high of $0.4364 earlier in the day. The bearish grip on PI, which has been on a clear downtrend since mid-May, tightens ahead of the 160 million token unlock in August and the delay in PI integration by Onramp Money, tilting the technical outlook bearish.
Monthly token unlock in August risks increased selling pressure
PiScan data indicates that 161.6 million PI tokens will be unlocked in August, increasing the circulating supply by 2.09%. This monthly unlock is the largest until December, when 170.5 million PI tokens will be released into circulation.
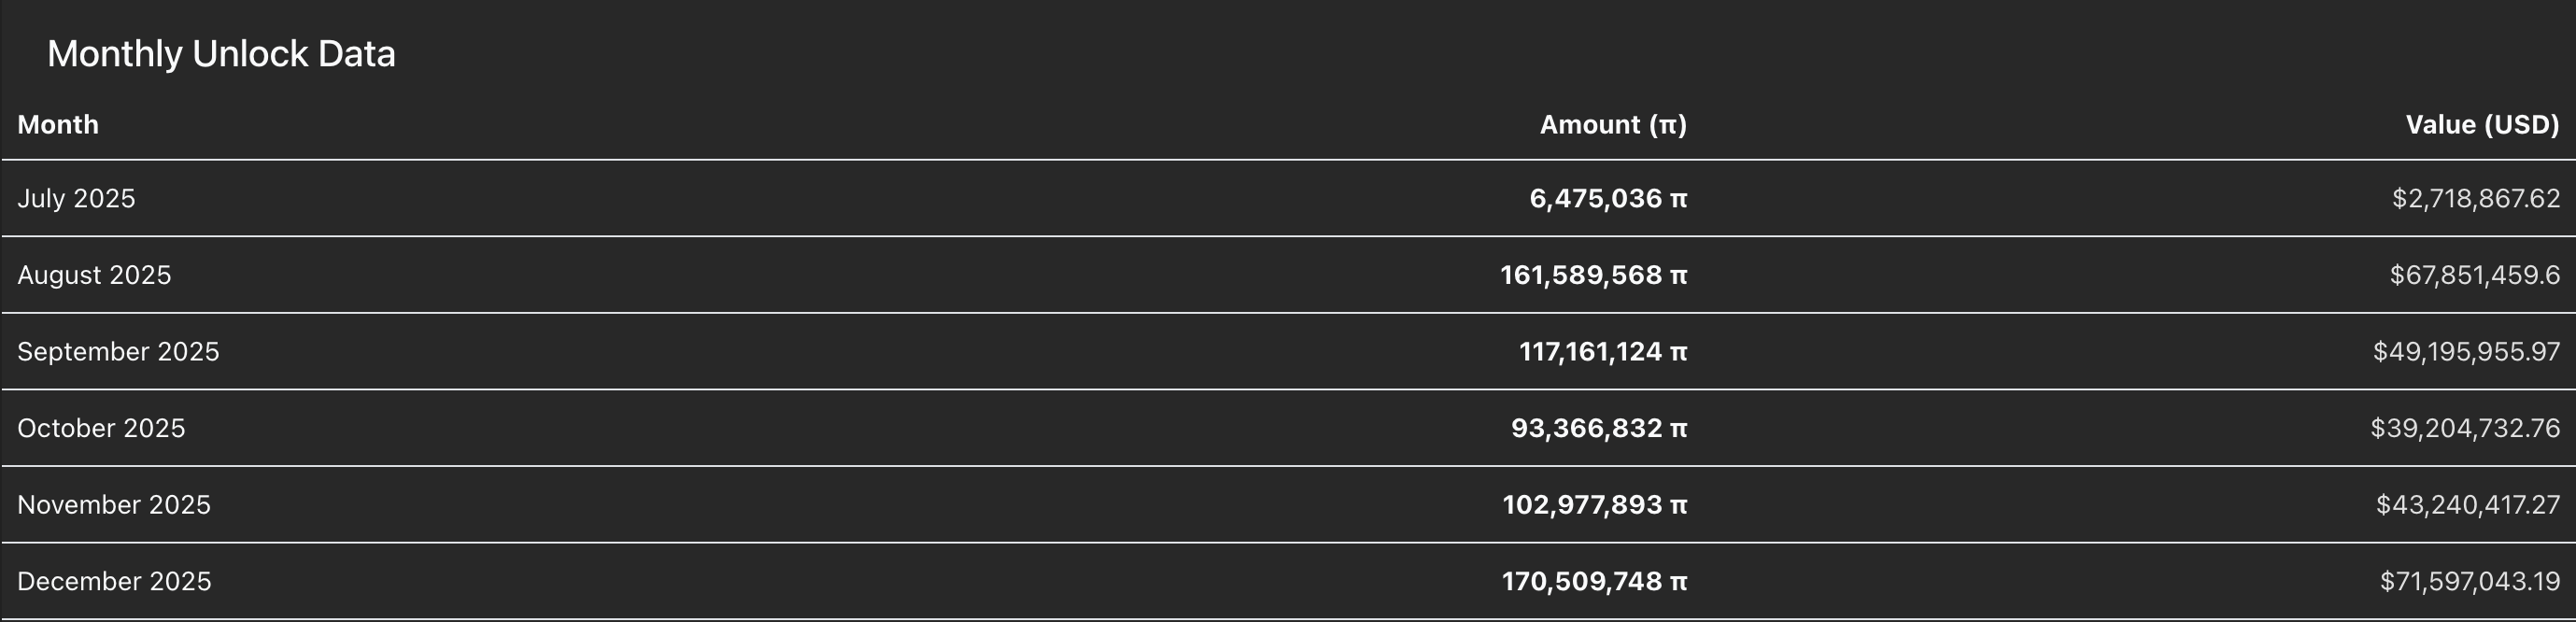
PI token unlock data. Source: PiScan
Sidelined investors expecting a reversal in PI should temper their bullish expectations, as unlock events tend to increase selling pressure, allowing investors to book profits.
Onramp Money delays official integration of PI
Onramp Money announced on Tuesday that the PI integration is still in progress. The on-ramping company will allow users to buy PI tokens directly in exchange for fiat currencies, with the official launch expected in the second or third week of August.
Until the official launch announcement on social media handles, the company urges users to avoid making purchases via Onramp Money. As of Thursday, the Pi Network app displays on-ramp alternatives by Banxa and TransFi, although Pi Network has made no official announcement.
PI risks further losses below its $0.4000 crucial support level
Pi Network holds the bearish trend with over 17% decline so far in July. At the time of writing, PI inches closer to its all-time low of $0.4000 last tested on June 13.
The Relative Strength Index (RSI) at 35 on the daily chart holds a declining trend towards the oversold boundary, suggesting a steady decline in buying pressure and signaling prices still have some room to fall. Investors could increase the bearish exposure as the Moving Average Convergence Divergence (MACD) line draws closer to crossing below its signal line. This potential crossover, along with the resurgence of red histograms, would flash a sell signal.
A decisive push below the $0.4000 level could extend the decline to the S1 pivot level at $0.3837, followed by the S2 level at $0.2585.
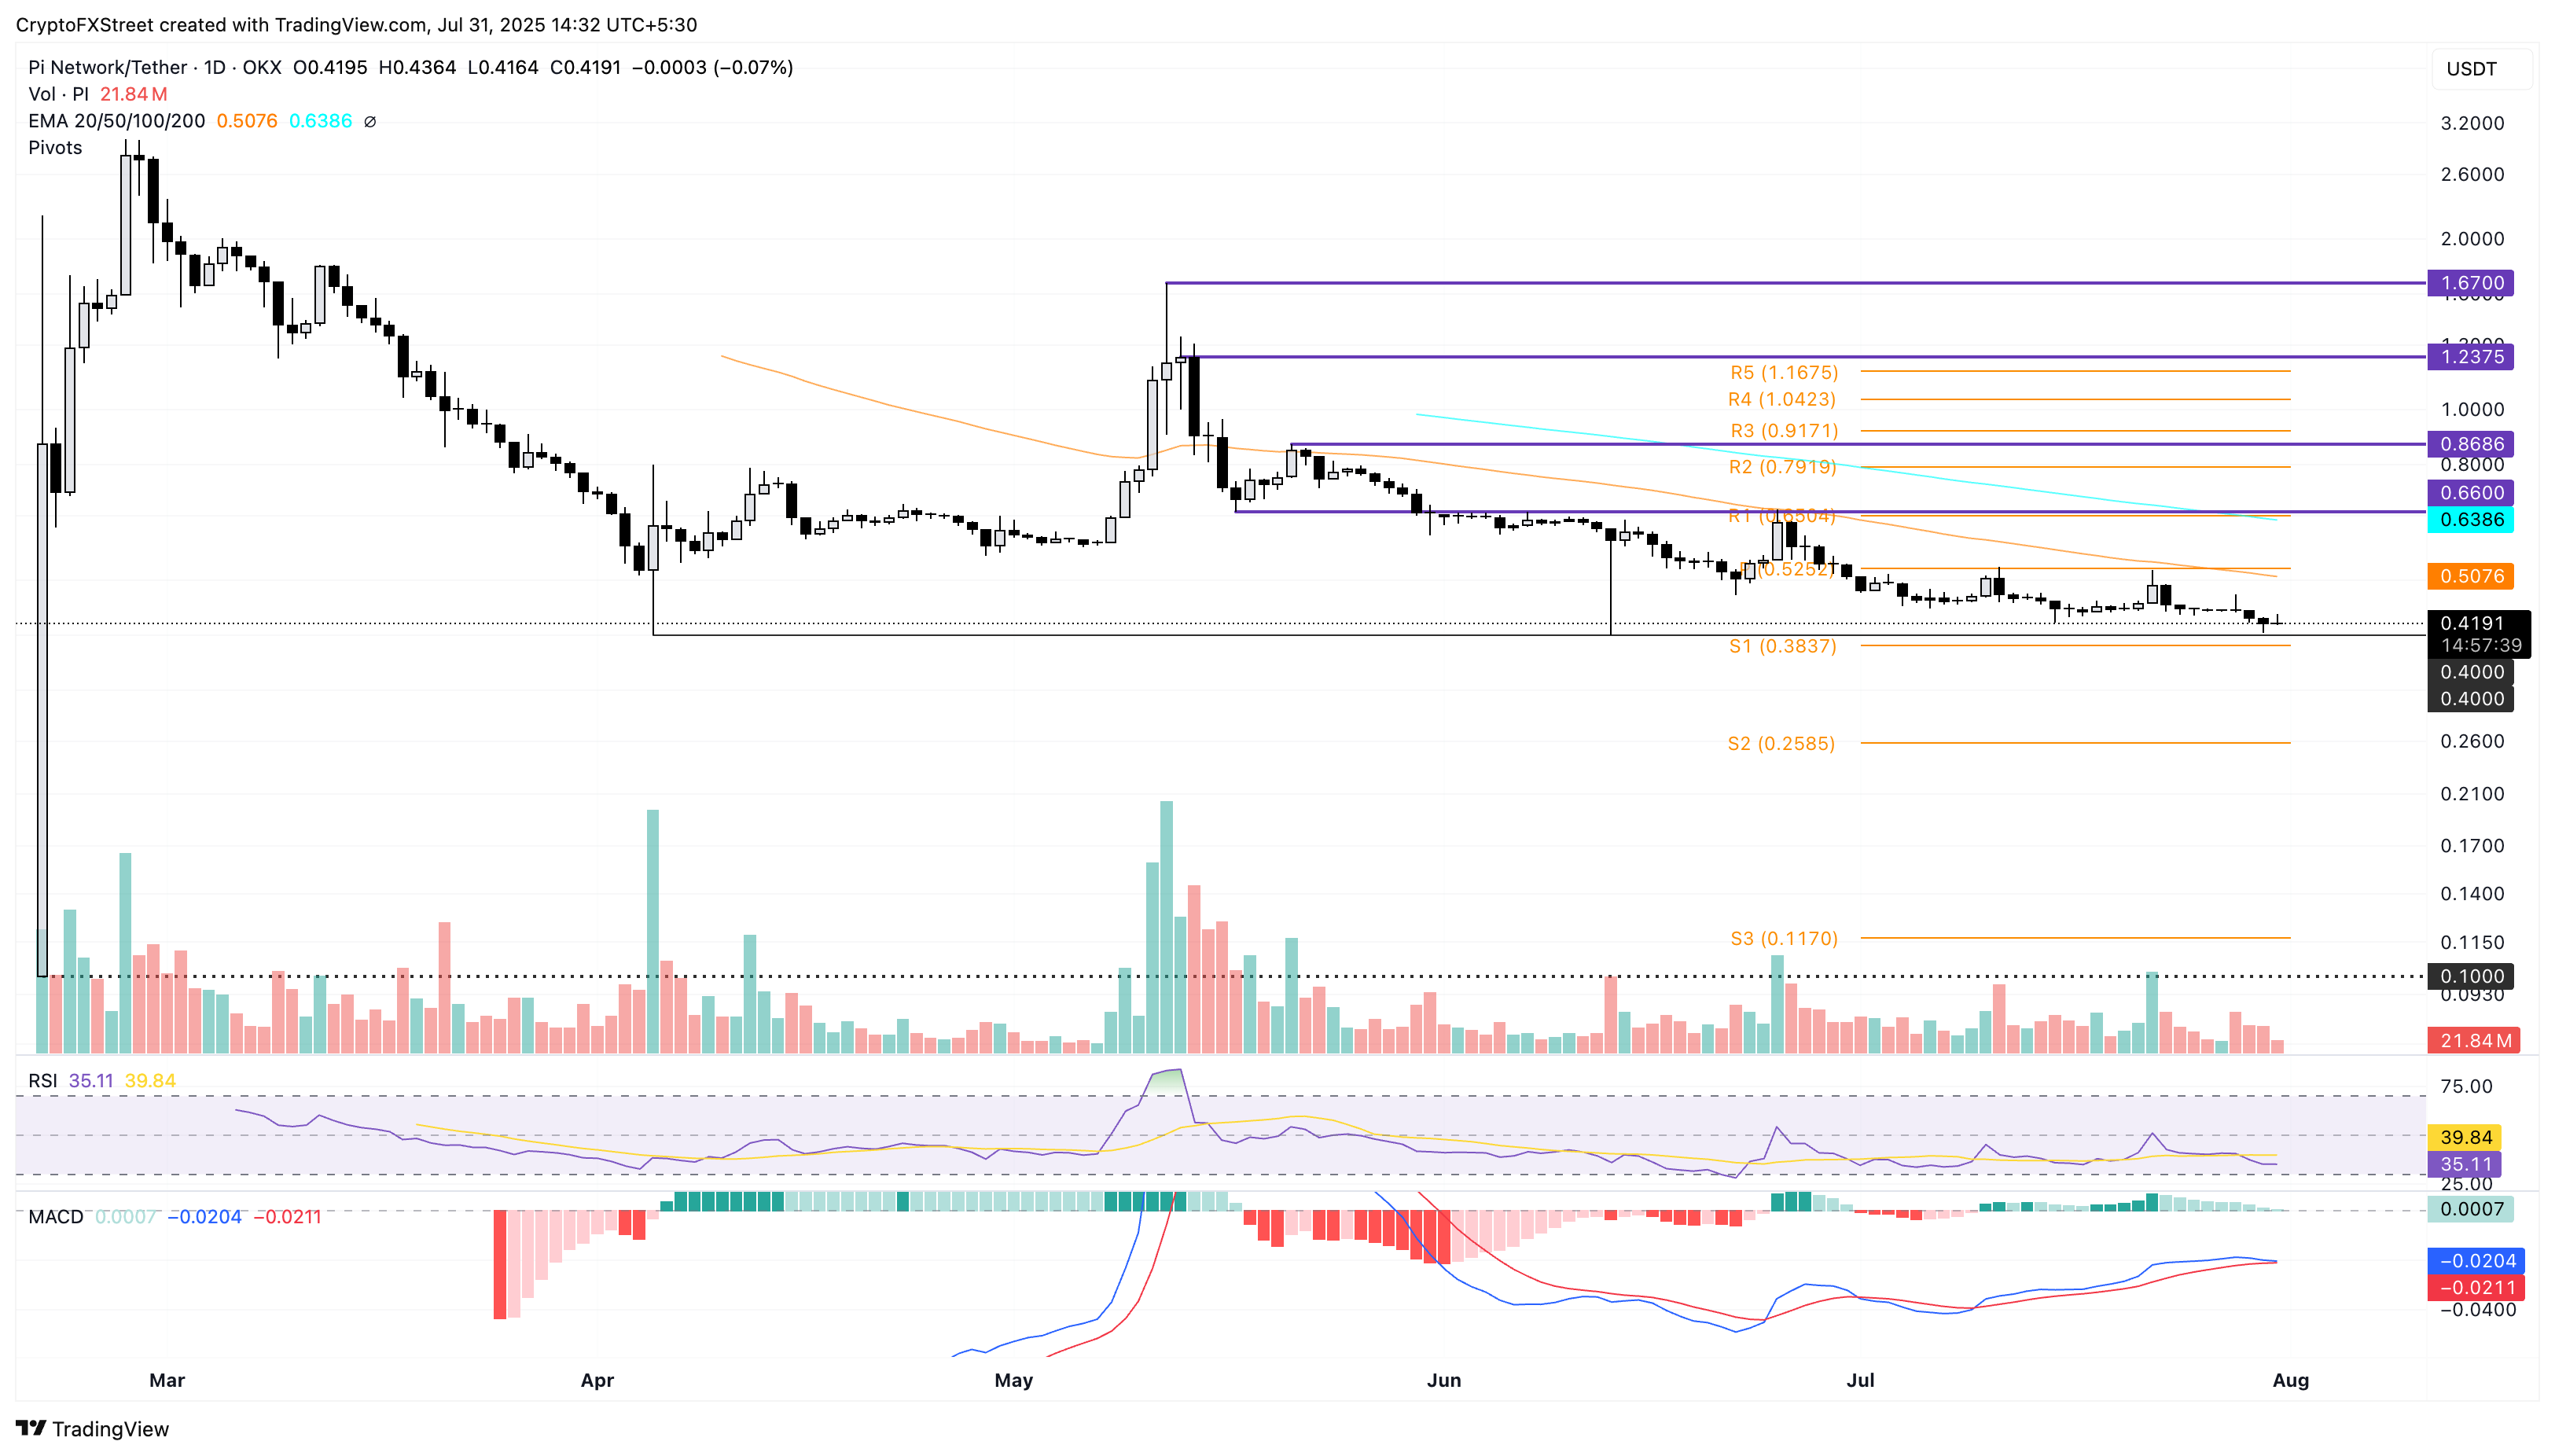
PI/USDT daily price chart.
Looking up, PI should reclaim the $0.5000 psychological level to negate the downtrend.
Cryptocurrency metrics FAQs
The developer or creator of each cryptocurrency decides on the total number of tokens that can be minted or issued. Only a certain number of these assets can be minted by mining, staking or other mechanisms. This is defined by the algorithm of the underlying blockchain technology. On the other hand, circulating supply can also be decreased via actions such as burning tokens, or mistakenly sending assets to addresses of other incompatible blockchains.
Market capitalization is the result of multiplying the circulating supply of a certain asset by the asset’s current market value.
Trading volume refers to the total number of tokens for a specific asset that has been transacted or exchanged between buyers and sellers within set trading hours, for example, 24 hours. It is used to gauge market sentiment, this metric combines all volumes on centralized exchanges and decentralized exchanges. Increasing trading volume often denotes the demand for a certain asset as more people are buying and selling the cryptocurrency.
Funding rates are a concept designed to encourage traders to take positions and ensure perpetual contract prices match spot markets. It defines a mechanism by exchanges to ensure that future prices and index prices periodic payments regularly converge. When the funding rate is positive, the price of the perpetual contract is higher than the mark price. This means traders who are bullish and have opened long positions pay traders who are in short positions. On the other hand, a negative funding rate means perpetual prices are below the mark price, and hence traders with short positions pay traders who have opened long positions.

FXStreet
超過一百萬用戶依賴 FXStreet 獲取即時市場數據、圖表工具、專家洞見與外匯新聞。其全面的經濟日曆與教育網路研討會協助交易者保持資訊領先、做出審慎決策。FXStreet 擁有約 60 人的團隊,分布於巴塞隆納總部及全球各地。
Read More


