
Trade The World
Stellar Price Forecast: XLM poised for breakout amid rising TVL, fading bearish momentum
作者 Manish Chhetri
發布日期: 30 Sep 2025 | 修改日期: 30 Sep 2025


POPULAR ARTICLES

Stellar (XLM) price edges slightly lower, trading within a falling wedge pattern on the daily chart around $0.370 at the time of writing on Tuesday. A breakout of this continuation pattern would favor the bulls.
- Stellar price trades within a falling wedge pattern, aiming for a breakout with a potential bullish move.
- On-chain and derivatives data indicate positive momentum, as TVL rises and bullish bets reach the highest in over a month.
- Technicals suggest a bullish leg ahead, as momentum indicators show signs of fading bearish pressure.
Stellar (XLM) price edges slightly lower, trading within a falling wedge pattern on the daily chart around $0.370 at the time of writing on Tuesday. A breakout of this continuation pattern would favor the bulls. The bullish outlook is further supported by the rising Total Value Locked (TVL) and the increasing number of bullish bets among traders. Furthermore, momentum indicators also suggest that bearish pressure is fading, indicating that XLM may be poised for an upside breakout.
On-chain and derivatives data show a bullish bias
Arthemis Terminal data shows that XLM’s TVL increases to $144.4 million on Tuesday from $139.1 million on Saturday, nearing its record high levels of $153.6 million reached in August. Rising TVL indicates growing activity and interest within Stellar’s ecosystem, suggesting that more users are depositing or utilizing assets within XLM-based protocols.
 (1)-1759220039661-1759220039663.jpeg)
Stellar TVL chart. Source: Artemis
On the derivatives side, XLM bullish bets among traders reach the highest level in over a month. The CoinGlass chart below shows that the XLM long-to-short ratio stands at 1.07 on Tuesday, indicating that traders are betting on the asset’s price to rise.
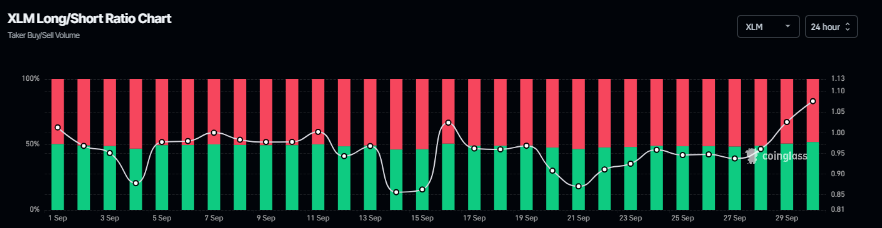
XLM long-to-short ratio chart. Source: Coinglass
Stellar Price Forecast: XLM shows fading bearish momentum
XLM price trades within a falling wedge pattern (drawn by connecting multiple highs and lows with two trendlines since mid-July) on the daily chart. At the time of writing on Tuesday, XLM trades around $0.367, near the upper trendline boundary.
If XLM breaks above the upper trendline and closes above the daily resistance at $0.382, it could extend the rally toward the July 18 high of $0.520.
The Relative Strength Index (RSI) on the daily chart reads 45, nearing its neutral level of 50, which indicates a fading of bearish momentum. However, for the breakout of the wedge pattern to be sustained, the RSI must move above its neutral level. Moreover, the Moving Average Convergence Divergence (MACD) lines are also about to flip to a bullish crossover, while the falling red histogram bars also indicate the fading of bearish momentum.
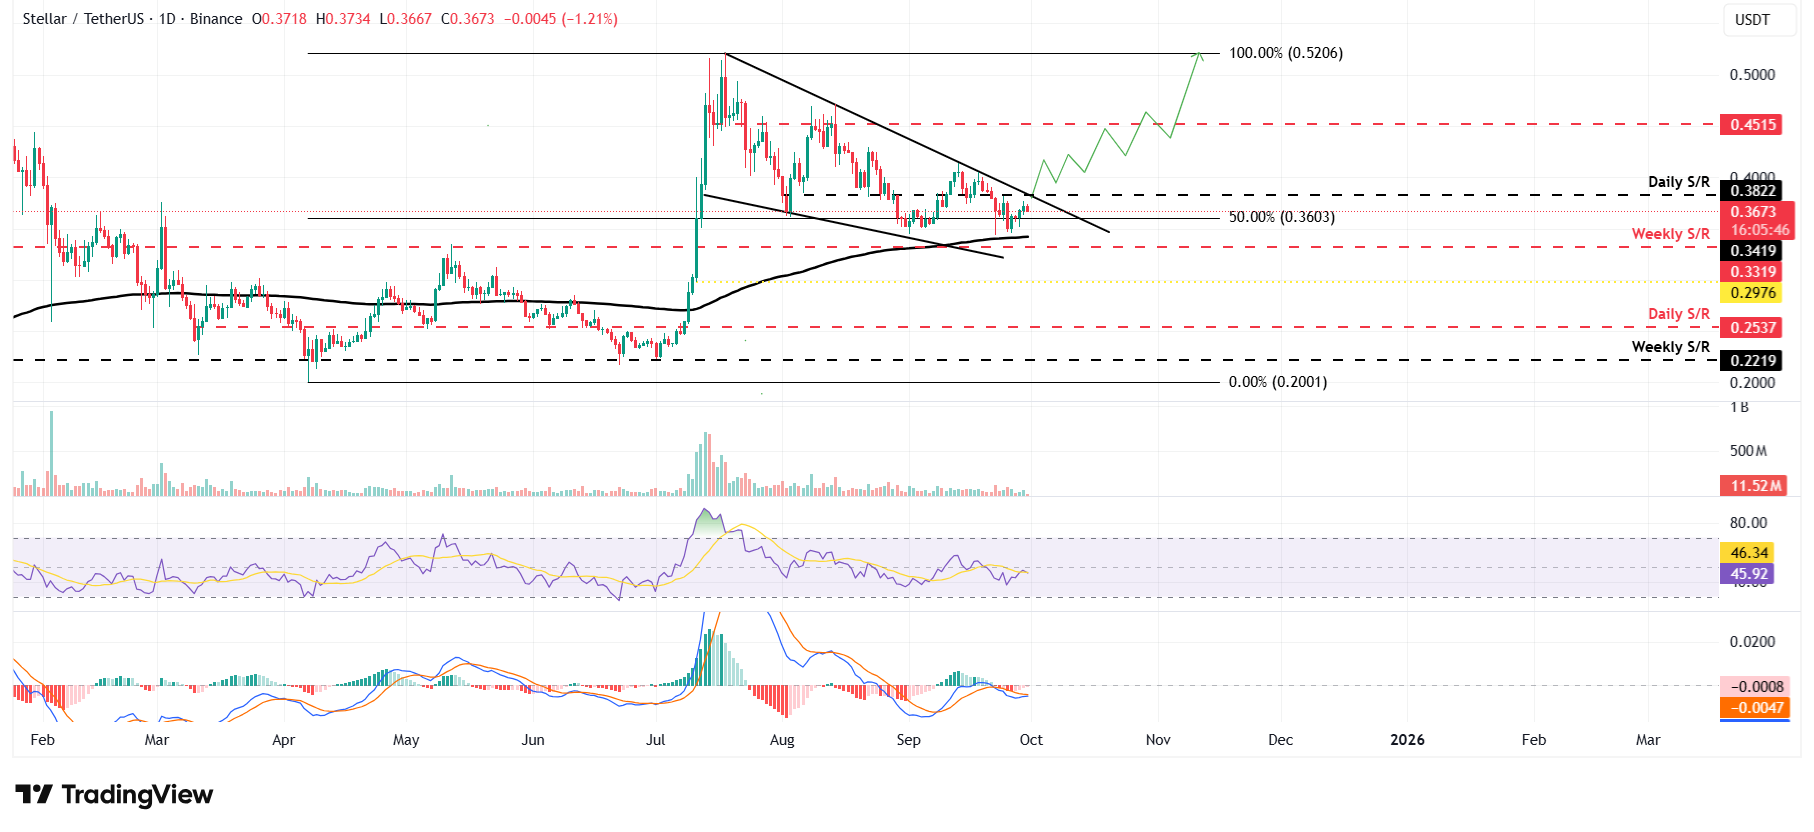
XLM/USDT daily chart
However, if XLM faces a correction, it could extend the decline toward the 200-day Exponential Moving Average (EMA) at $0.341.

FXStreet
超過一百萬用戶依賴 FXStreet 獲取即時市場數據、圖表工具、專家洞見與外匯新聞。其全面的經濟日曆與教育網路研討會協助交易者保持資訊領先、做出審慎決策。FXStreet 擁有約 60 人的團隊,分布於巴塞隆納總部及全球各地。
Read More


