
Trade The World
Story, Ethena, and Bittensor lead crypto recovery, face key resistance levels ahead
作者 Vishal Dixit
發布日期: 14 Oct 2025 | 修改日期: 14 Oct 2025


POPULAR ARTICLES

Story (IP), Ethena (ENA), and Bittensor (TAO) rise as top performers in a recovering market based on the last 24 hours' price movement. Ethena and Bittensor rebound on the onshoring of the USDtb stablecoin and Barry Silbert’s flagship funds, respectively.
- Story token takes a breather after a 22% jump on Monday, risking the three-day streak of positive daily candles.
- Ethena’s recovery run gains momentum above $0.45 with multiple resistances lurking above.
- Bittensor rally thrives above $400, approaches a critical multi-month resistance level near $462.
Story (IP), Ethena (ENA), and Bittensor (TAO) rise as top performers in a recovering market based on the last 24 hours' price movement. Ethena and Bittensor rebound on the onshoring of the USDtb stablecoin and Barry Silbert’s flagship funds, respectively.
Technically, the recovery run in top performers faces critical resistances ahead that could dampen the rebound.
Story struggles at the 100-day EMA
Story token ticks lower by 2% at press time on Tuesday, after three consecutive days of recovery. IP faces opposition from the $7.232 level near the 100-day Exponential Moving Average (EMA), which previously acted as support on September 26.
The intraday pullback risks a further decline to the 200-day EMA at $6.200, followed by the $5.417 support level, marked by the August 15 low.
Technical indicators on the daily chart flash mixed signals as the Relative Strength Index (RSI) bounces off to 41 from the oversold boundary line, suggesting that the selling pressure has softened. Meanwhile, the Moving Average Convergence Divergence (MACD) and its signal line sustain a declining trend, a sign of overhead pressure. If MACD crosses above the signal line, it would confirm a bullish shift in trend momentum.
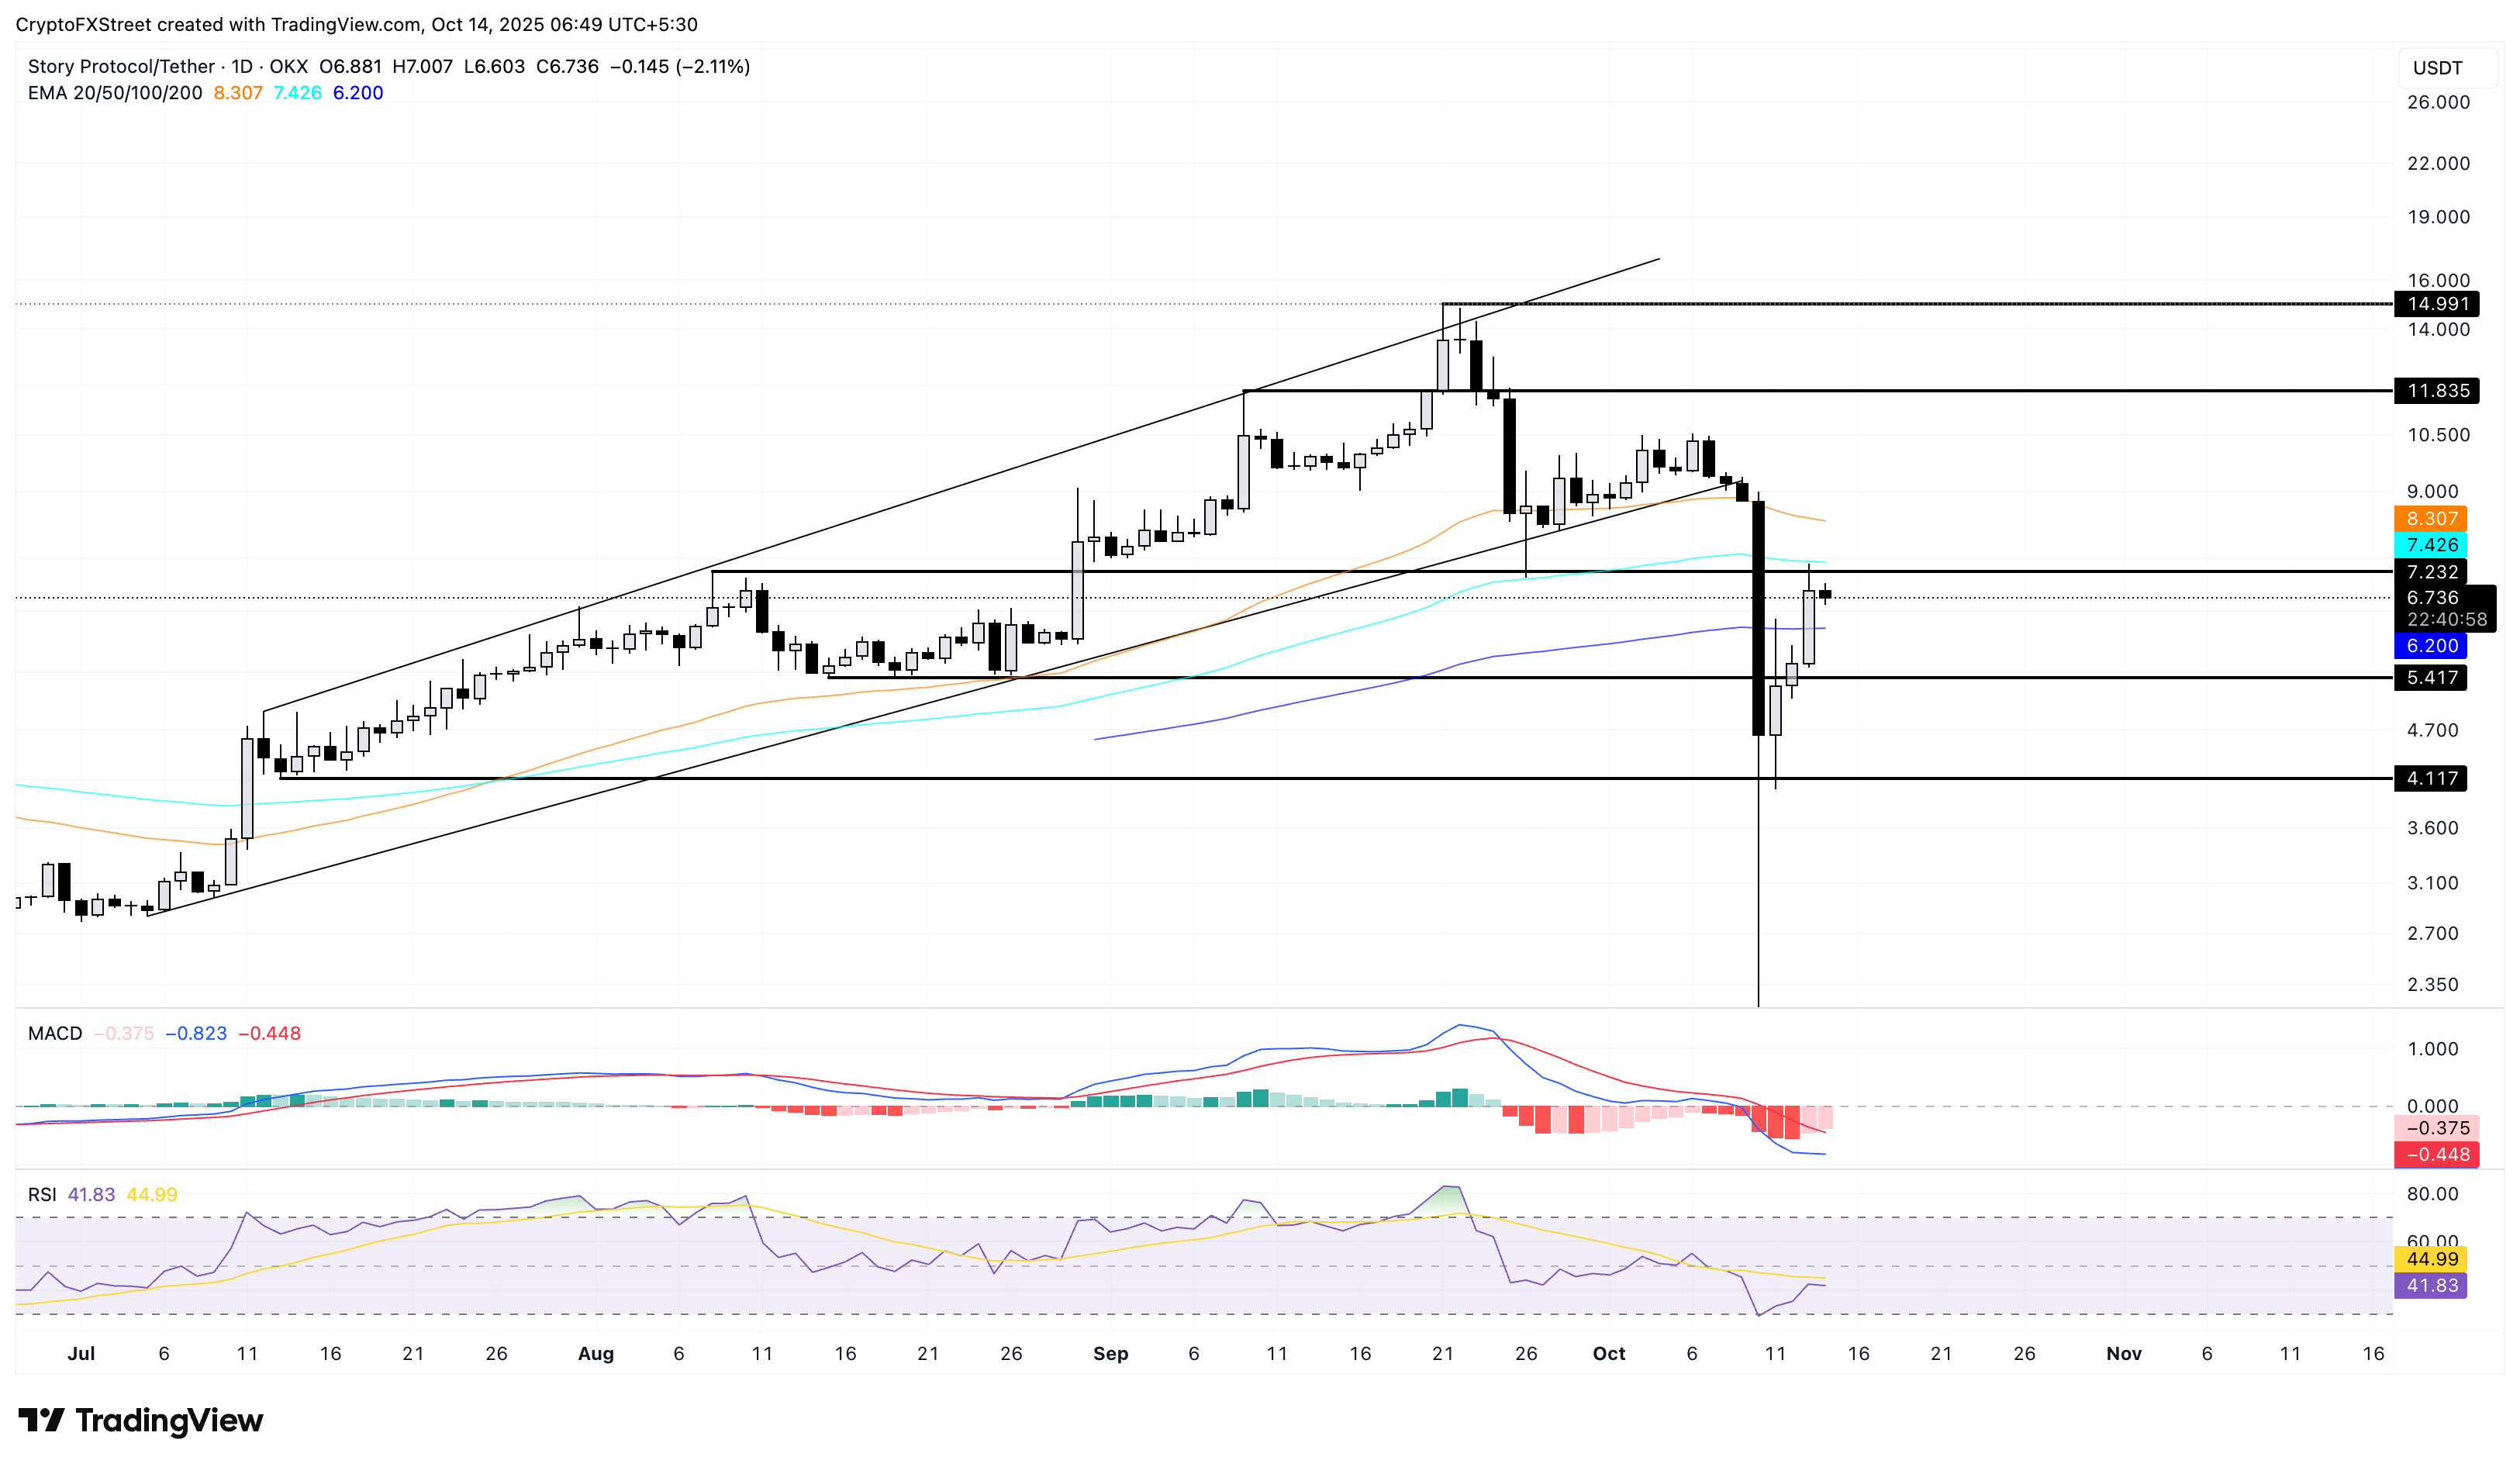
IP/USDT daily price chart.
However, a clean push above $7.232 could extend the IP rally to the 50-day EMA at $8.307, followed by the $11.835 level, aligning with the September 9 high.
Ethena approaches key resistances amid USDtb onshore shift
Ethena holds steady above $0.4600 at the time of writing on Tuesday, following the 13% jump from the previous day, which extended the 7% rise from Sunday. The transition of USDtb smart contracts to Anchorage Digital marks an onshore shift to the stablecoin, taking a step closer to complete GENIUS Act compliance.

The recovery run on the 4–hour chart approaches the 50-period EMA at $0.4858 as the initial dynamic resistance. If the uptrend crosses above this EMA, the resistance trendline formed by connecting the highs of September 9 and October 2 near the 100-period EMA at $0.5322 would be a critical crossroads.
The technical indicators on the same chart maintain a bullish bias as the uptrend in MACD and its signal line is supported by a steady rise in green histogram bars. At the same time, the RSI at 54 crosses above the halfway line, indicating an increase in buying pressure.
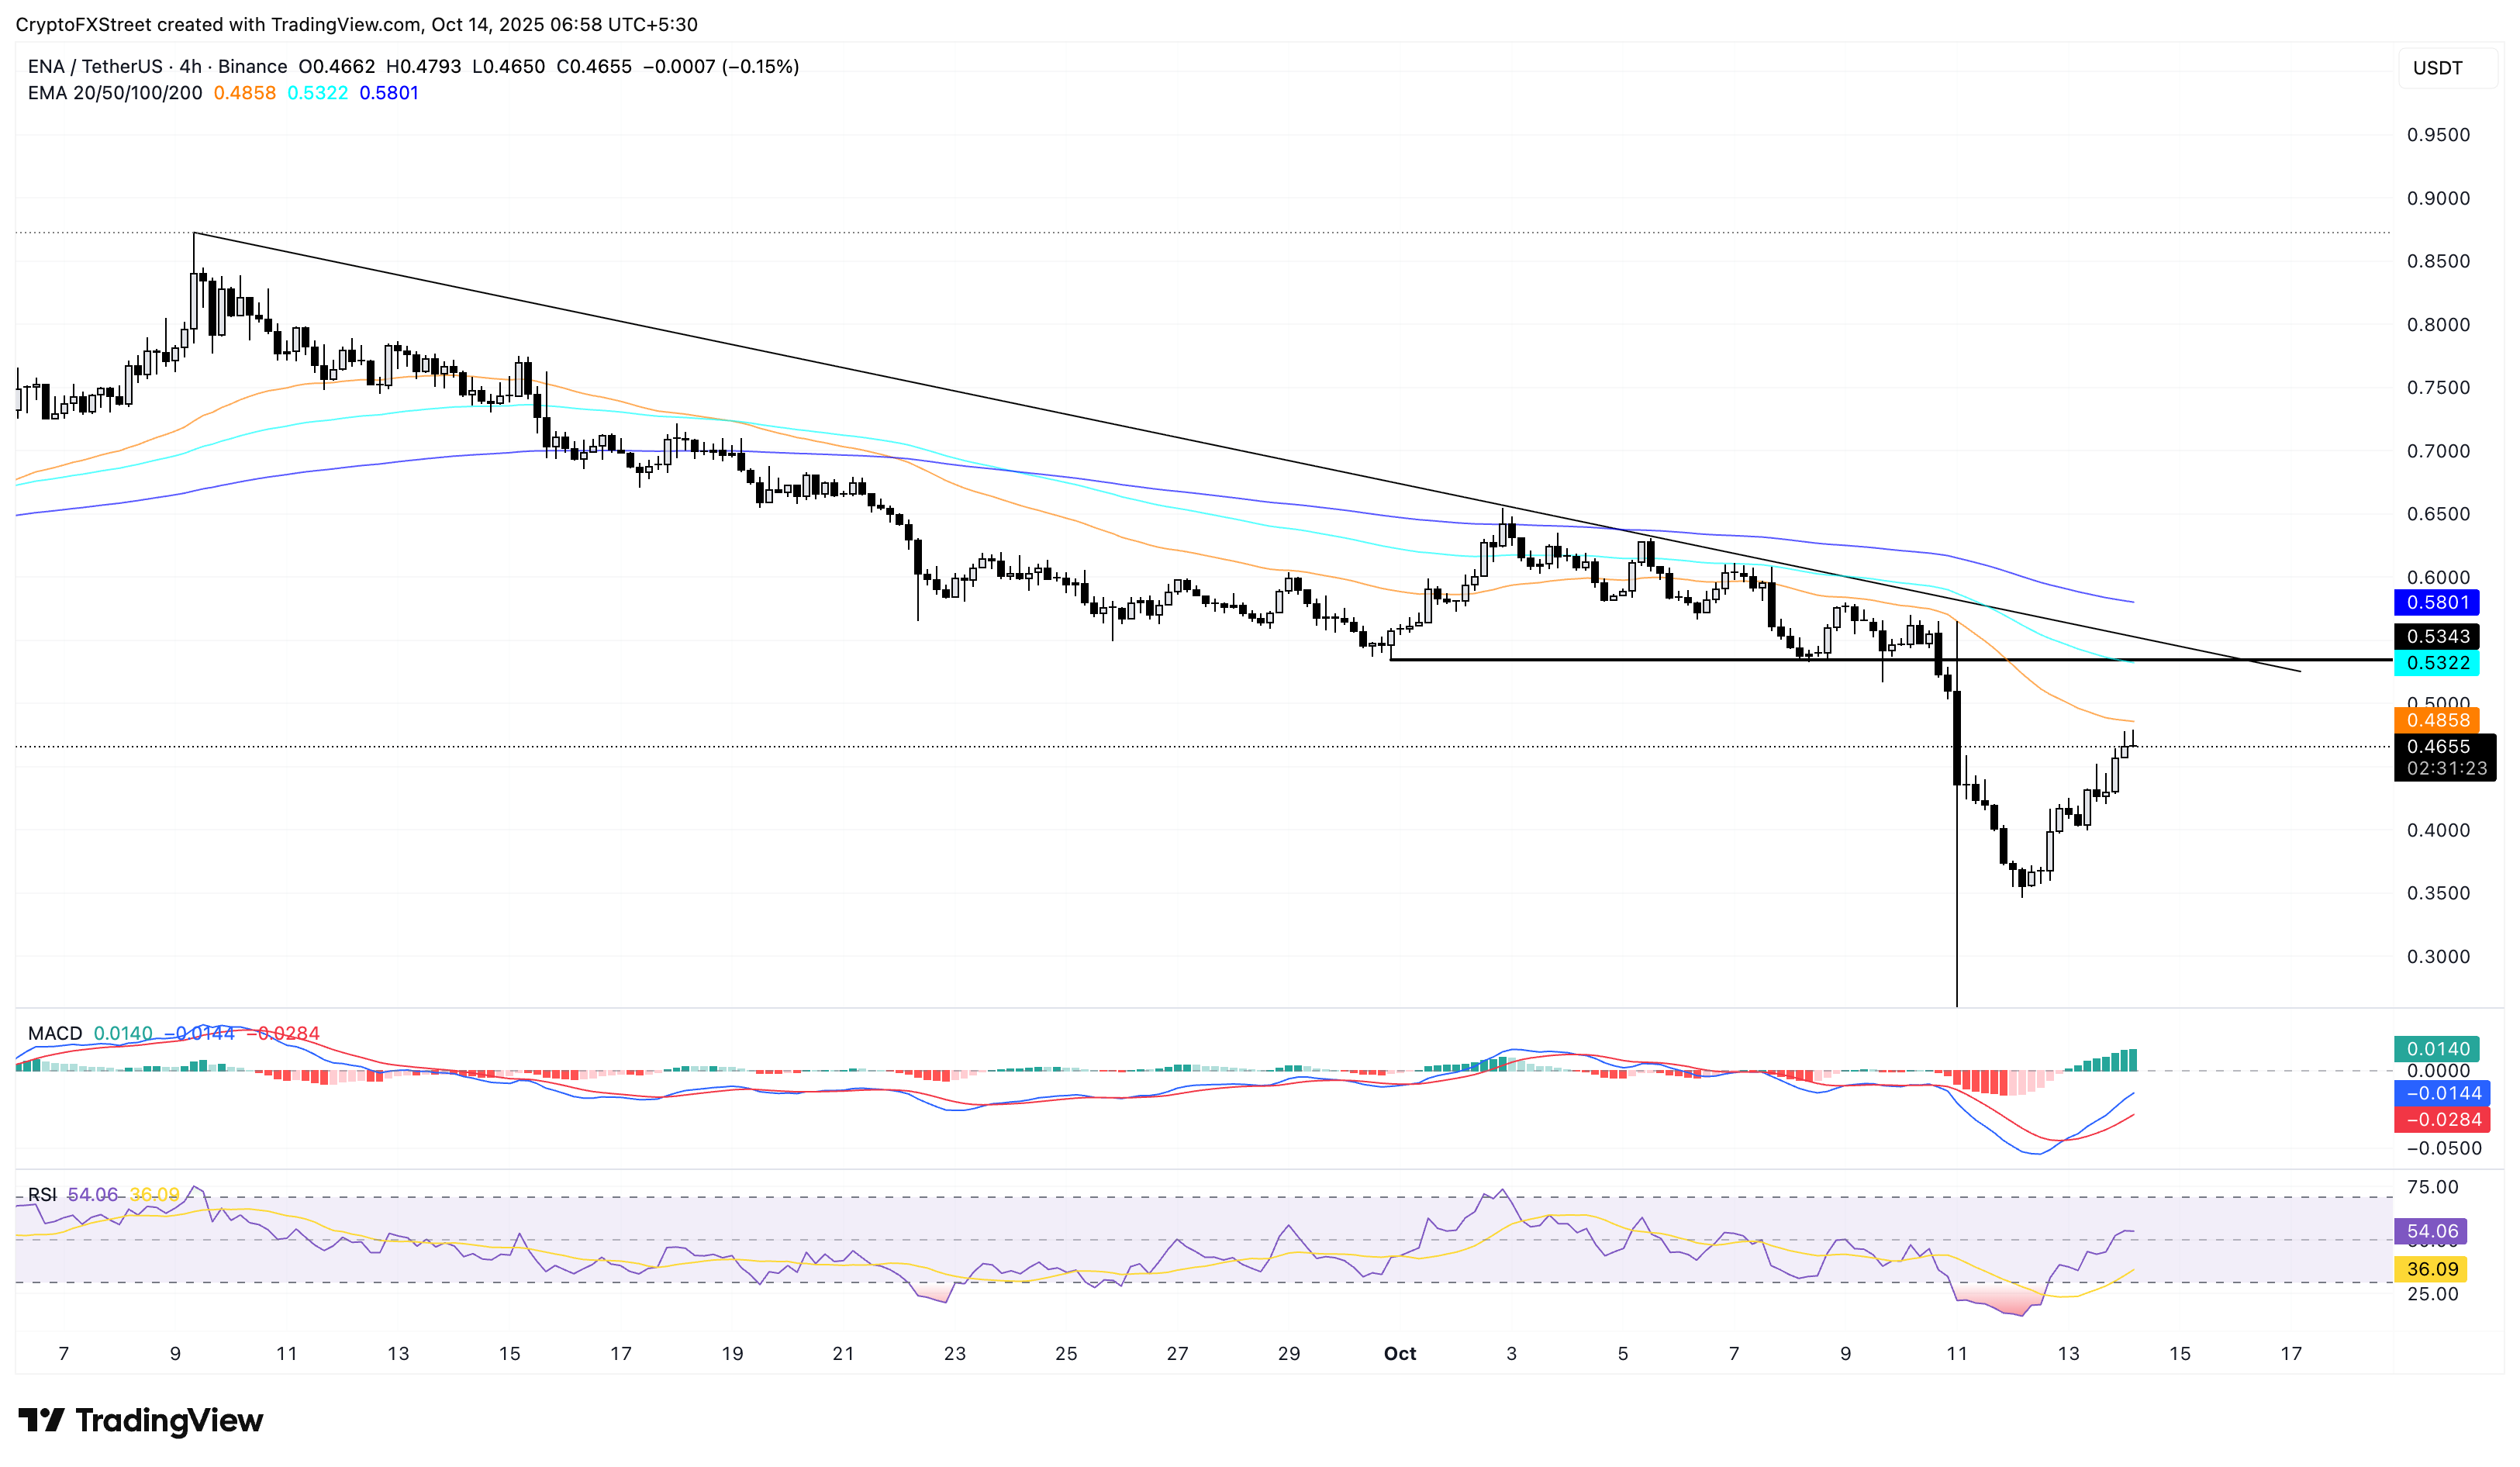
ENA/USDT 4-hour price chart.
On the flip side, a reversal from the 50-period EMA could retest the $0.4000 round figure, followed by the $0.3459 low from Sunday.
Bittensor breakout rally gains traction
Bittensor edges lower by over 2% at press time on Tuesday, following three consecutive days of gains which broke above a resistance trendline drawn over the January 6 and July 22 peaks. The announcement of Barry Silbert’s flagship funds for Bittensor subnet tokens acts as the crucial short-term catalyst.
The breakout rally approaches a crucial resistance zone near $462, which aligns with the 50% retracement level from the $748 high of December 6 to the $177 low of April 6.
If TAO surfaces above $462 with a decisive close, it could target the 61.8% Fibonacci retracement level at $530.
The RSI is at 67, approaching the overbought zone, indicating a boost in buying pressure. Furthermore, the MACD and signal line hold a steady rise above the zero line, corroborating the rise in bullish momentum.
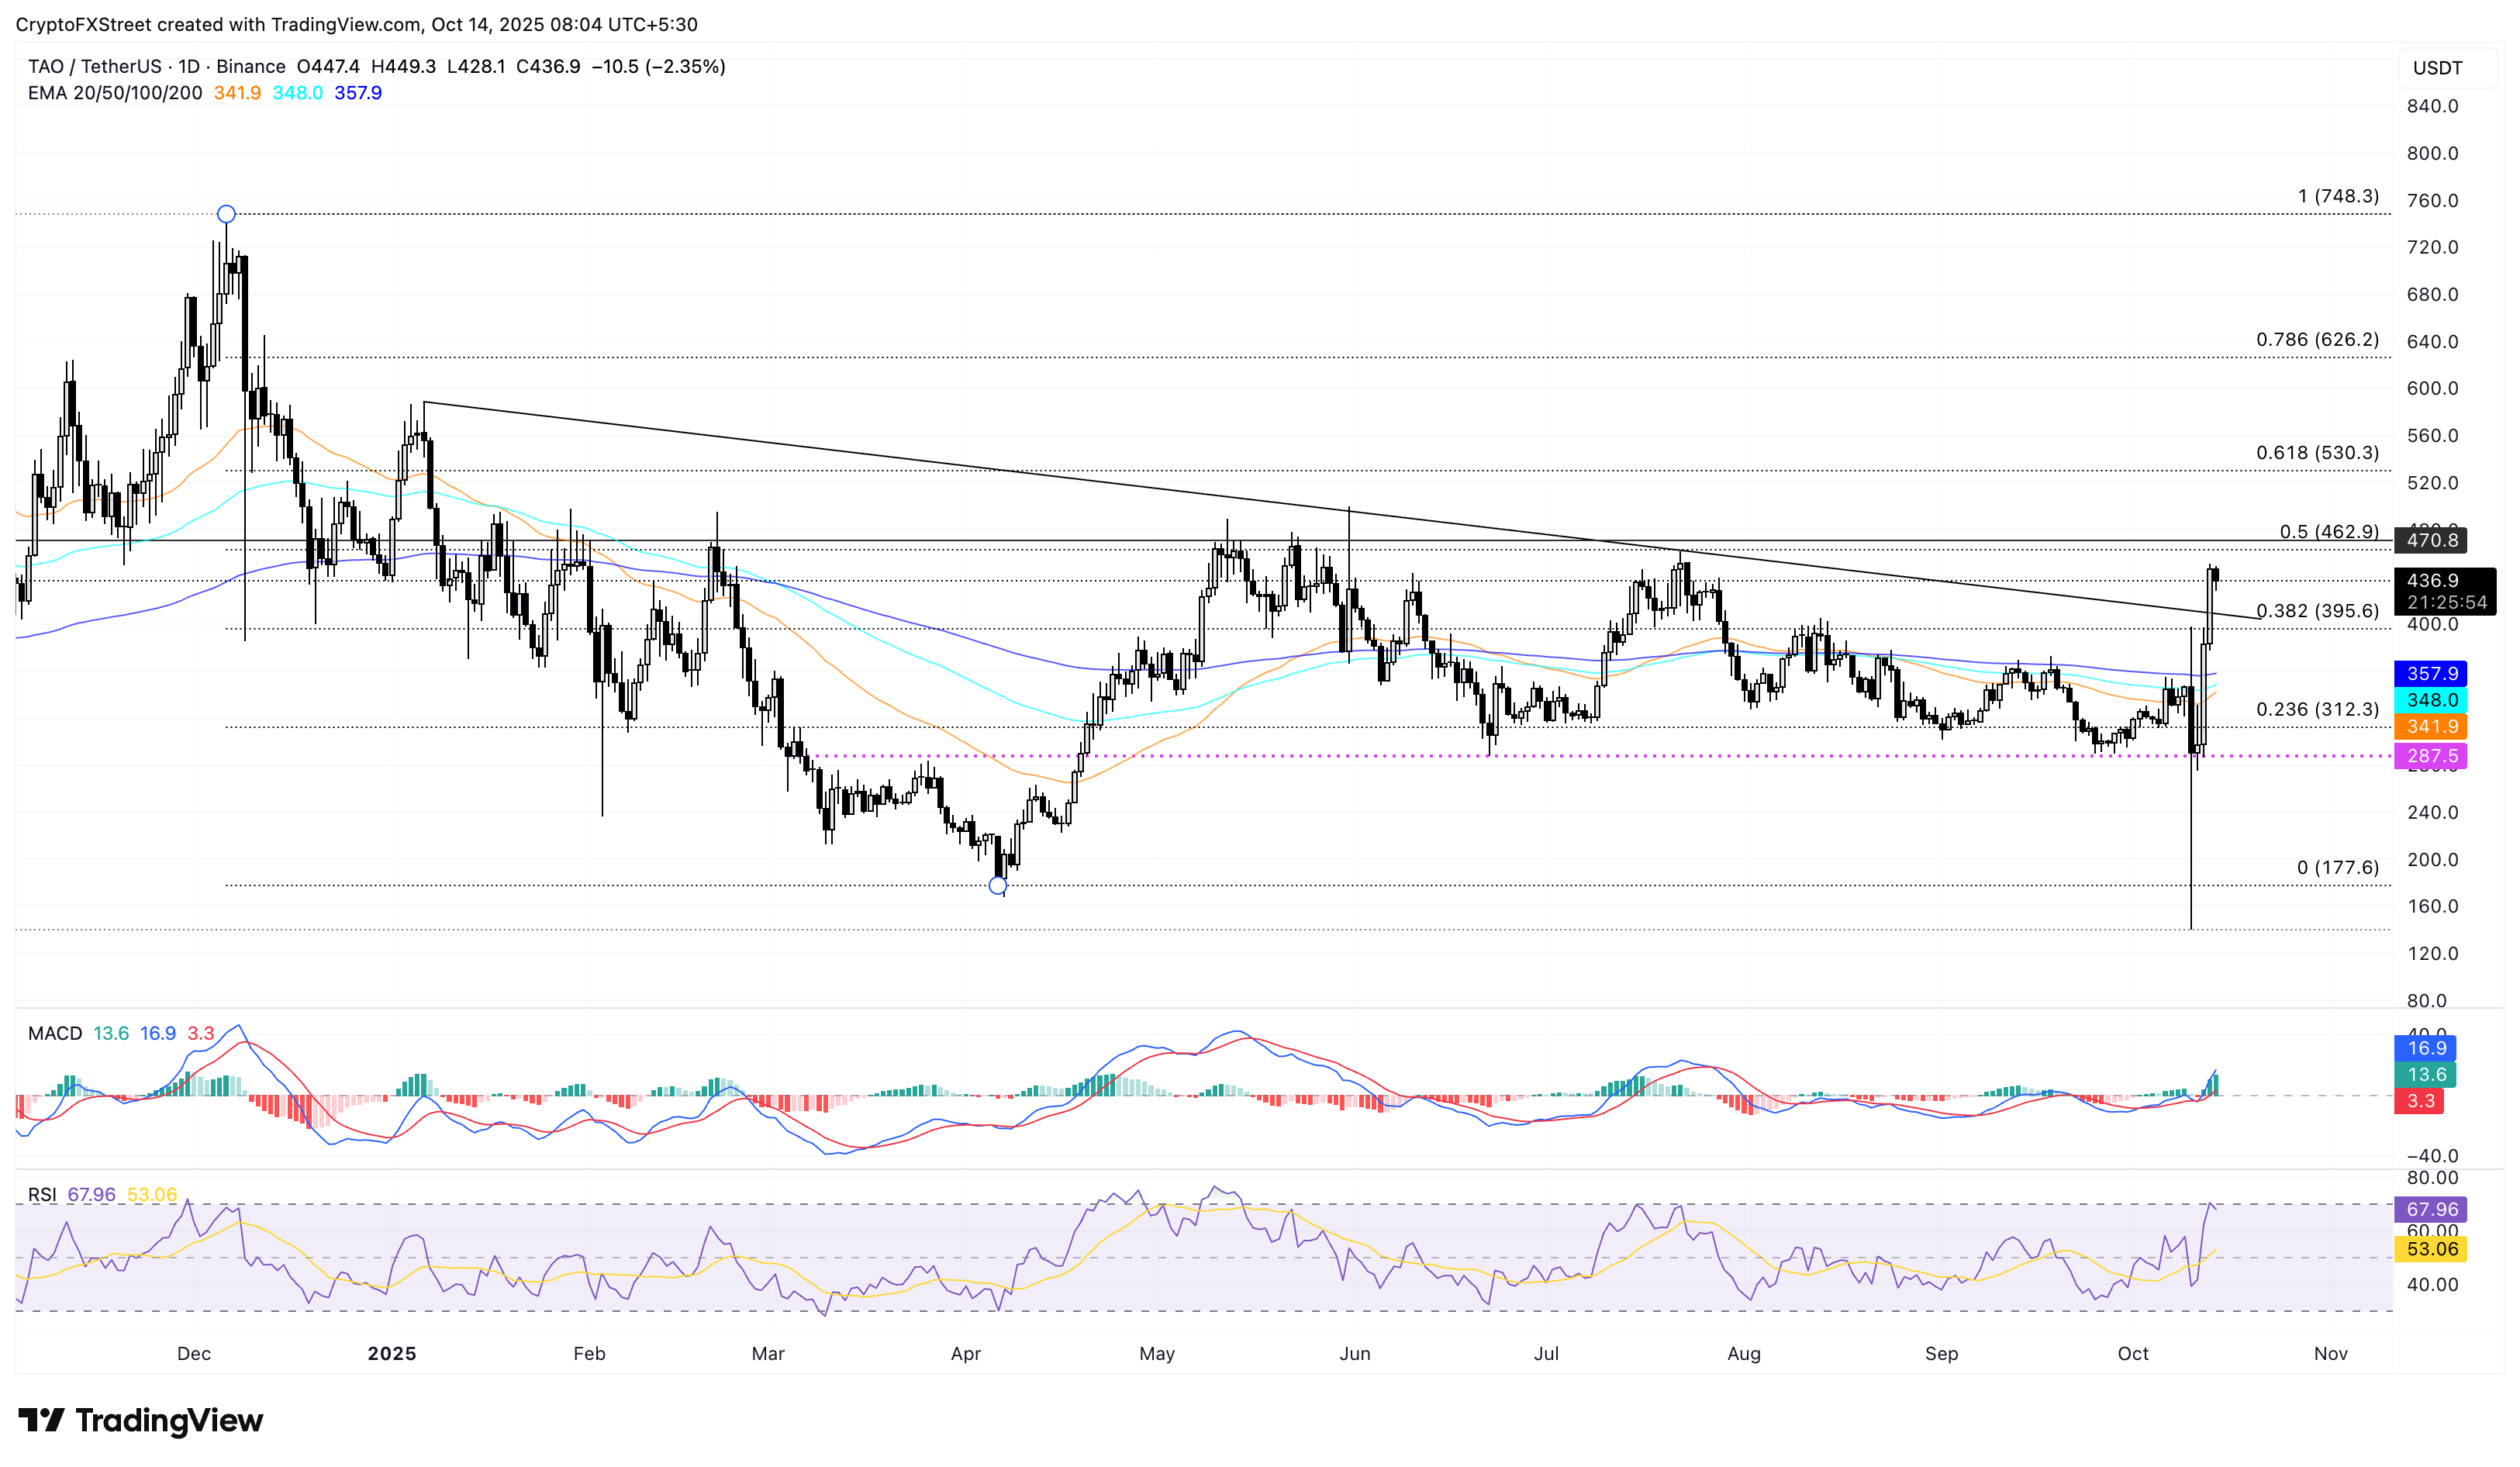
TAO/USDT daily price chart.
Looking down, a potential bearish flip could retest the 38.2% Fibonacci retracement level at $395.

FXStreet
超過一百萬用戶依賴 FXStreet 獲取即時市場數據、圖表工具、專家洞見與外匯新聞。其全面的經濟日曆與教育網路研討會協助交易者保持資訊領先、做出審慎決策。FXStreet 擁有約 60 人的團隊,分布於巴塞隆納總部及全球各地。
Read More


