
Trade The World
Top 3 Price Prediction: Bitcoin, Ethereum, Ripple – BTC and ETH eyes breakout, XRP steadies at support
作者 Manish Chhetri
發布日期: 12 Dec 2025 | 修改日期: 12 Dec 2025


POPULAR ARTICLES

Bitcoin (BTC) and Ethereum (ETH) are nearing the key resistance levels at the time of writing on Friday, and a successful breakout could open the door for a fresh rally. Meanwhile, Ripple (XRP) is stabilizing around a crucial support zone, hinting at a potential rebound if buyers maintain control.
- Bitcoin price is nearing the descending trendline, a breakout could open the door to a fresh rally.
- Ethereum is closing in on its 50-day EMA at $3,310, a decisive daily close above suggests a rally ahead.
- XRP is holding support near the $1.96 daily level, hinting at a potential rebound.
Bitcoin (BTC) and Ethereum (ETH) are nearing the key resistance levels at the time of writing on Friday, and a successful breakout could open the door for a fresh rally. Meanwhile, Ripple (XRP) is stabilizing around a crucial support zone, hinting at a potential rebound if buyers maintain control.
Bitcoin could rally if it closes above key resistance zone
Bitcoin price was rejected at the 61.8% Fibonacci retracement level at $94,253 (drawn from the April low of $74,508 to the all-time high of $126,199 set in October) on Wednesday and declined slightly that day. However, on Thursday, BTC rebounded after retesting its $90,000 psychological level. At the time of writing on Friday, BTC hovers at around $92,000.
If BTC breaks above the descending trendline and closes above the $94,253 resistance level, it could extend the rally toward the $100,000 psychological level.
The Relative Strength Index (RSI) on the daily chart is near the neutral 50 level, suggesting fading bearish momentum. For the bullish momentum to be sustained, the RSI must move above the neutral level. Moreover, the Moving Average Convergence Divergence (MACD) showed a bullish crossover at the end of November, which remains intact, supporting the bullish thesis.
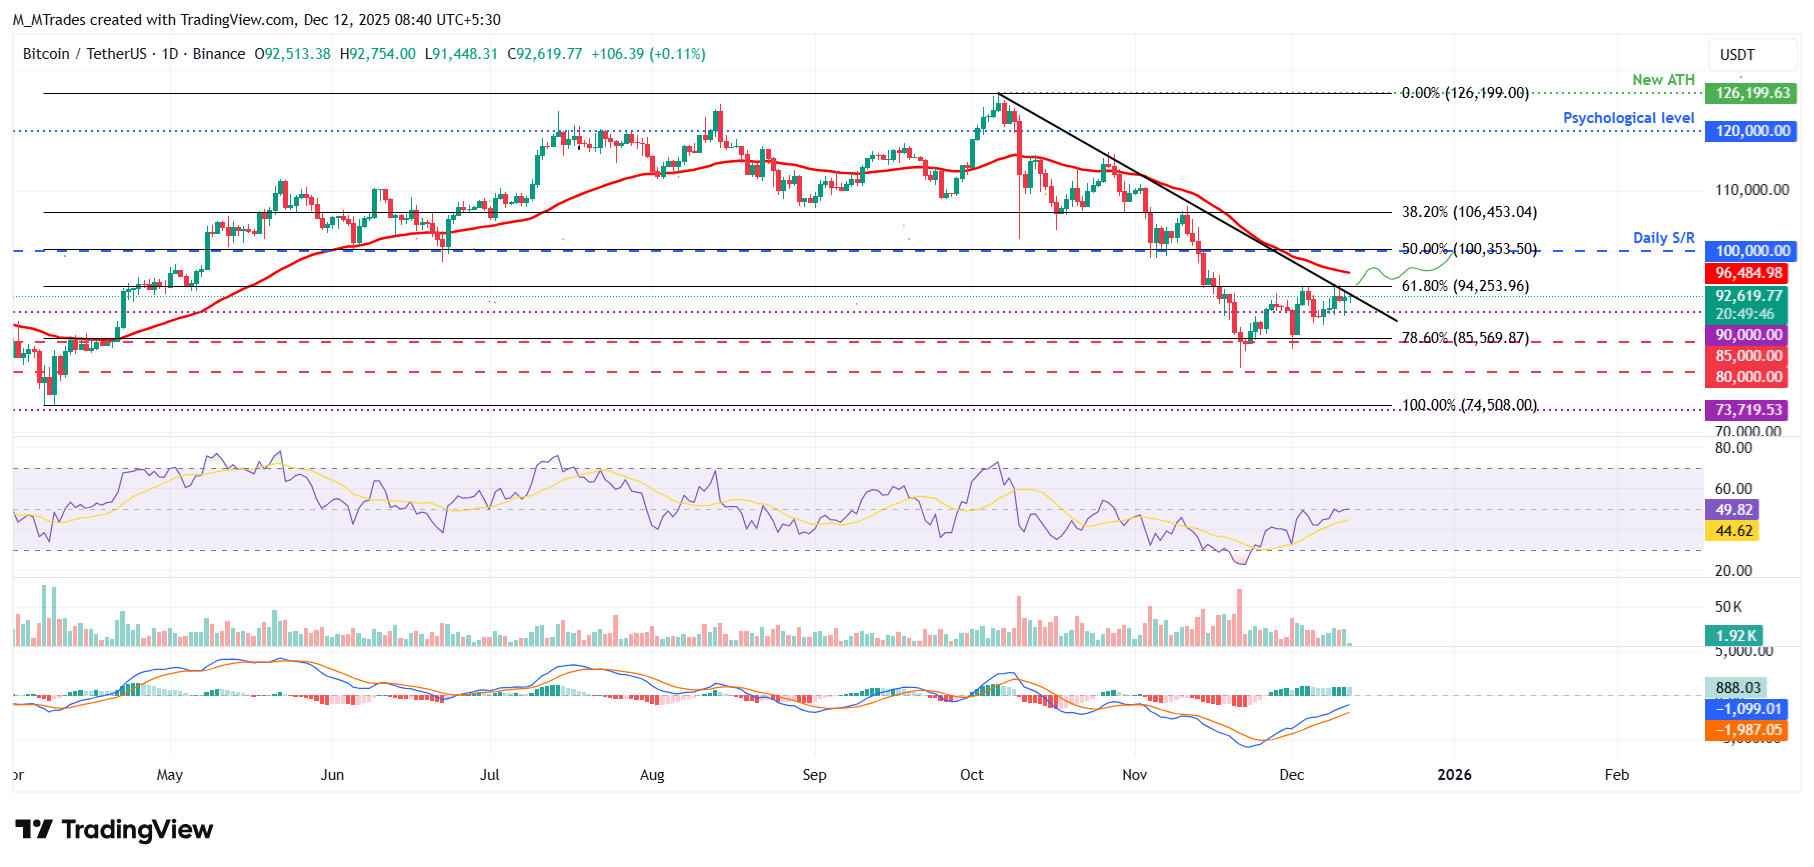
Looking up, if BTC continues its correction, the next key support is at $85,569, which aligns with the 78.6% Fibonacci retracement level.
Ethereum could extend gains if it closes above the 50-day EMA
Ethereum price broke above the descending trendline (drawn by joining multiple highs since October 7) on Tuesday and rose 6.21%. However, on Wednesday, ETH faced resistance around the 50-day Exponential Moving Average (EMA) at $3,310 and declined slightly the next day. As of Friday, ETH is nearing the 50-day EMA.
If ETH closes above the 50-day EMA at $3,310, it could extend the rally toward the next key resistance at $3,592.
The RSI on the daily chart is at 54, above its neutral level of 50, indicating bullish momentum is gaining traction. The Moving Average Convergence Divergence (MACD) showed a bullish crossover, which remains intact, supporting the bullish thesis.
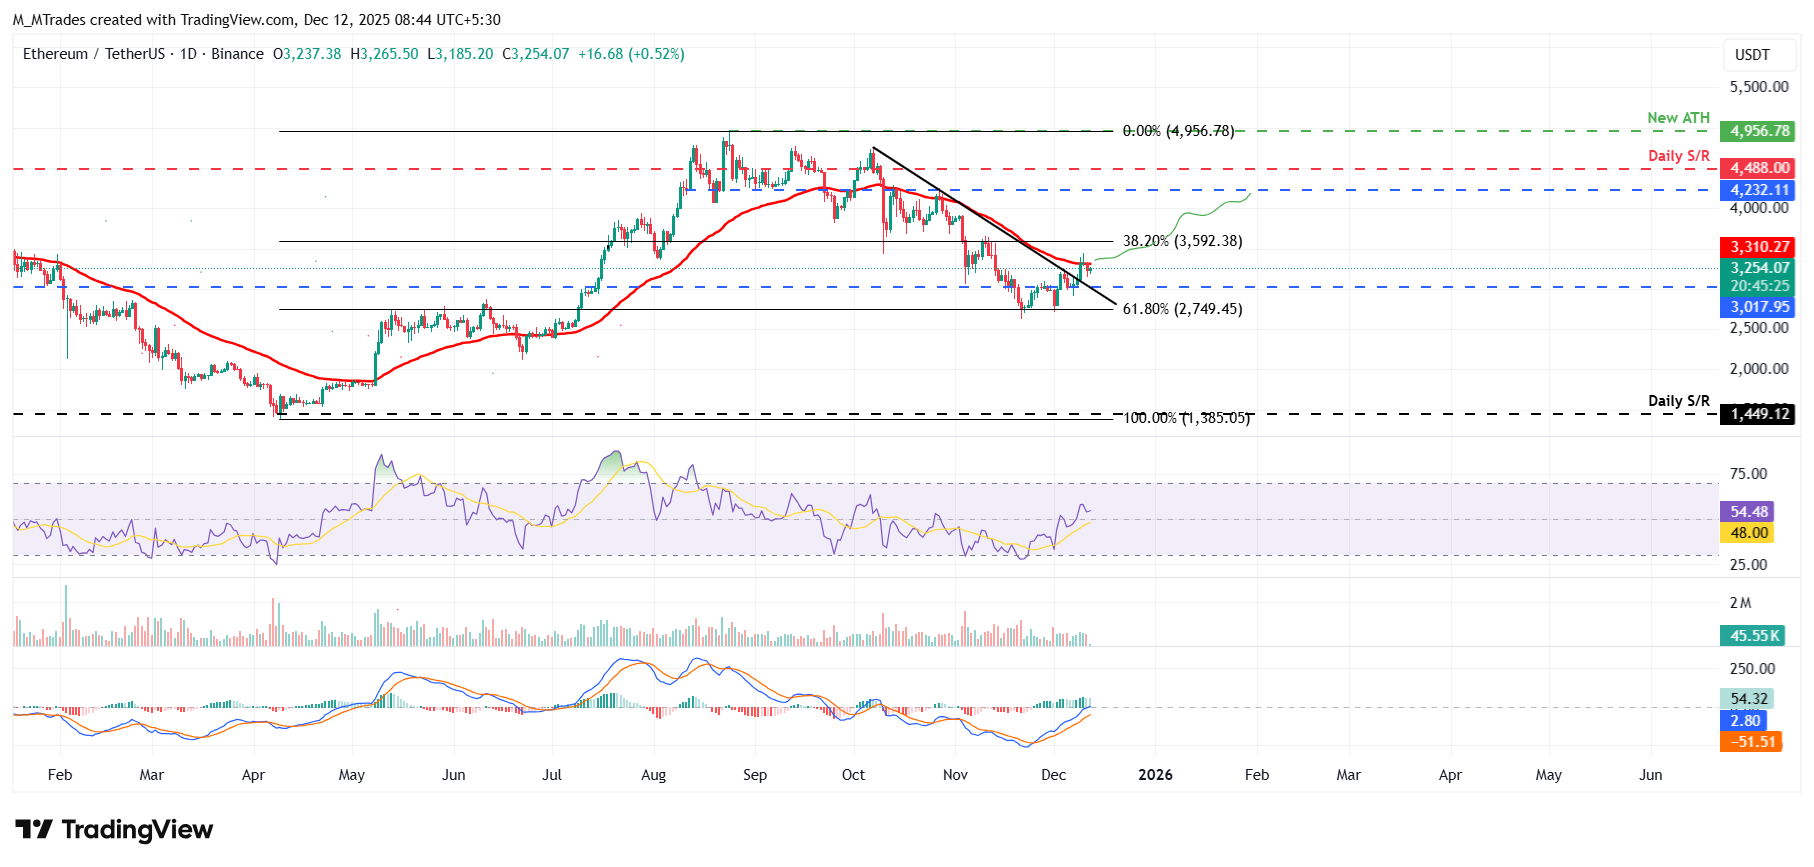
On the other hand, if ETH faces a correction, it could extend the decline toward the daily support at $3,017.
XRP finds support around key level
XRP price found support at $1.96 on Sunday and rose 3.66% over the next two days. However, on Wednesday, XRP corrected, erasing most of its recent gains and resting on the daily support at $1.96 the next day. As of Friday, XRP hovers around $2.03.
If the daily support at $1.96 holds, it could extend the rally toward the next daily resistance at $2.35.
The RSI on the daily chart reads 42, near the neutral 50 level, suggesting fading bearish momentum. For the bullish momentum to be sustained, the RSI must move above the neutral level. However, the Moving Average Convergence Divergence (MACD) lines are converging, indicating indecision among traders.
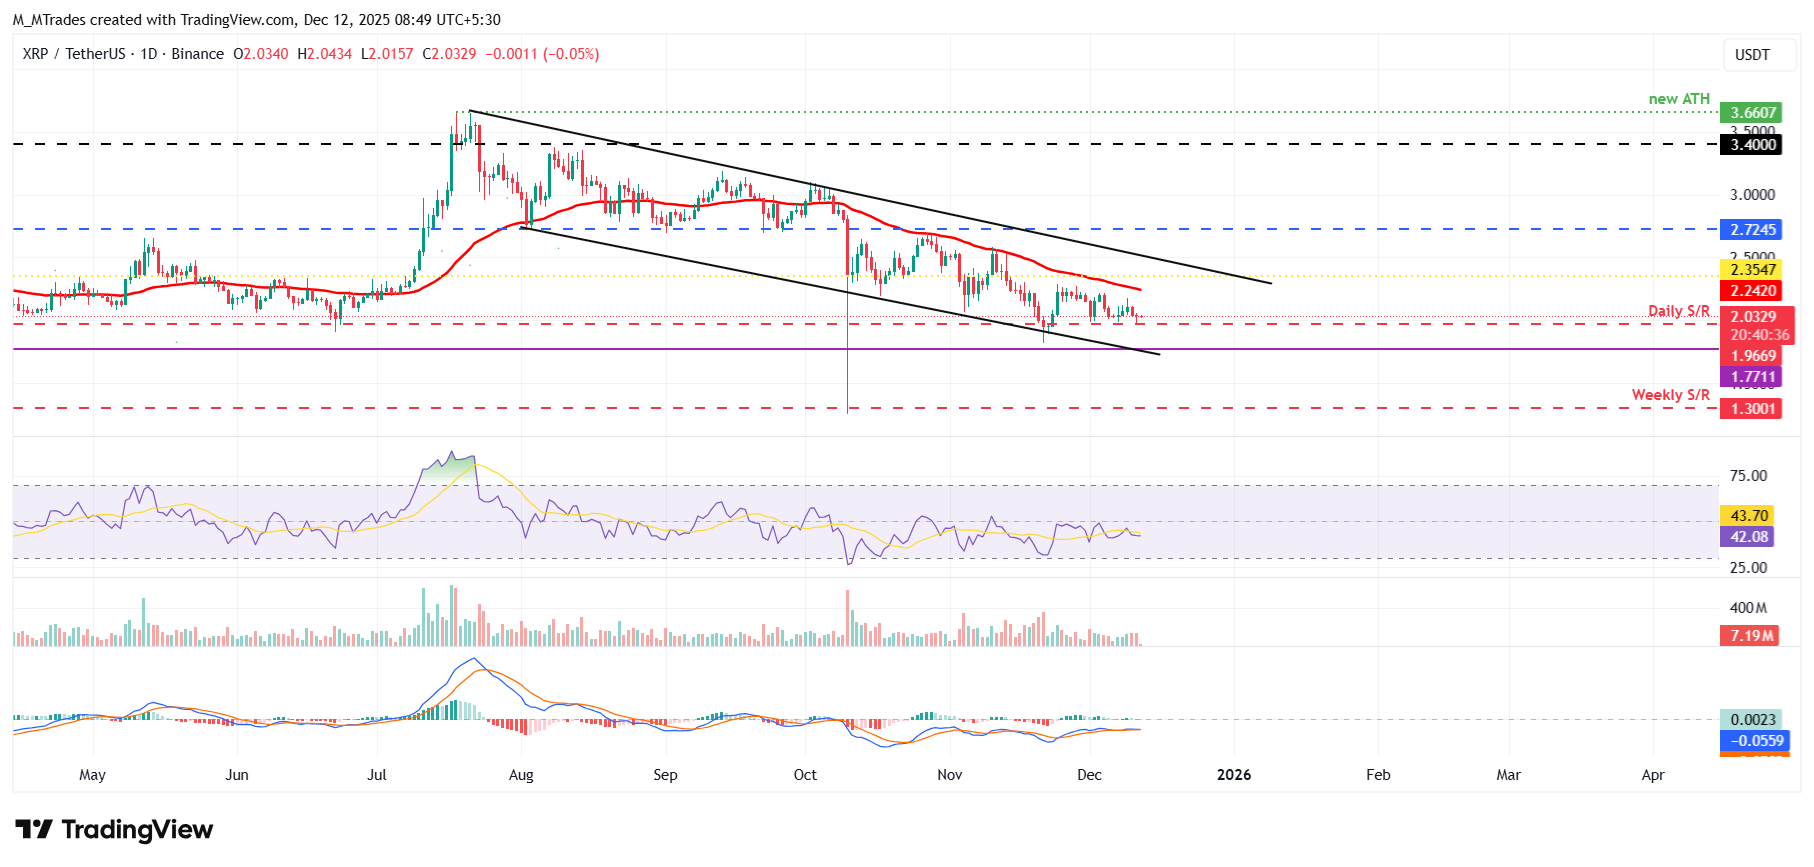
On the other hand, if XRP closes below the daily support at $1.96, it could extend the decline toward the next daily support at $1.77.
Cryptocurrency prices FAQs
Token launches influence demand and adoption among market participants. Listings on crypto exchanges deepen the liquidity for an asset and add new participants to an asset’s network. This is typically bullish for a digital asset.
A hack is an event in which an attacker captures a large volume of the asset from a DeFi bridge or hot wallet of an exchange or any other crypto platform via exploits, bugs or other methods. The exploiter then transfers these tokens out of the exchange platforms to ultimately sell or swap the assets for other cryptocurrencies or stablecoins. Such events often involve an en masse panic triggering a sell-off in the affected assets.
Macroeconomic events like the US Federal Reserve’s decision on interest rates influence crypto assets mainly through the direct impact they have on the US Dollar. An increase in interest rate typically negatively influences Bitcoin and altcoin prices, and vice versa. If the US Dollar index declines, risk assets and associated leverage for trading gets cheaper, in turn driving crypto prices higher.
Halvings are typically considered bullish events as they slash the block reward in half for miners, constricting the supply of the asset. At consistent demand if the supply reduces, the asset’s price climbs.

FXStreet
超過一百萬用戶依賴 FXStreet 獲取即時市場數據、圖表工具、專家洞見與外匯新聞。其全面的經濟日曆與教育網路研討會協助交易者保持資訊領先、做出審慎決策。FXStreet 擁有約 60 人的團隊,分布於巴塞隆納總部及全球各地。
Read More


