
Trade The World
Top 3 Price Prediction: Bitcoin, Ethereum, Ripple – BTC, ETH and XRP could face volatility as markets eye Powell at Jackson Hole
作者 Manish Chhetri
發布日期: 22 Aug 2025 | 修改日期: 22 Aug 2025


POPULAR ARTICLES

Top 3 cryptocurrencies Bitcoin (BTC), Ethereum (ETH), and Ripple (XRP) are trading cautiously at the time of writing on Friday as traders brace for potential volatility ahead of Federal Reserve (Fed) Chair Jerome Powell’s speech at the Jackson Hole Symposium.
- Bitcoin price consolidates above key support at $111,980 as traders await the next directional move.
- Ethereum holds support near $4,232, with eyes on a potential recovery.
- Ripple’s XRP stabilizes around $2.88 on Friday after rejection from the 50-day EMA at $2.93 the previous day.
Top 3 cryptocurrencies Bitcoin (BTC), Ethereum (ETH), and Ripple (XRP) are trading cautiously at the time of writing on Friday as traders brace for potential volatility ahead of Federal Reserve (Fed) Chair Jerome Powell’s speech at the Jackson Hole Symposium. BTC holds above its key support, ETH shows some signs of resilience, while XRP struggles near its 50-day Exponential Moving Average. The crypto market’s next move may hinge on Powell’s guidance on the Fed’s policy outlook.
Bitcoin consolidates above its key support at $111,980
BTC price has fallen over 8% from its record of $124,747 on August 14, closing below an ascending trendline drawn by connecting multiple lows since early April this week, and retested its support level at $111,980 on Thursday. At the time of writing on Friday, it hovers at around $113,432.
If the support at $111,980 holds and BTC recovers and closes above its 50-day EMA at $114,786, it could extend the recovery toward its next daily resistance at $116,000.
However, the Relative Strength Index (RSI) reads 43 below its neutral value of 50, suggesting bearish momentum. For the recovery rally to be sustained, the RSI must move above its neutral value.
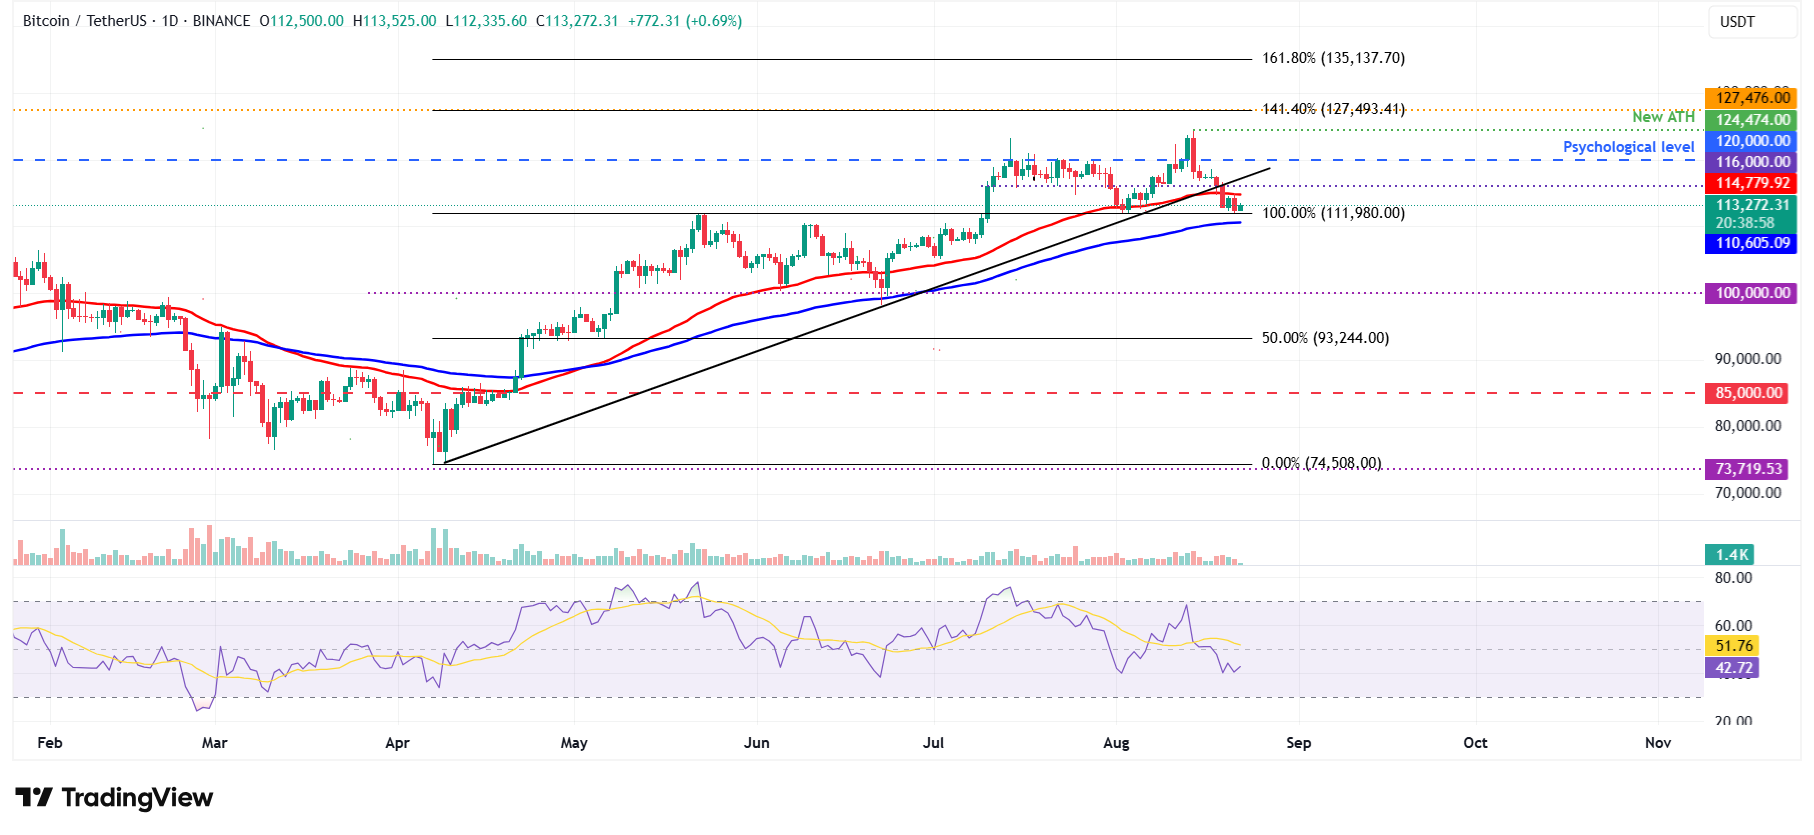
BTC/USDT daily chart
However, if BTC continues its correction and closes below $111,980 support, it could extend the decline toward its 100-day EMA at $110,605.
Ethereum shows some signs of resilience
Ethereum price reached a new yearly high of $4,788 last week on August 14, but failed to continue its upward trend and declined by over 14% in the next five days until Tuesday. However, ETH recovered 6.39% the next day and found support around the daily level of $4,232 on Thursday. At the time of writing on Friday, it trades slightly above at $4,282.
If the daily level at $4,232 continues to hold as support, ETH could extend the recovery toward its next daily resistance at $4,488. A successful close above this level could extend the rally toward its yearly high at $4,788.
The RSI on the daily chart reads 56, rebounding from its neutral level of 50 on Tuesday and points upward, suggesting bullish momentum is gaining traction.
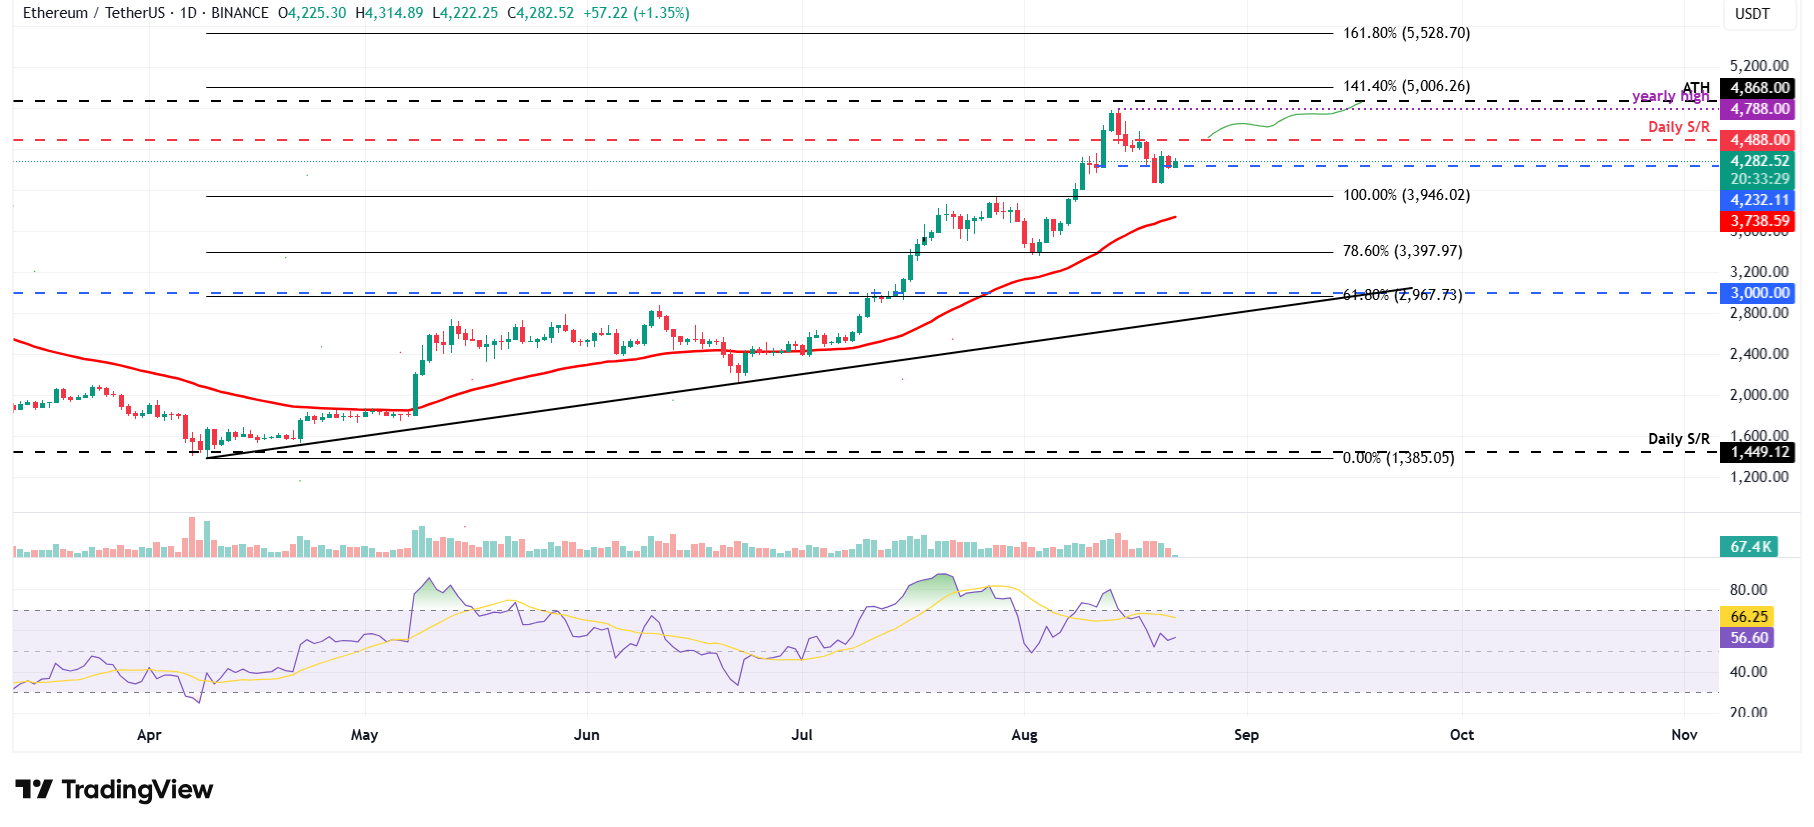
ETH/USDT daily chart
However, if ETH faces a correction and closes below its daily support at $4,232, it could extend the decline toward its next support level at $3,946.
XRP faces rejection from the 50-day EMA
XRP price faced rejection around the daily level of $3.40 on August 14 and declined over 12% in the next five days, closing below the 50-day EMA at $2.93 on Tuesday. XRP recovered slightly on Wednesday, but faced a rejection from its 50-day EMA the next day. At the time of writing on Friday, it continues to trade down at $2.83.
If the 50-day EMA at $2.93 continues to hold as resistance, XRP price could extend the decline to retest its key support at $2.72.
The RSI on the daily chart reads 41 below the neutral level of 50, pointing downward, indicating strong bearish momentum. The Moving Average Convergence Divergence (MACD) showed bearish crossover and rising red histogram bars, supporting the bearish thesis.
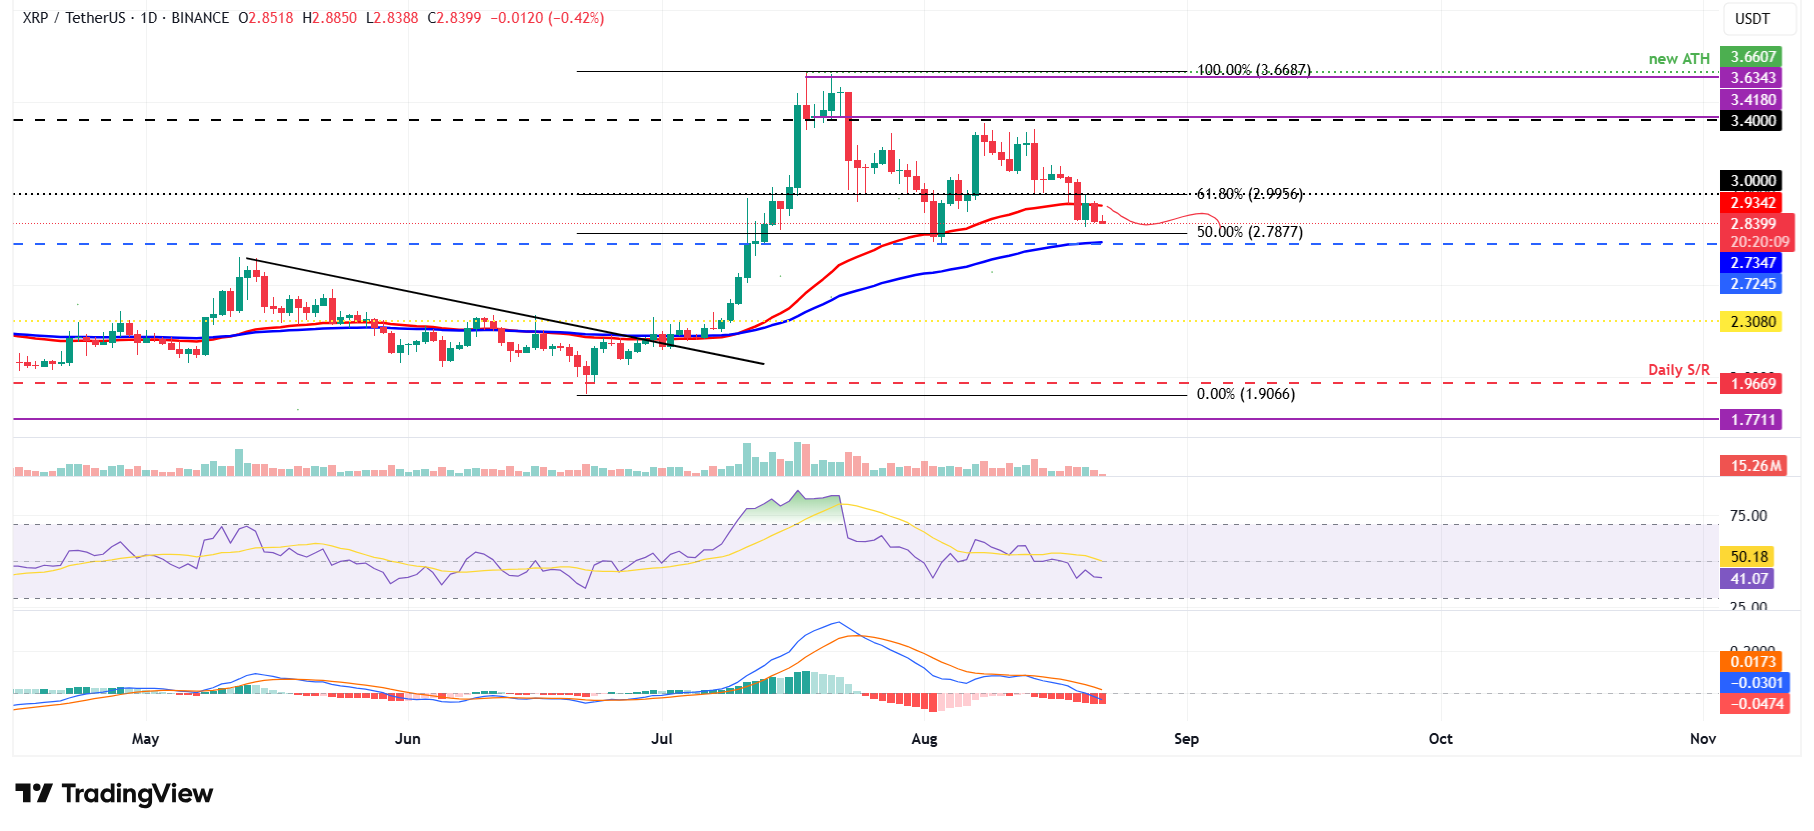
XRP/USDT daily chart
Conversely, if XRP recovers and closes above its 50-day EMA at $2.93, it could extend the recovery toward its daily resistance at $2.99.
Cryptocurrency metrics FAQs
The developer or creator of each cryptocurrency decides on the total number of tokens that can be minted or issued. Only a certain number of these assets can be minted by mining, staking or other mechanisms. This is defined by the algorithm of the underlying blockchain technology. On the other hand, circulating supply can also be decreased via actions such as burning tokens, or mistakenly sending assets to addresses of other incompatible blockchains.
Market capitalization is the result of multiplying the circulating supply of a certain asset by the asset’s current market value.
Trading volume refers to the total number of tokens for a specific asset that has been transacted or exchanged between buyers and sellers within set trading hours, for example, 24 hours. It is used to gauge market sentiment, this metric combines all volumes on centralized exchanges and decentralized exchanges. Increasing trading volume often denotes the demand for a certain asset as more people are buying and selling the cryptocurrency.
Funding rates are a concept designed to encourage traders to take positions and ensure perpetual contract prices match spot markets. It defines a mechanism by exchanges to ensure that future prices and index prices periodic payments regularly converge. When the funding rate is positive, the price of the perpetual contract is higher than the mark price. This means traders who are bullish and have opened long positions pay traders who are in short positions. On the other hand, a negative funding rate means perpetual prices are below the mark price, and hence traders with short positions pay traders who have opened long positions.

FXStreet
超過一百萬用戶依賴 FXStreet 獲取即時市場數據、圖表工具、專家洞見與外匯新聞。其全面的經濟日曆與教育網路研討會協助交易者保持資訊領先、做出審慎決策。FXStreet 擁有約 60 人的團隊,分布於巴塞隆納總部及全球各地。
Read More


