
Trade The World
Top Crypto Gainers: Aster, Starknet, and Zcash recovery at risk
作者 Vishal Dixit
發布日期: 17 Nov 2025 | 修改日期: 17 Nov 2025


POPULAR ARTICLES

Aster (ASTER), Starknet (STRK), and Zcash (ZEC) trade in the green over the last 24 hours, struggling to retain gains while the broader cryptocurrency market is in the red.
- Aster takes a breather after a 14% surge on Sunday near the $1.29 resistance level.
- Starknet rallies for the fifth consecutive day, extending its breakout of a consolidation range above $0.20.
- Zcash risks a double top reversal within a rising channel pattern, as the RSI indicator displays a bearish divergence.
Aster (ASTER), Starknet (STRK), and Zcash (ZEC) trade in the green over the last 24 hours, struggling to retain gains while the broader cryptocurrency market is in the red. The technical outlook of Aster and Zcash remains mixed as bearish potential arises, while Starknet could extend its consolidation range breakout rally.
Aster struggles at key resistance
Aster is down roughly 3% at press time on Monday, after a 14% surge from the previous day. The Binance-backed perpetuals-focused Decentralized Exchange (DEX) risks a steeper correction as it reverses from the $1.29 resistance level, marked by the October 14 low.
The immediate support for ASTER is the 200-period Exponential Moving Average (EMA) on the 4-hour chart at $1.19, followed by the 50-period EMA at $1.12. If these crucial moving averages fail to absorb the pullback, it could threaten the $1.00 psychological level.
The Relative Strength Index (RSI) at 65 edges lower from the overbought zone as buying pressure wanes amid the intraday pullback. If the RSI falls below the midline, it could signal a renewed selling pressure.
Still, the Moving Average Convergence Divergence (MACD) maintains a steady uprise with the signal line indicating strong bullish momentum. If the blue line crosses below the red line, it would indicate a fresh bearish momentum cycle, triggering a sell signal.
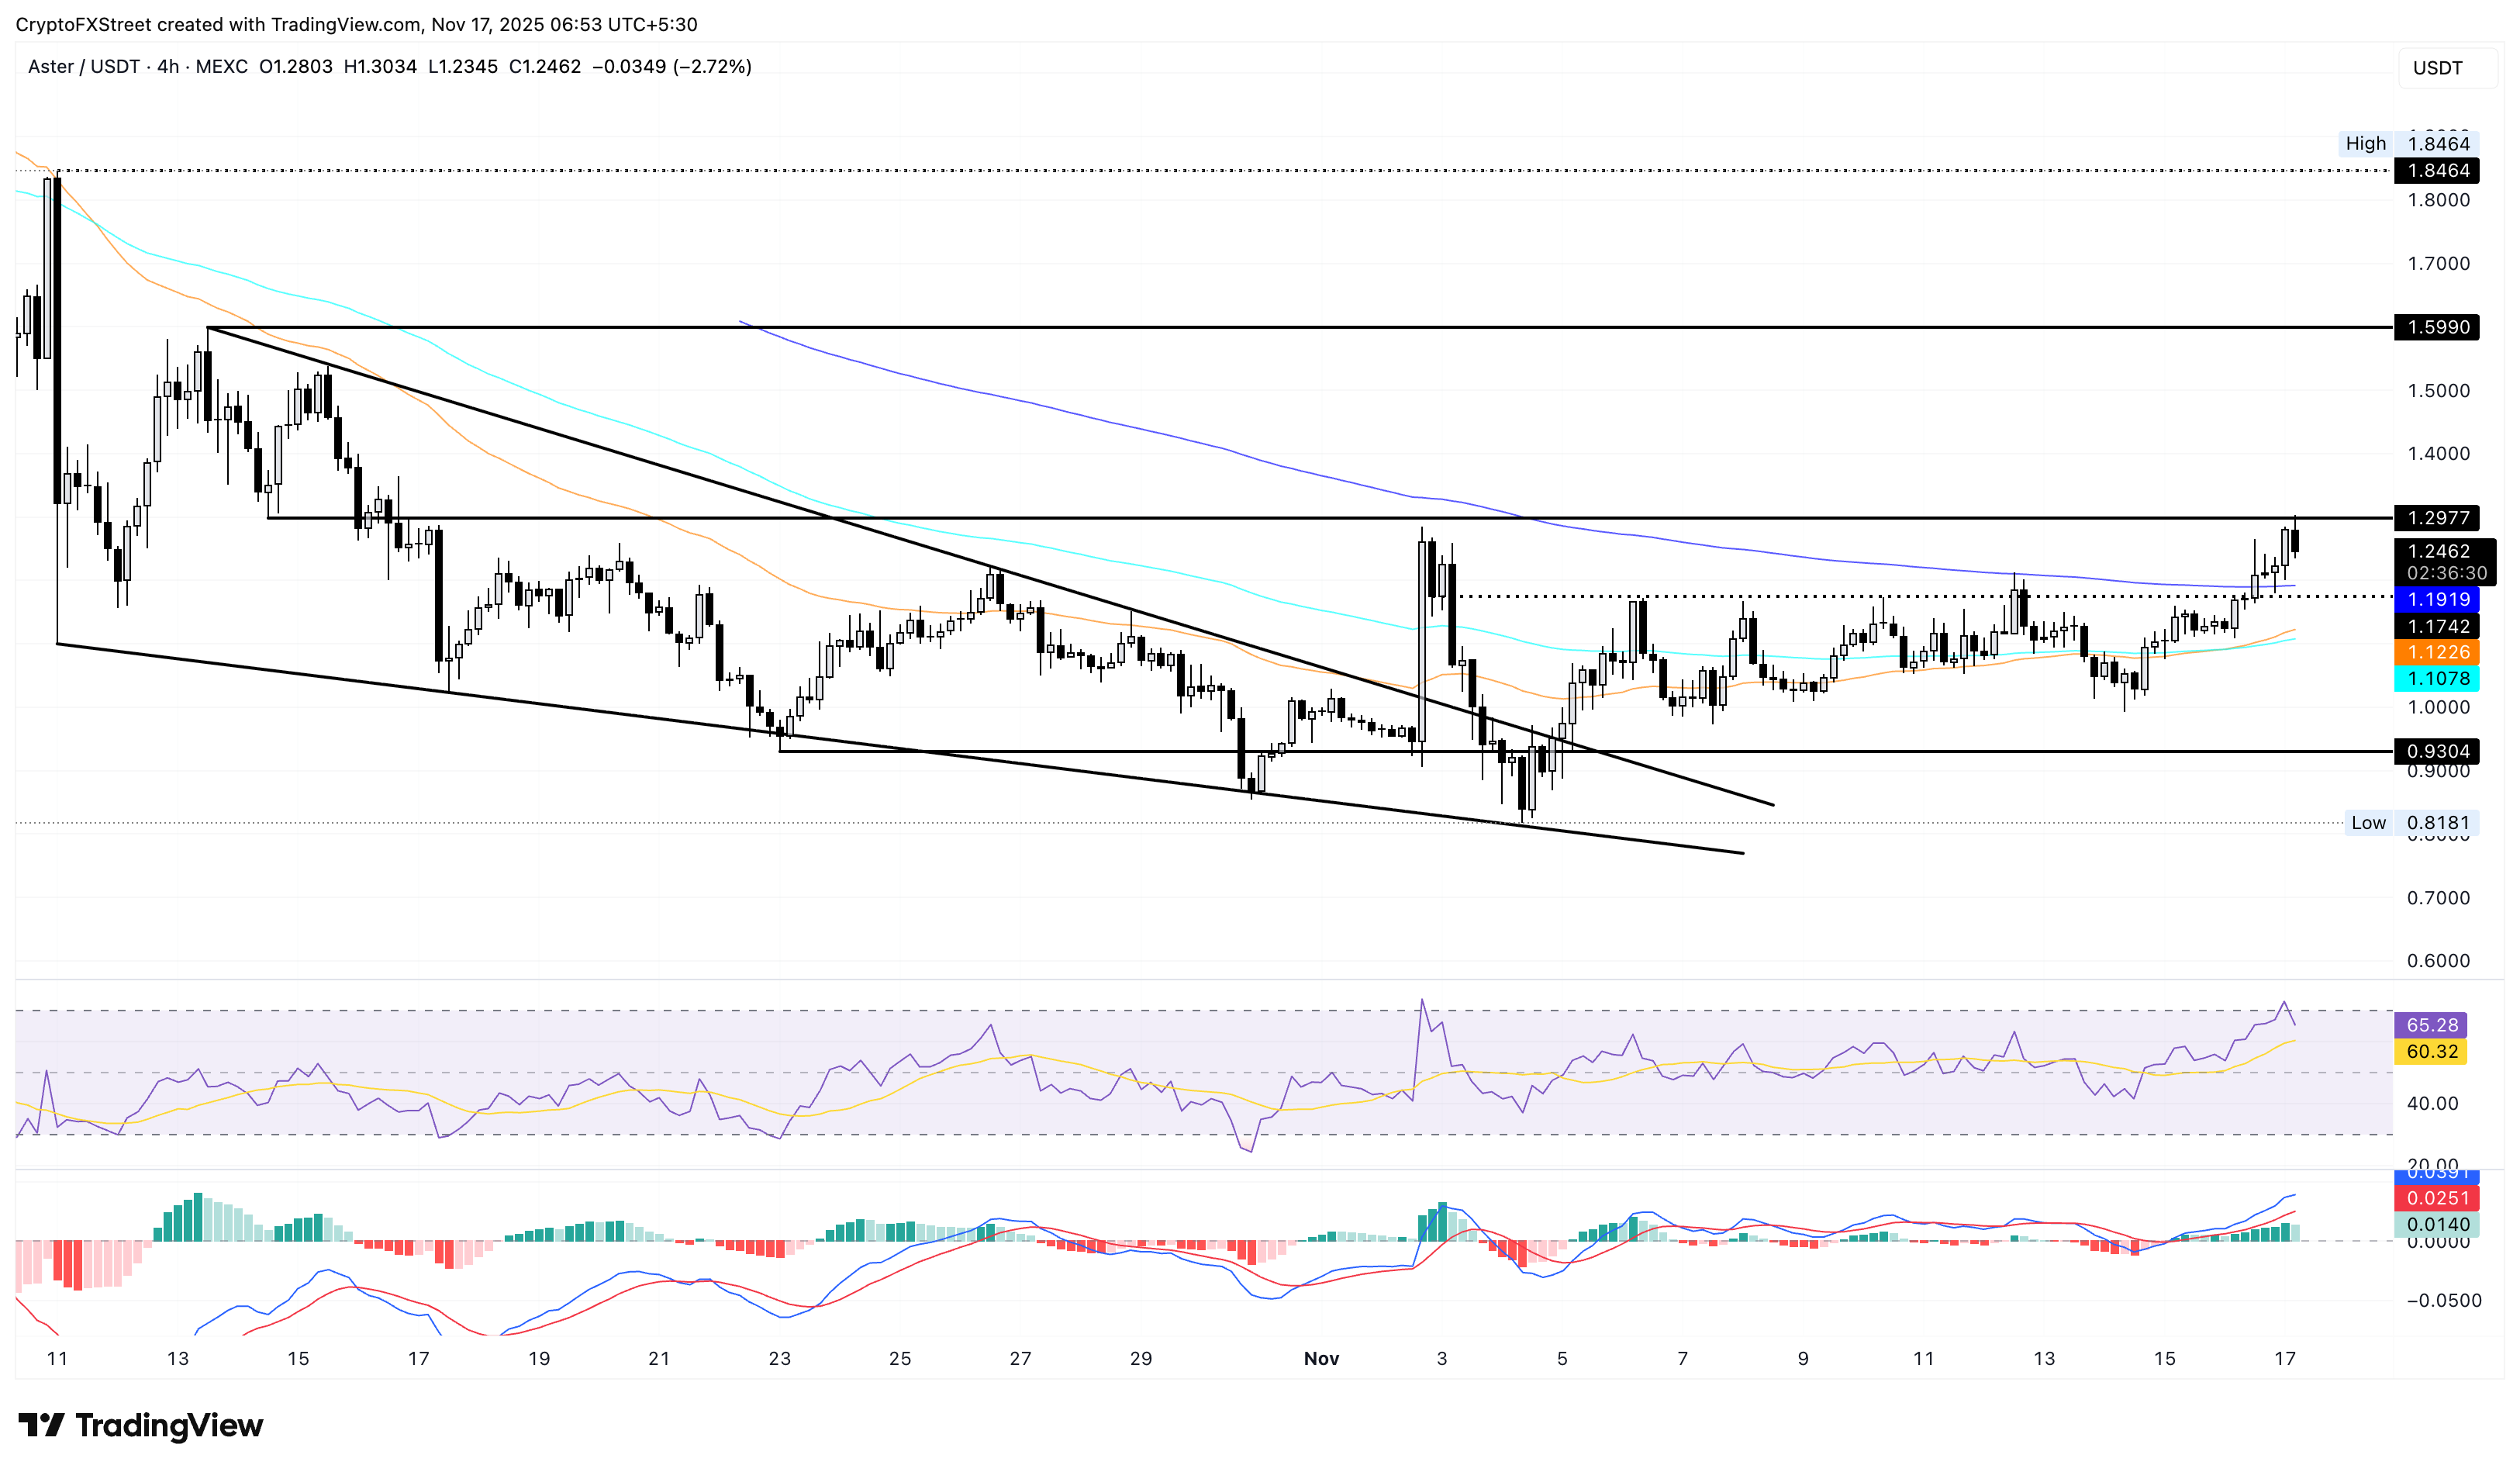
If ASTER breaks above $1.29, the uptrend could target the October 13 high at $1.59.
Starknet extends the rally
Starknet edges higher by 7% at the time of writing on Monday, marking its fifth consecutive bullish candle. The consolidation breakout, as anticipated previously by FXStreet, aims for the R2 Pivot Point at $0.2777.
The momentum indicators maintain a bullish stand on the daily chart as the RSI at 74 rises into the overbought zone. Meanwhile, the MACD and signal line continue to extend the uptrend, accompanied by successively rising green histogram bars, indicating intense bullish momentum.
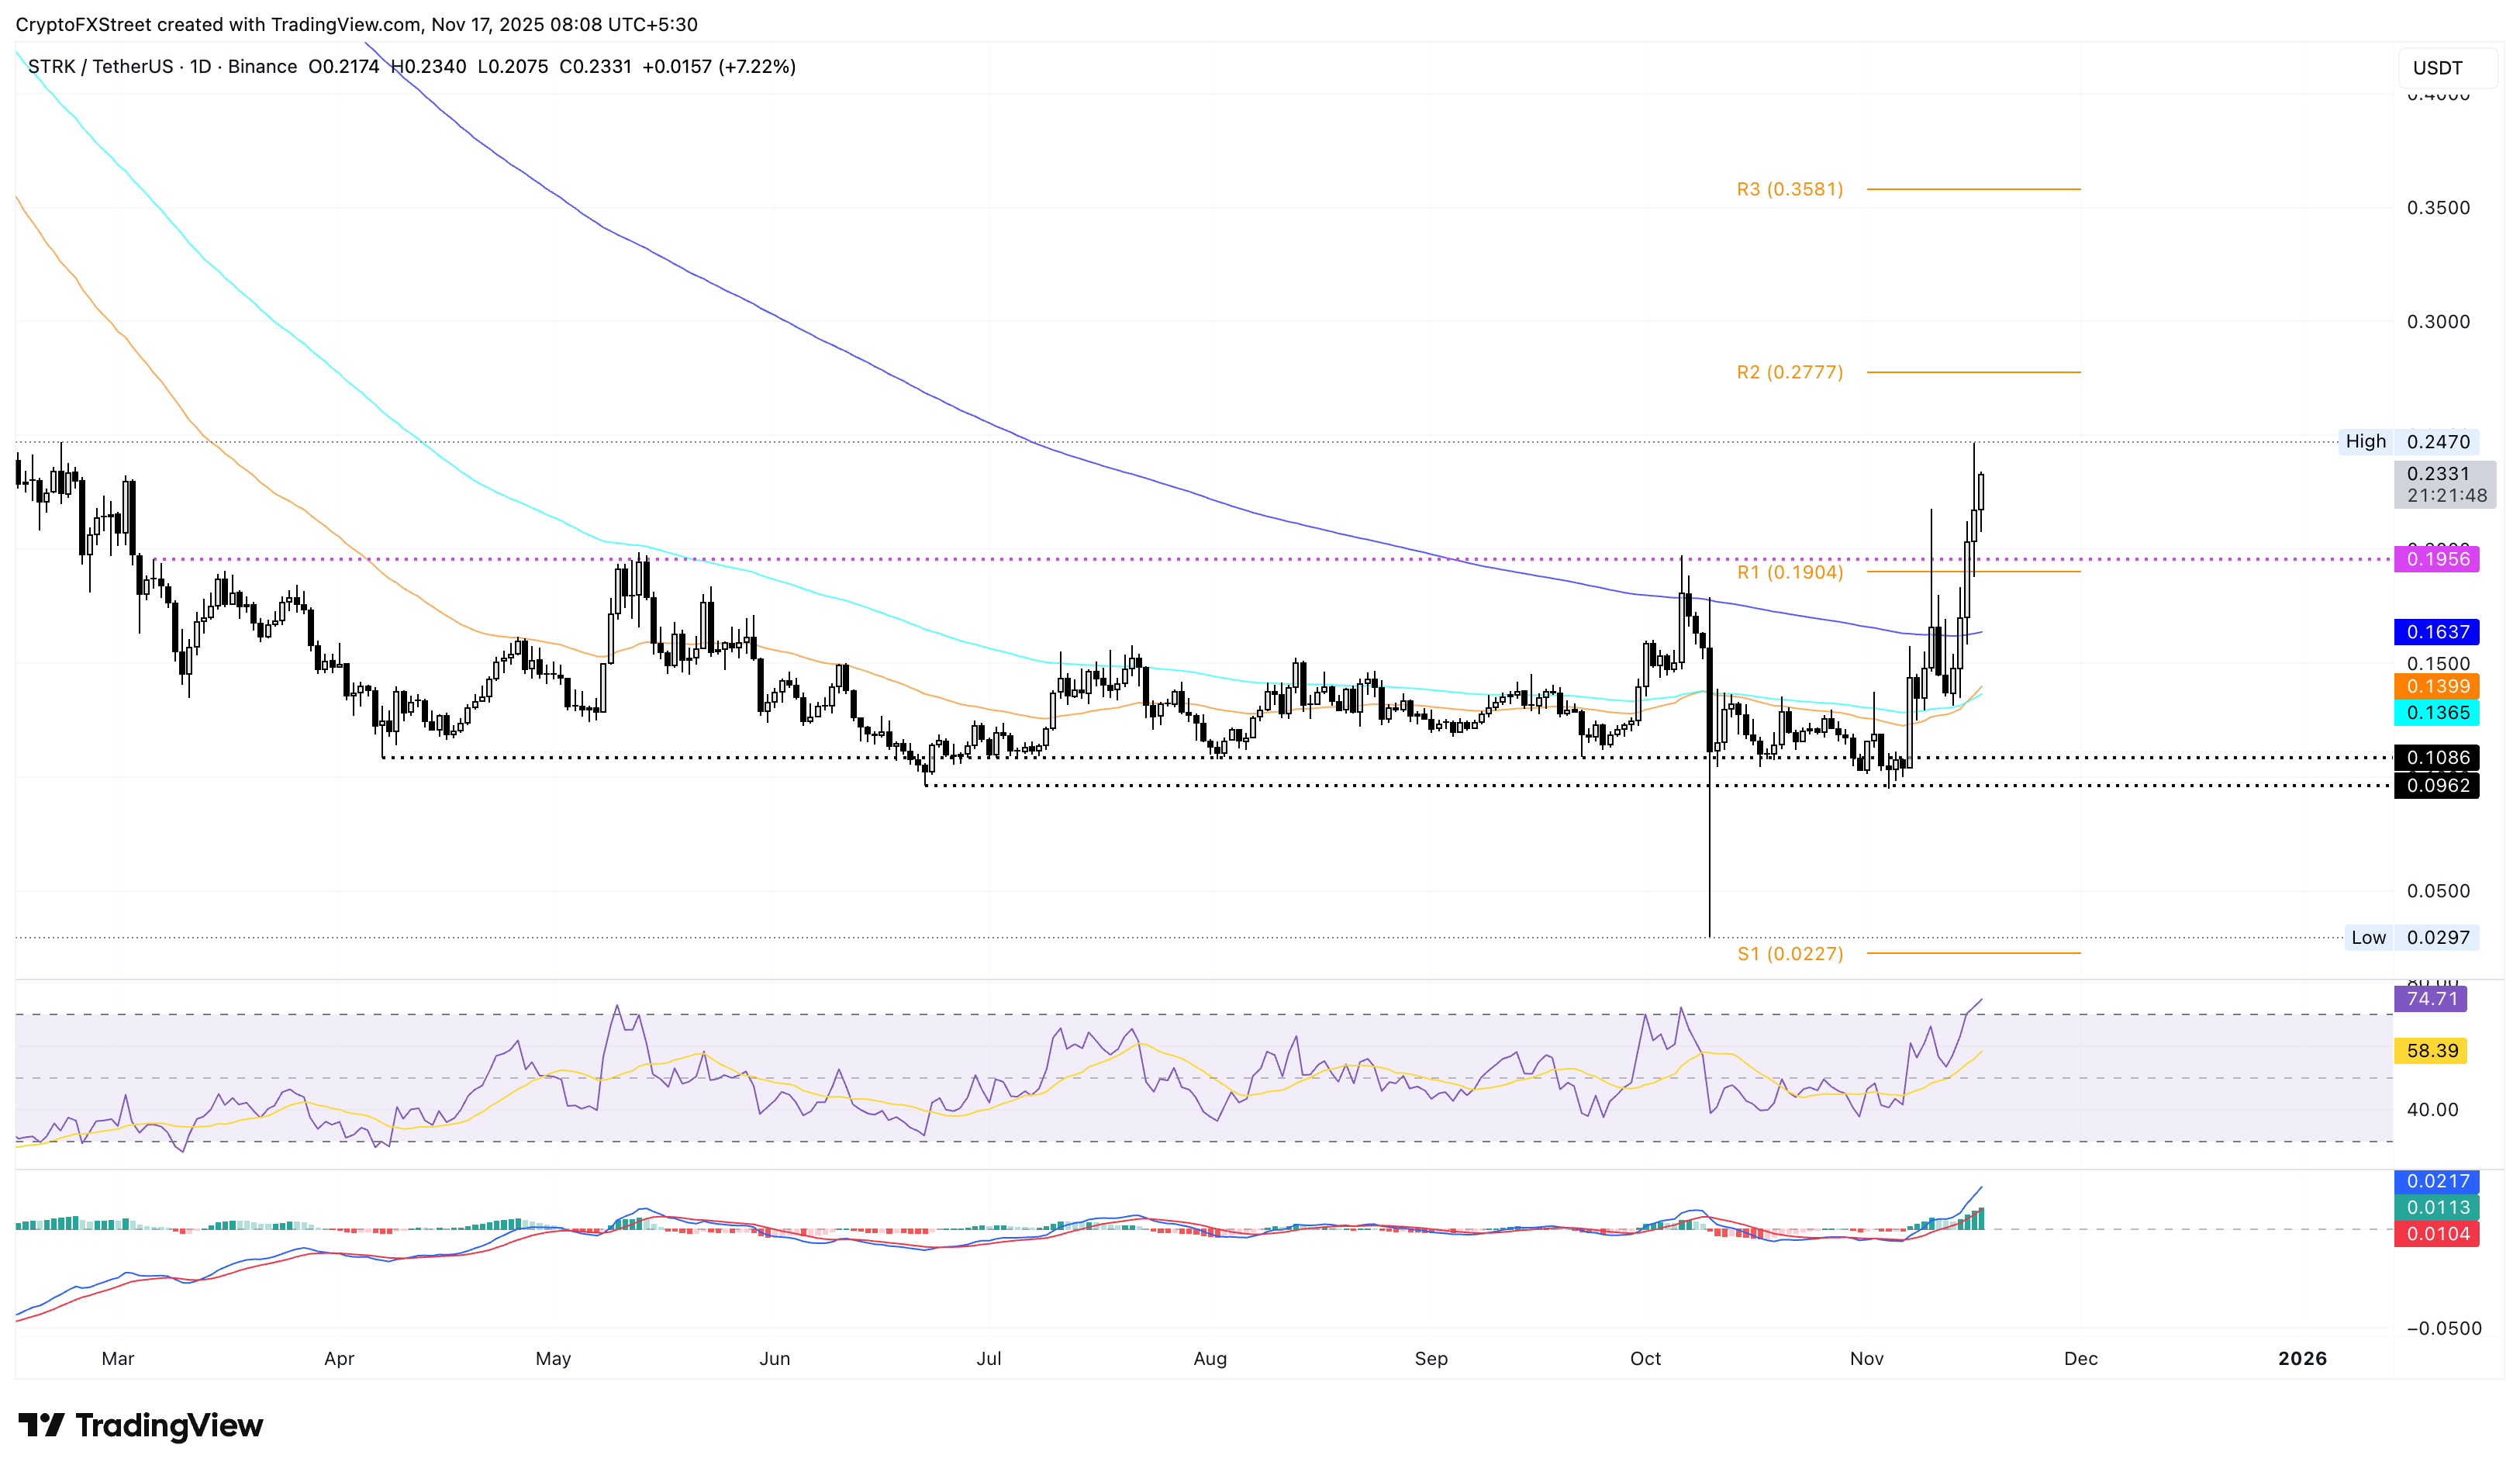
On the flip side, key support for Starknet remains the R1 Pivot Point at $0.1904.
Zcash recovery at risk
Zcash trades above $700 by press time on Monday, holding steady for five straight days of uptrend, which marked a bounce back within a larger rising channel pattern. However, the bullish struggle to surpass the $750 high from November 7 signals a potential double-top pattern formation, which could result in a bearish reversal.
In case of a reversal, the privacy coin could test the local support trendline at $512, followed by the November 12 low at $424.
Corroborating the downside risk, the steady decline in RSI while Zcash recovers flashes a bearish divergence. Meanwhile, the MACD and signal line hold an uptrend, recovering after a sudden bearish collapse last week.
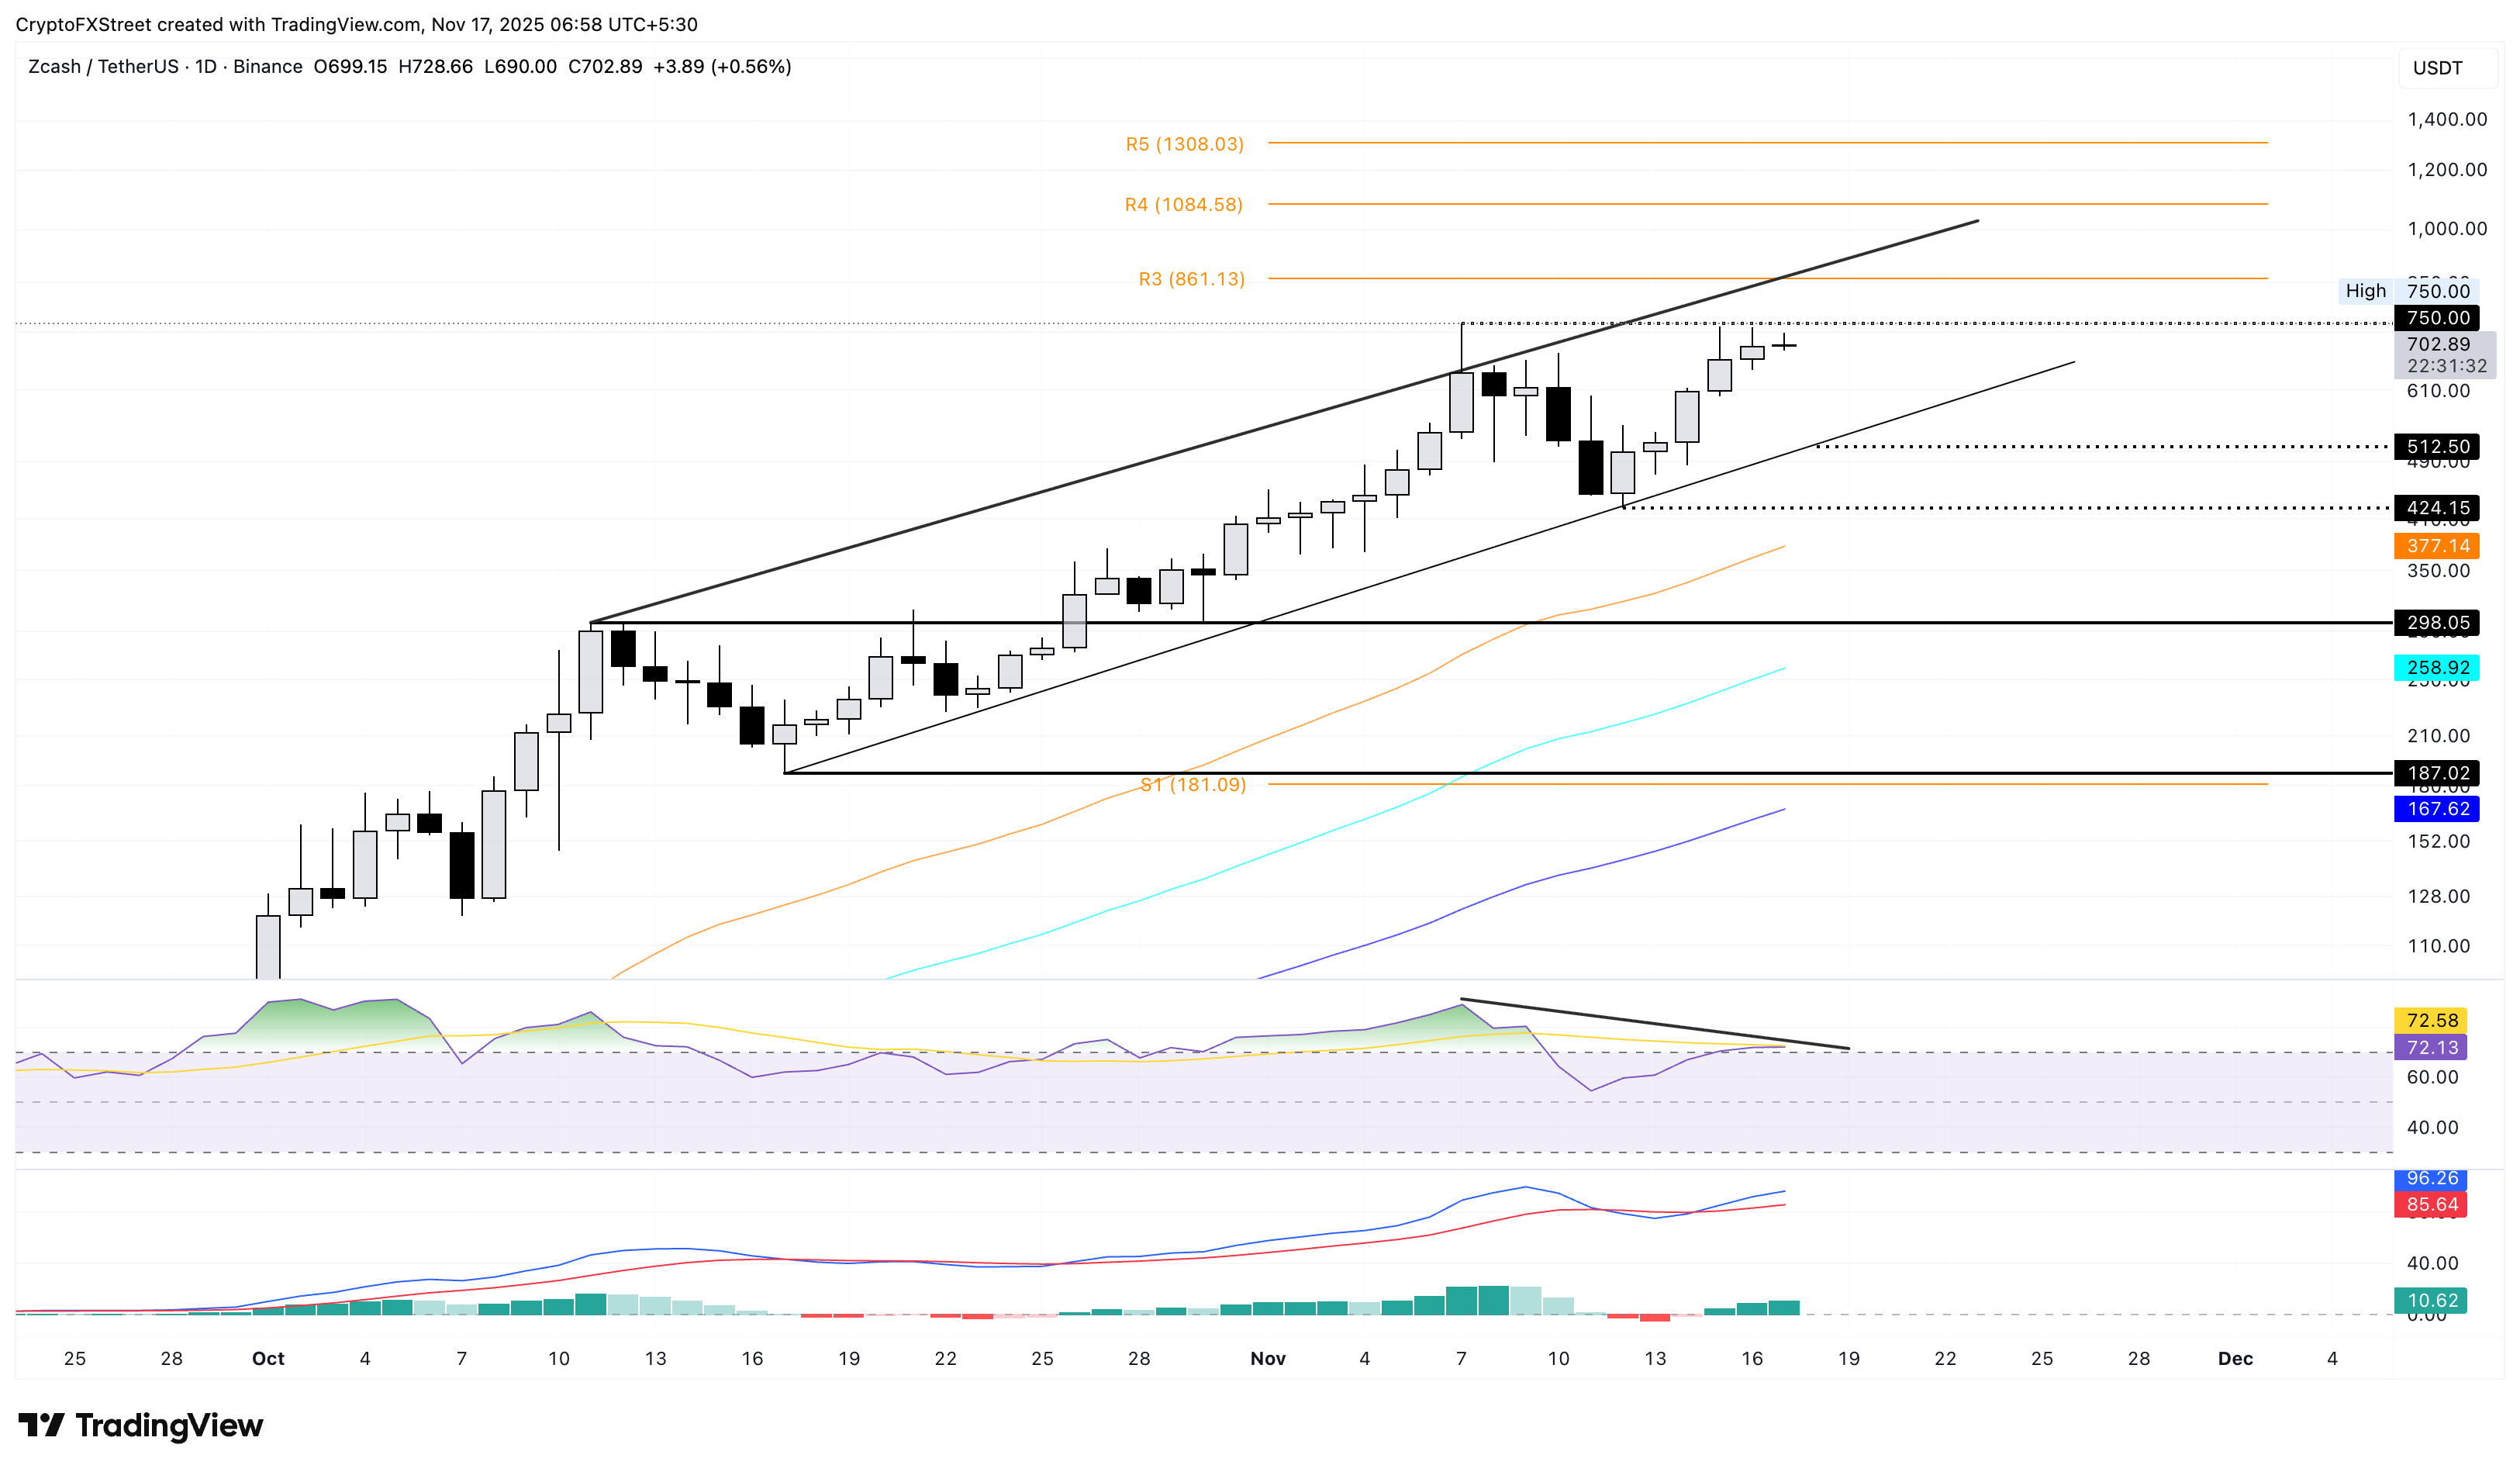
On the upside, the R2 Pivot Point at $861 could serve as $750 breakout target.

FXStreet
超過一百萬用戶依賴 FXStreet 獲取即時市場數據、圖表工具、專家洞見與外匯新聞。其全面的經濟日曆與教育網路研討會協助交易者保持資訊領先、做出審慎決策。FXStreet 擁有約 60 人的團隊,分布於巴塞隆納總部及全球各地。
Read More


