
Trade The World
Tron Price Forecast: TRX technical outlook weakens as spot volume cools
作者 John Isige
發布日期: 9 Oct 2025 | 修改日期: 9 Oct 2025


POPULAR ARTICLES

Tron (TRX) trades above $0.3361 at the time of writing on Thursday, down over 1.70% for the day, reflecting a general cool-down in sentiment across the cryptocurrency market.
- Tron declines alongside other majors in the cryptocurrency market, mirroring risk-off sentiment and profit-taking.
- The TRON Spot Volume Bubble Map shows a cooling phase in spot activity and a potential local bottom.
- TRX daily active addresses remain elevated at around 2.61 million, indicating steady user engagement and demand.
Tron (TRX) trades above $0.3361 at the time of writing on Thursday, down over 1.70% for the day, reflecting a general cool-down in sentiment across the cryptocurrency market.
Assessing Tron’s weakening derivatives and cooling spot volume
Derivatives market data indicate that retail interest in the Tron ecosystem’s native token, TRX, continues to fall alongside the price drop. CoinGlass data shows that the futures Open Interest (OI) has been averaging $404 million after peaking at $638 million in late August.
OI is the notional value of outstanding futures contracts. Therefore, a correction implies that traders are losing confidence in digital assets’ ability to sustain an uptrend. A steady decline in the OI often signals the potential for an extended price correction.
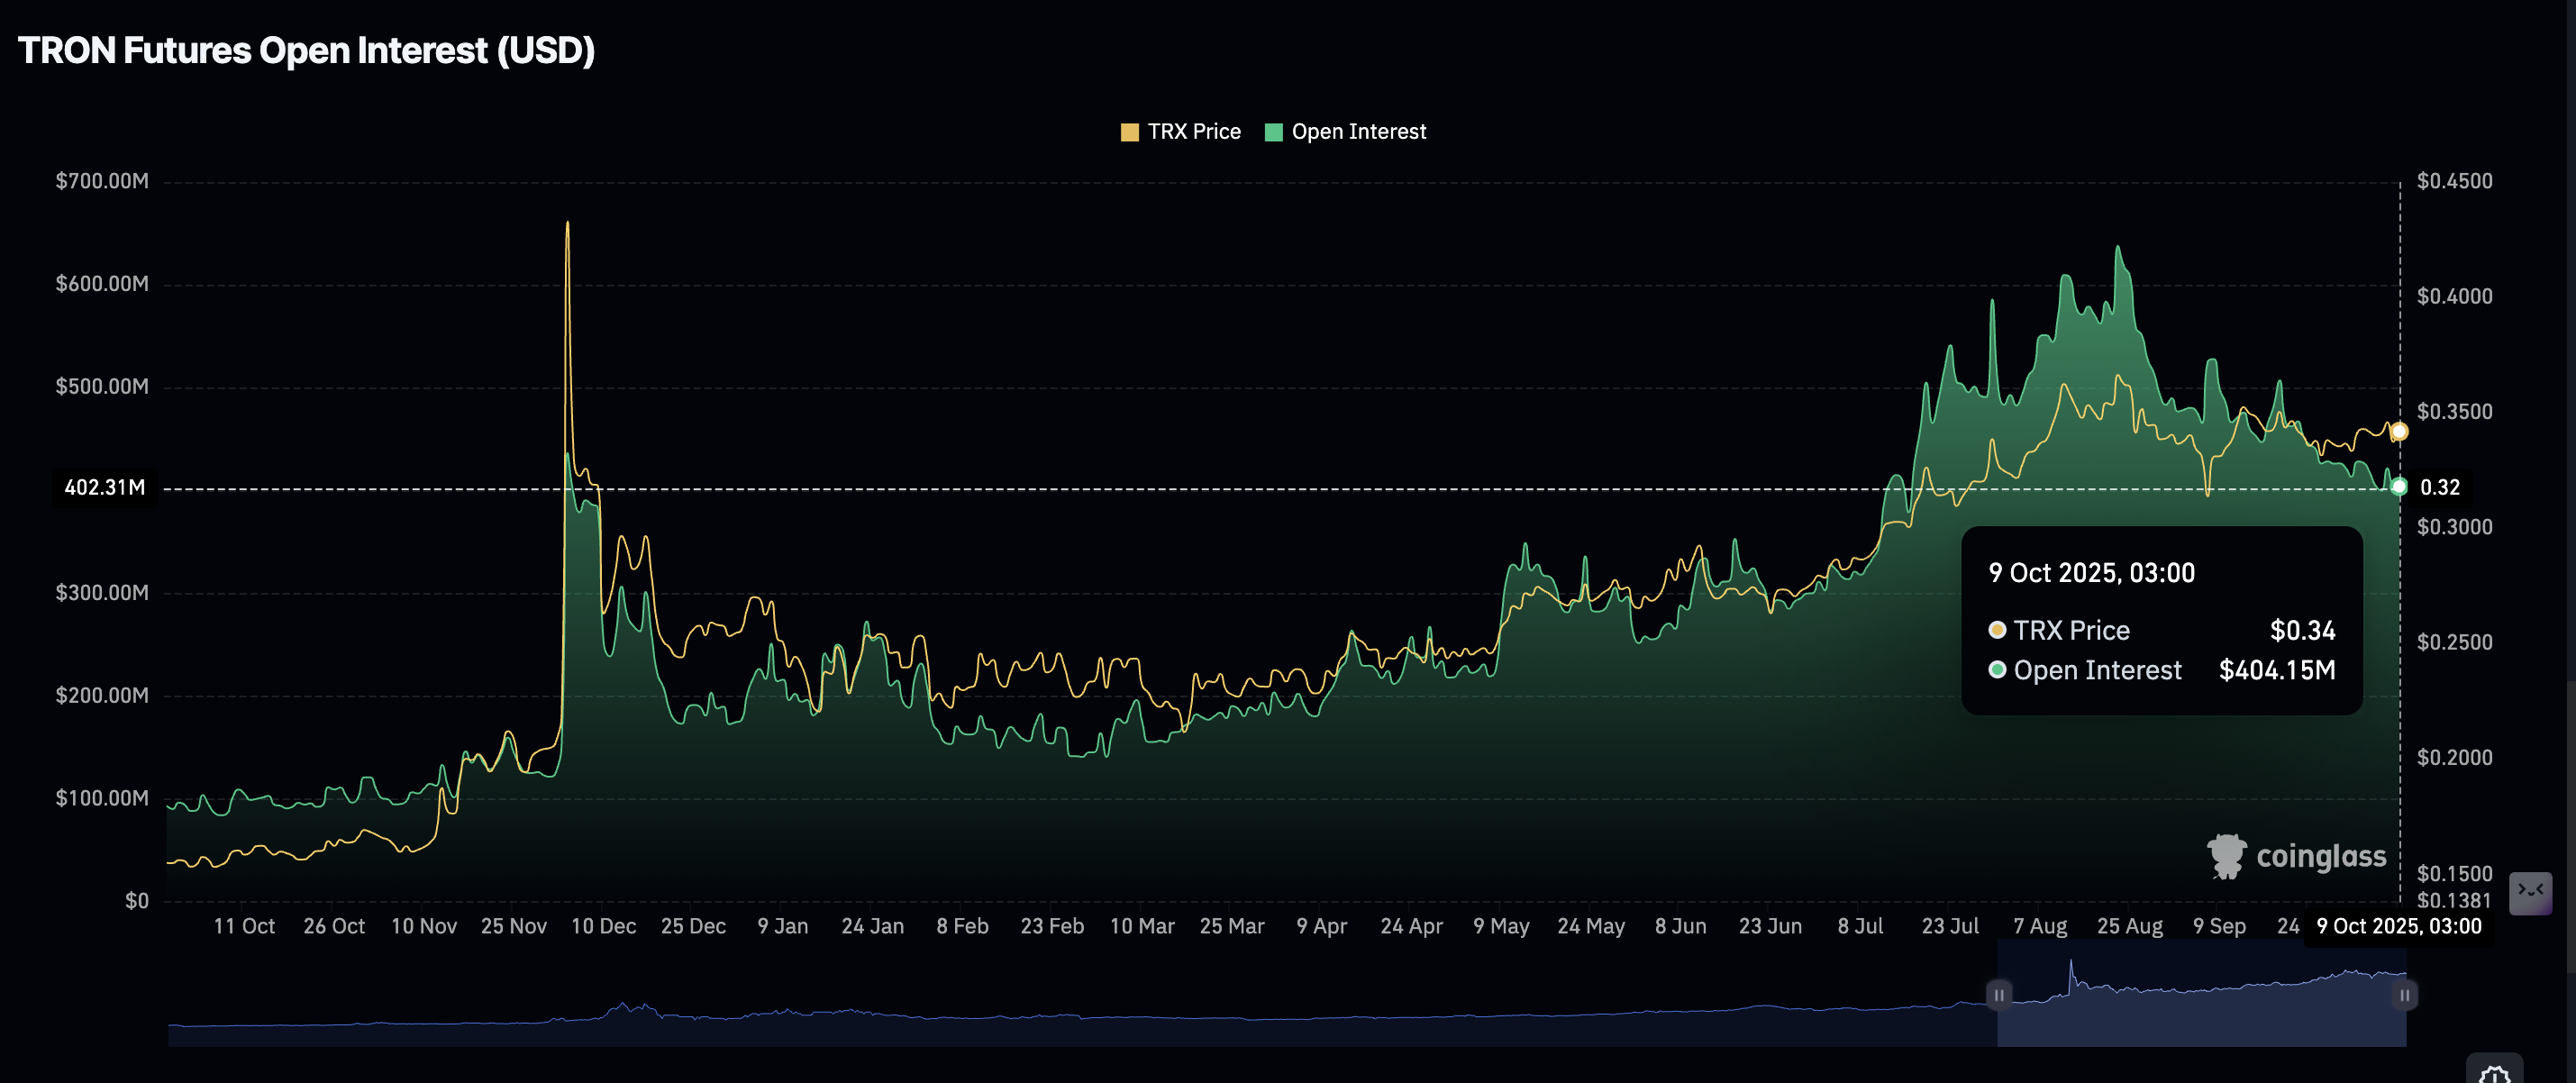
Tron Futures Open Interest | Source: CoinGlass
Tron’s cooling spot volume suggests that the digital asset may be forming a potential local bottom. In other words, selling pressure could be at peak level. According to CryptoQuant, historically, such “cooling” signals are rare – often marking periods when accumulation is taking place ahead of a significant breakout.
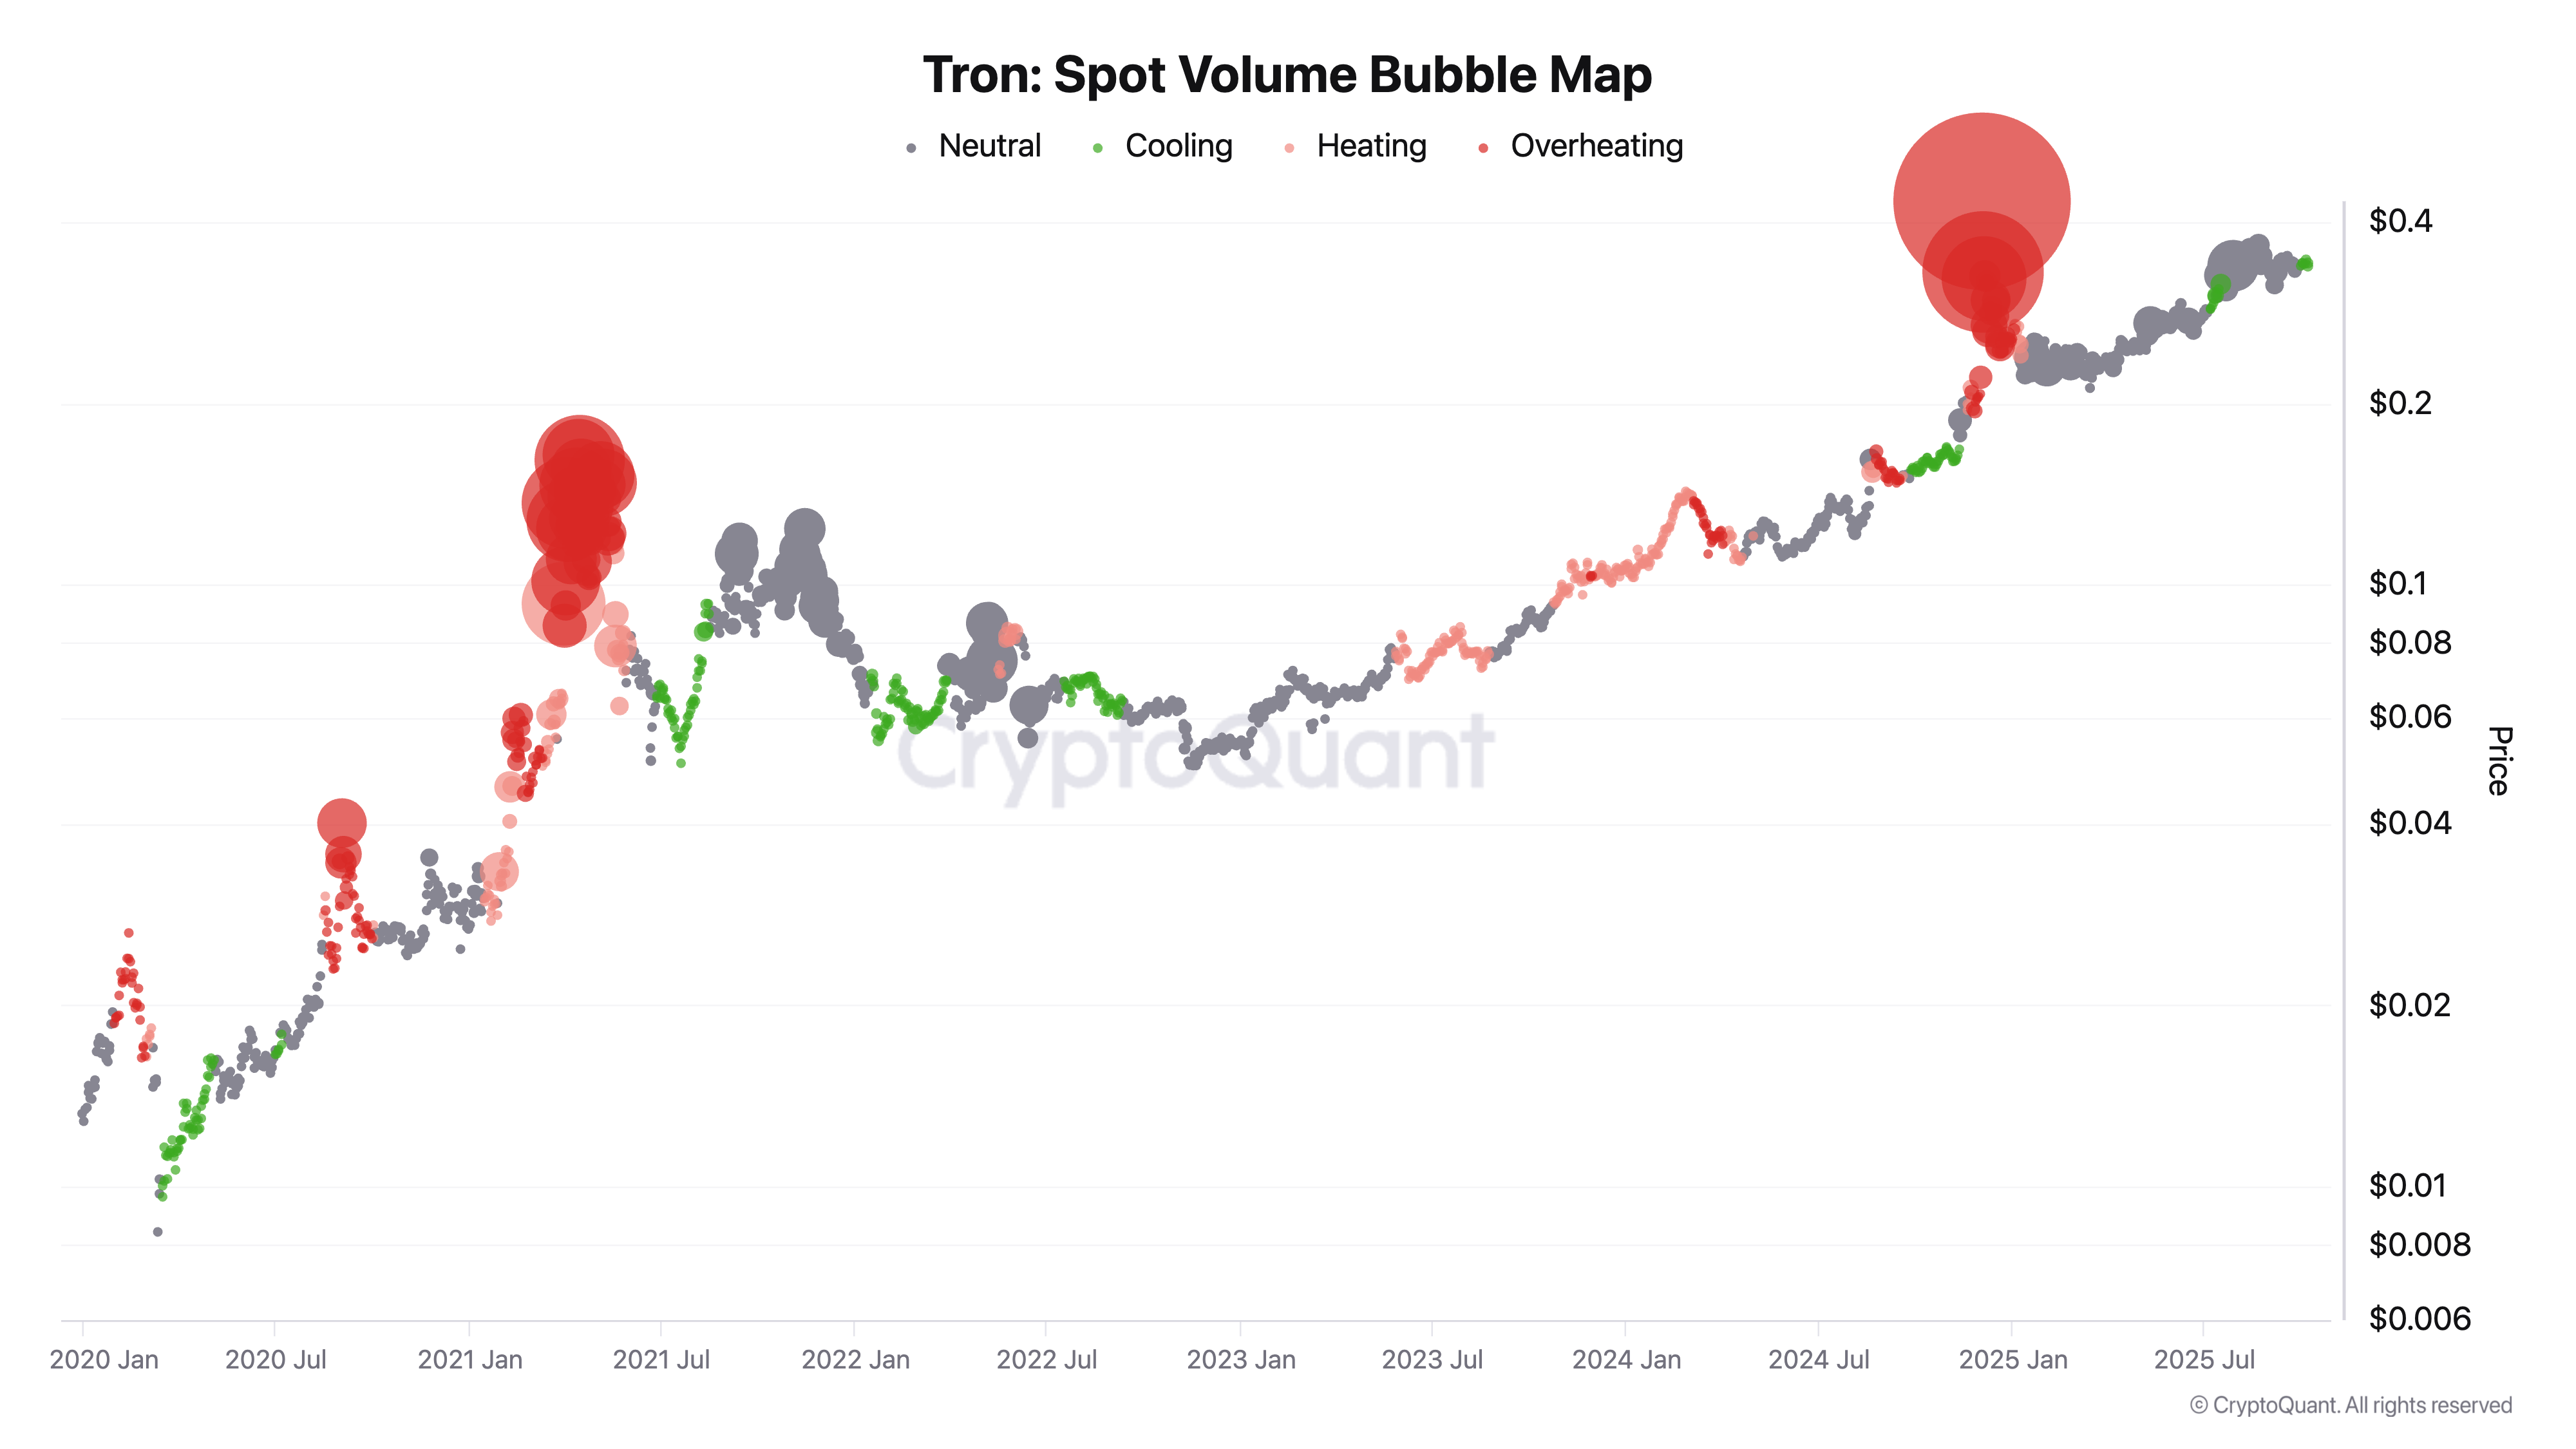
Tron Spot Volume Bubble Map metric | Source: CryptoQuant
Meanwhile, user engagement on the Tron protocol is stable, as evidenced by the Active Addresses metric. Approximately 2.61 million addresses interacted with the Tron blockchain on Thursday, marking a slight improvement from the 2.37 million on Monday.
Active addresses highlighted the level of user interaction with the network by sending or receiving assets. Stability or a steady increase in the metric could imply that demand for the token is significantly high.
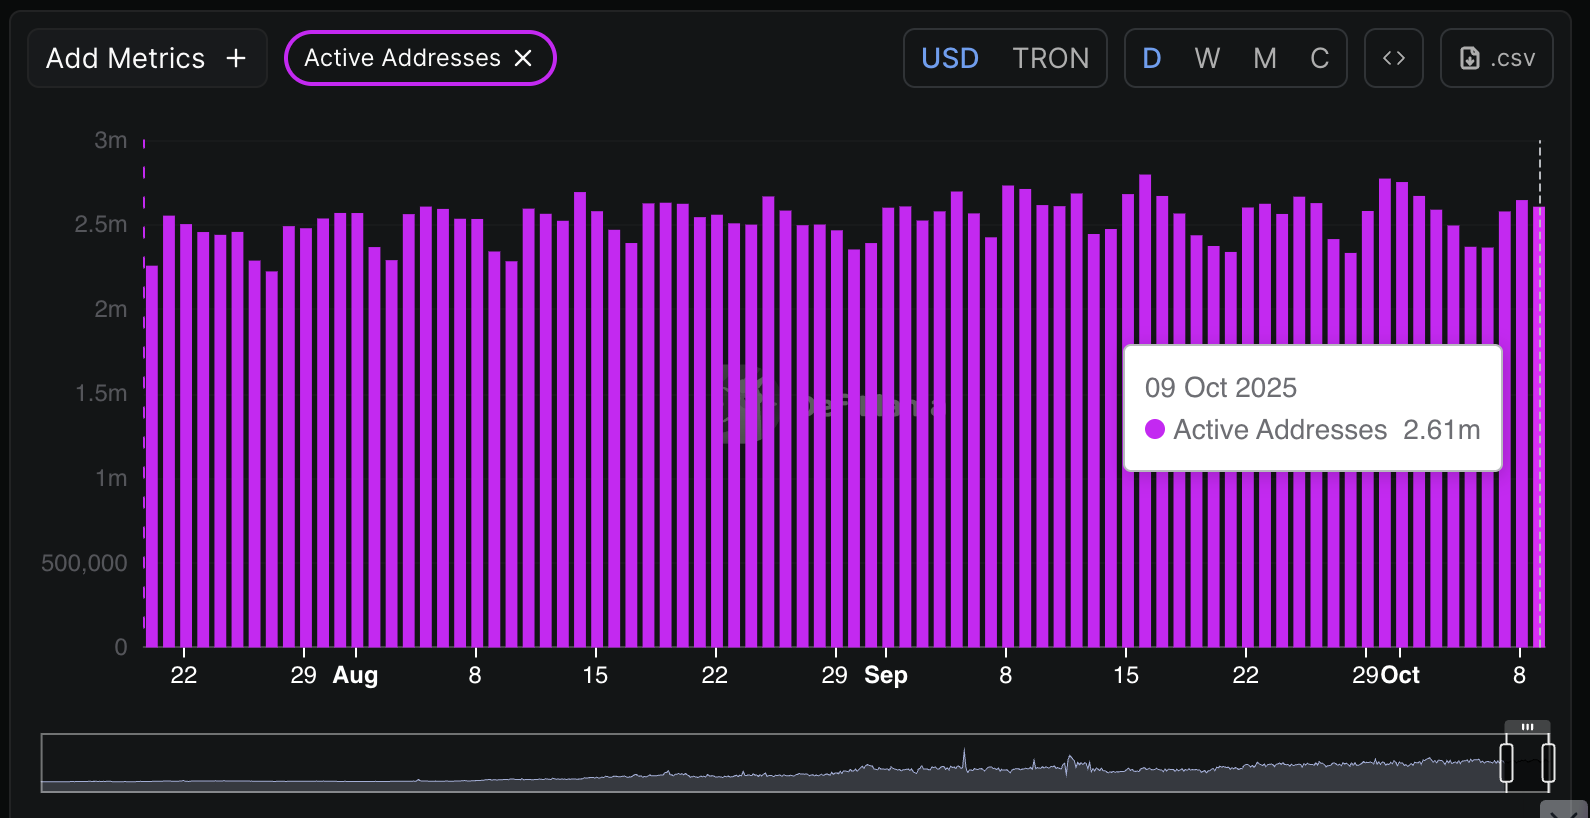
Tron Active Addresses | Source: CoinGlass
Technical outlook: Tron could extend decline
Tron is on the verge of breaching below its short-term support at $0.3361 as investors lean toward risk-off sentiment in the broader cryptocurrency market. Key indicators, such as the Relative Strength Index (RSI) and the Moving Average Convergence Divergence (MACD), reinforce the short-term bearish outlook.
The RSI’s reversal to 38 in the bearish region underscores the strong headwinds, while a sell signal from the MACD indicator encourages investors to reduce their risk exposure.
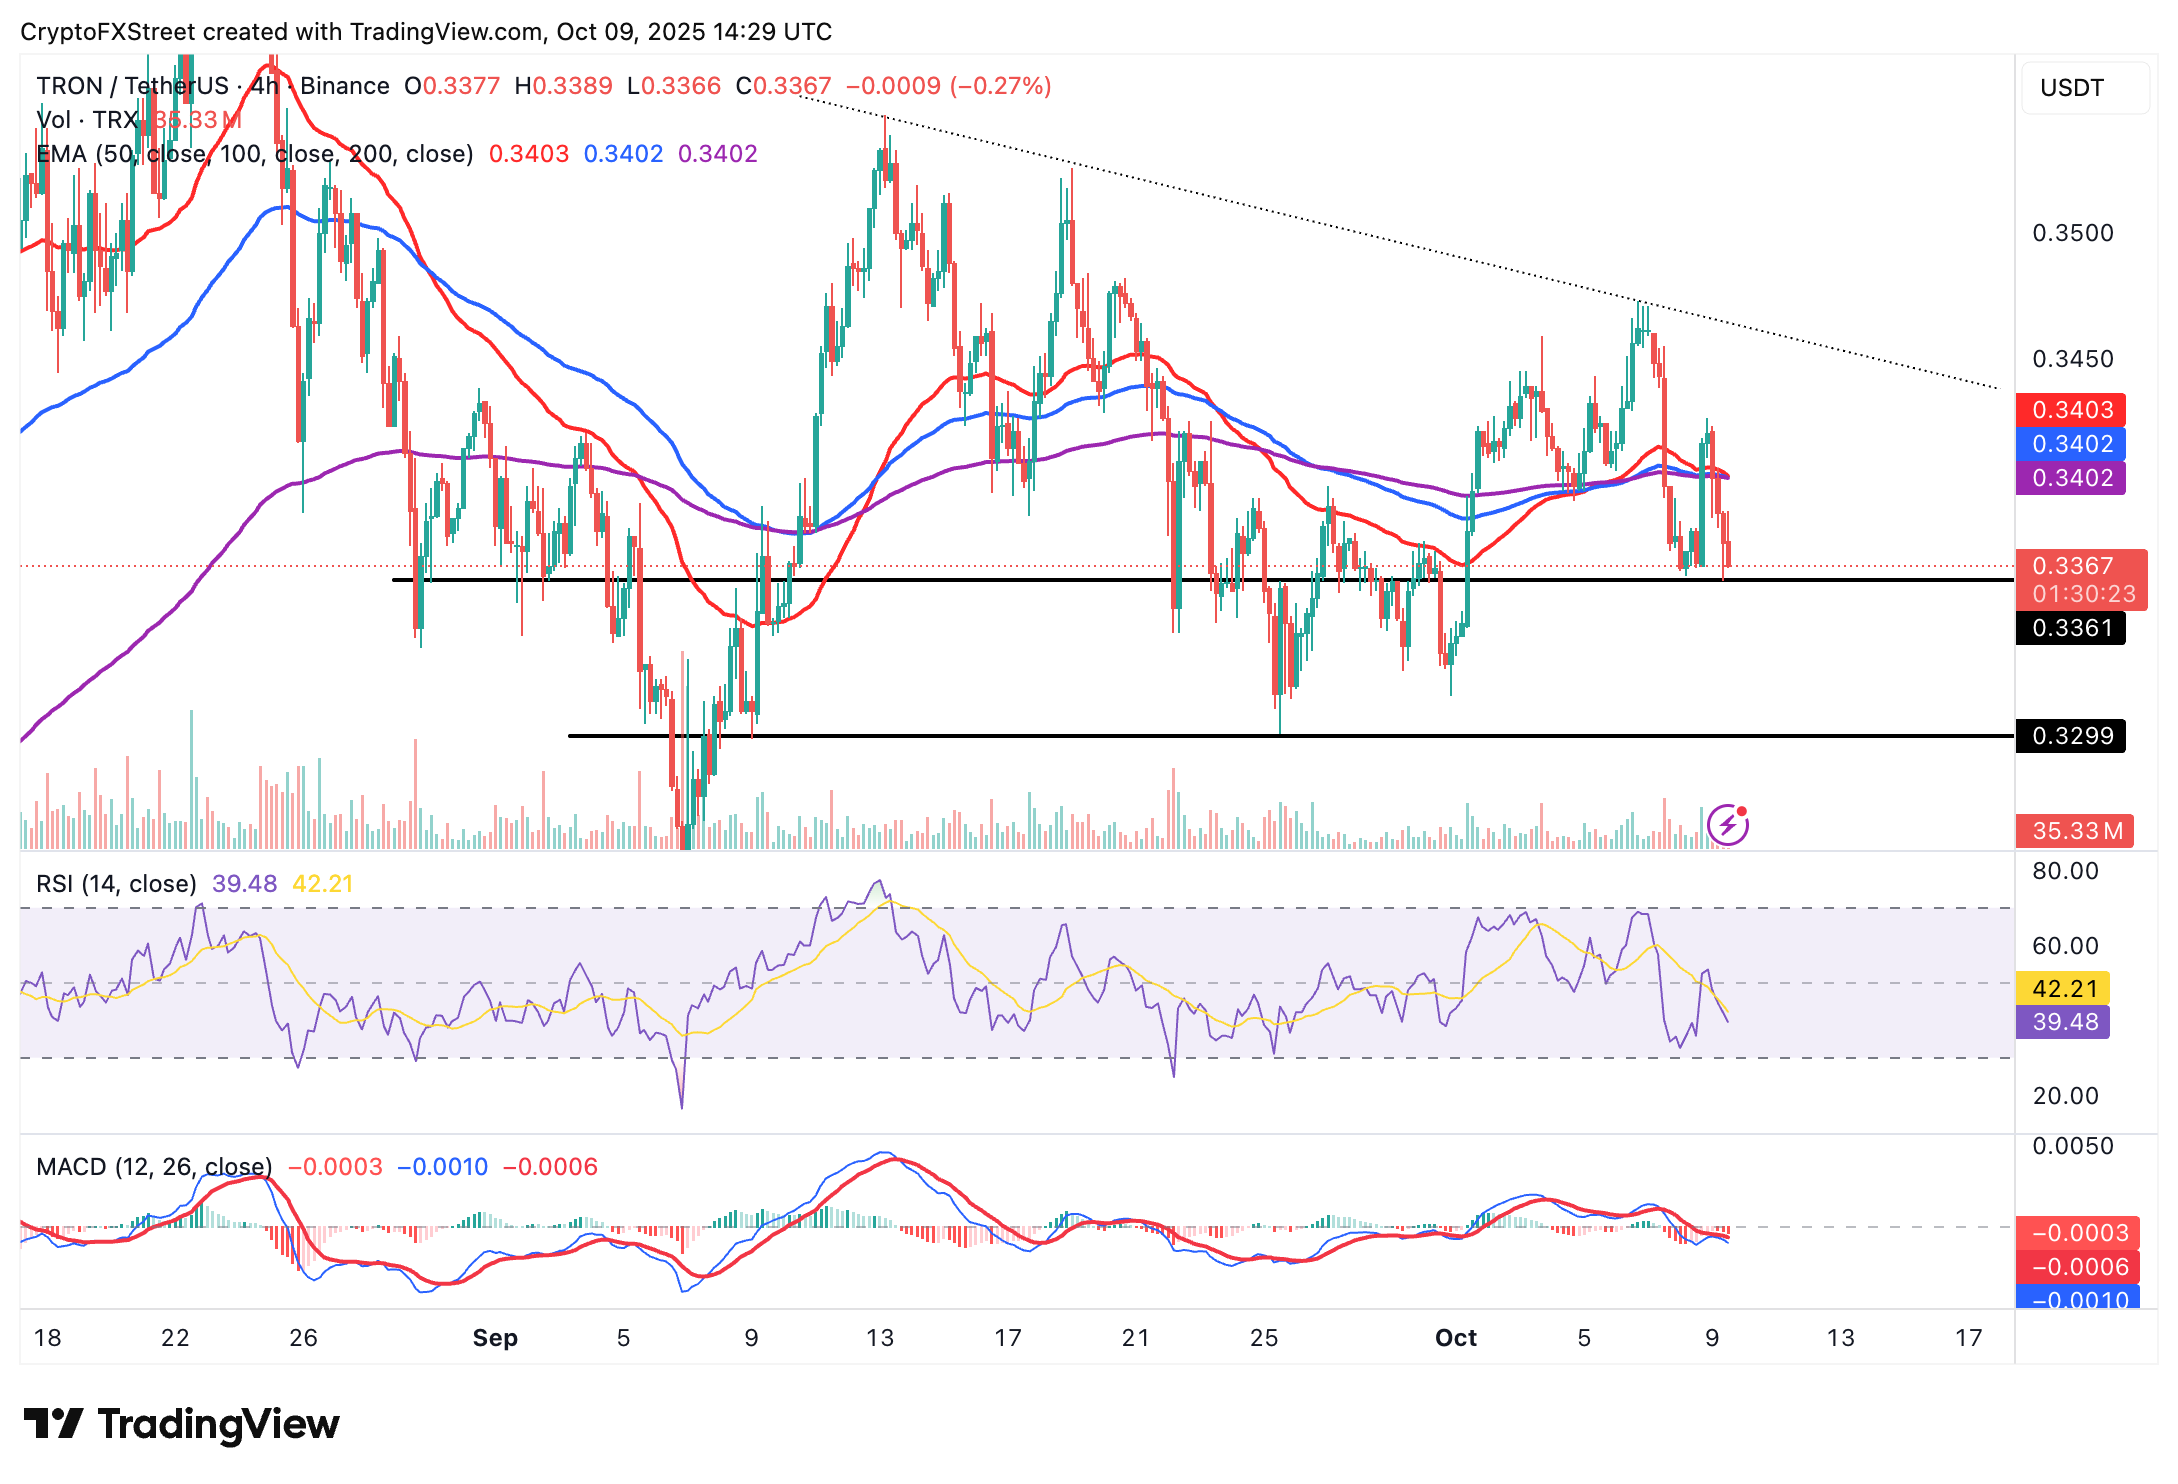
TRX/USDT 4-hour chart
Tron is also holding below key moving averages, including the 50-period Exponential Moving Average (EMA), the 100-period EMA and the 200-period EMA on the 4-hour chart, all of which currently form a confluence of resistance at around $0.3400.
If the down leg extends below the short-term support at $0.3061, it would increase the chances of a major sell-off toward the next key support area at $0.3299. Still, the cooling spot volume could imply that dips become quickly profitable amid knee-jerk recovery price action.
Cryptocurrency metrics FAQs
The developer or creator of each cryptocurrency decides on the total number of tokens that can be minted or issued. Only a certain number of these assets can be minted by mining, staking or other mechanisms. This is defined by the algorithm of the underlying blockchain technology. On the other hand, circulating supply can also be decreased via actions such as burning tokens, or mistakenly sending assets to addresses of other incompatible blockchains.
Market capitalization is the result of multiplying the circulating supply of a certain asset by the asset’s current market value.
Trading volume refers to the total number of tokens for a specific asset that has been transacted or exchanged between buyers and sellers within set trading hours, for example, 24 hours. It is used to gauge market sentiment, this metric combines all volumes on centralized exchanges and decentralized exchanges. Increasing trading volume often denotes the demand for a certain asset as more people are buying and selling the cryptocurrency.
Funding rates are a concept designed to encourage traders to take positions and ensure perpetual contract prices match spot markets. It defines a mechanism by exchanges to ensure that future prices and index prices periodic payments regularly converge. When the funding rate is positive, the price of the perpetual contract is higher than the mark price. This means traders who are bullish and have opened long positions pay traders who are in short positions. On the other hand, a negative funding rate means perpetual prices are below the mark price, and hence traders with short positions pay traders who have opened long positions.

FXStreet
超過一百萬用戶依賴 FXStreet 獲取即時市場數據、圖表工具、專家洞見與外匯新聞。其全面的經濟日曆與教育網路研討會協助交易者保持資訊領先、做出審慎決策。FXStreet 擁有約 60 人的團隊,分布於巴塞隆納總部及全球各地。
Read More


