
Trade The World
USD/CHF Price Forecast: Drifts towards 0.79509 amid growing bearish traction
作者 Guillermo Alcala
發布日期: 15 Sep 2025 | 修改日期: 15 Sep 2025


POPULAR ARTICLES

The US Dollar keeps trading within the last few days’ range against the Swiss Franc, but intra-day technical indicators start showing an incipient bearish momentum as the pair approaches 0.7950 following rejection at 0.7972.The USDollar Index, which measures the value of the US Dollar against the mo
- The US Dollar extends losses after failure at 0.7972, hitting session lows at 0.7953.
- The US Dollar Index is gaining bearish traction after a period of consolidation earlier today.
- The USD/CHF has a key support area between 0.7940 and 0.7950.
The US Dollar keeps trading within the last few days’ range against the Swiss Franc, but intra-day technical indicators start showing an incipient bearish momentum as the pair approaches 0.7950 following rejection at 0.7972.
The USDollar Index, which measures the value of the US Dollar against the most traded currencies, extends losses on Monday, following a period of hesitation, as speculation about a “dovish cut” by the Fed increases.
USD/CHF is trading within a descending wedge
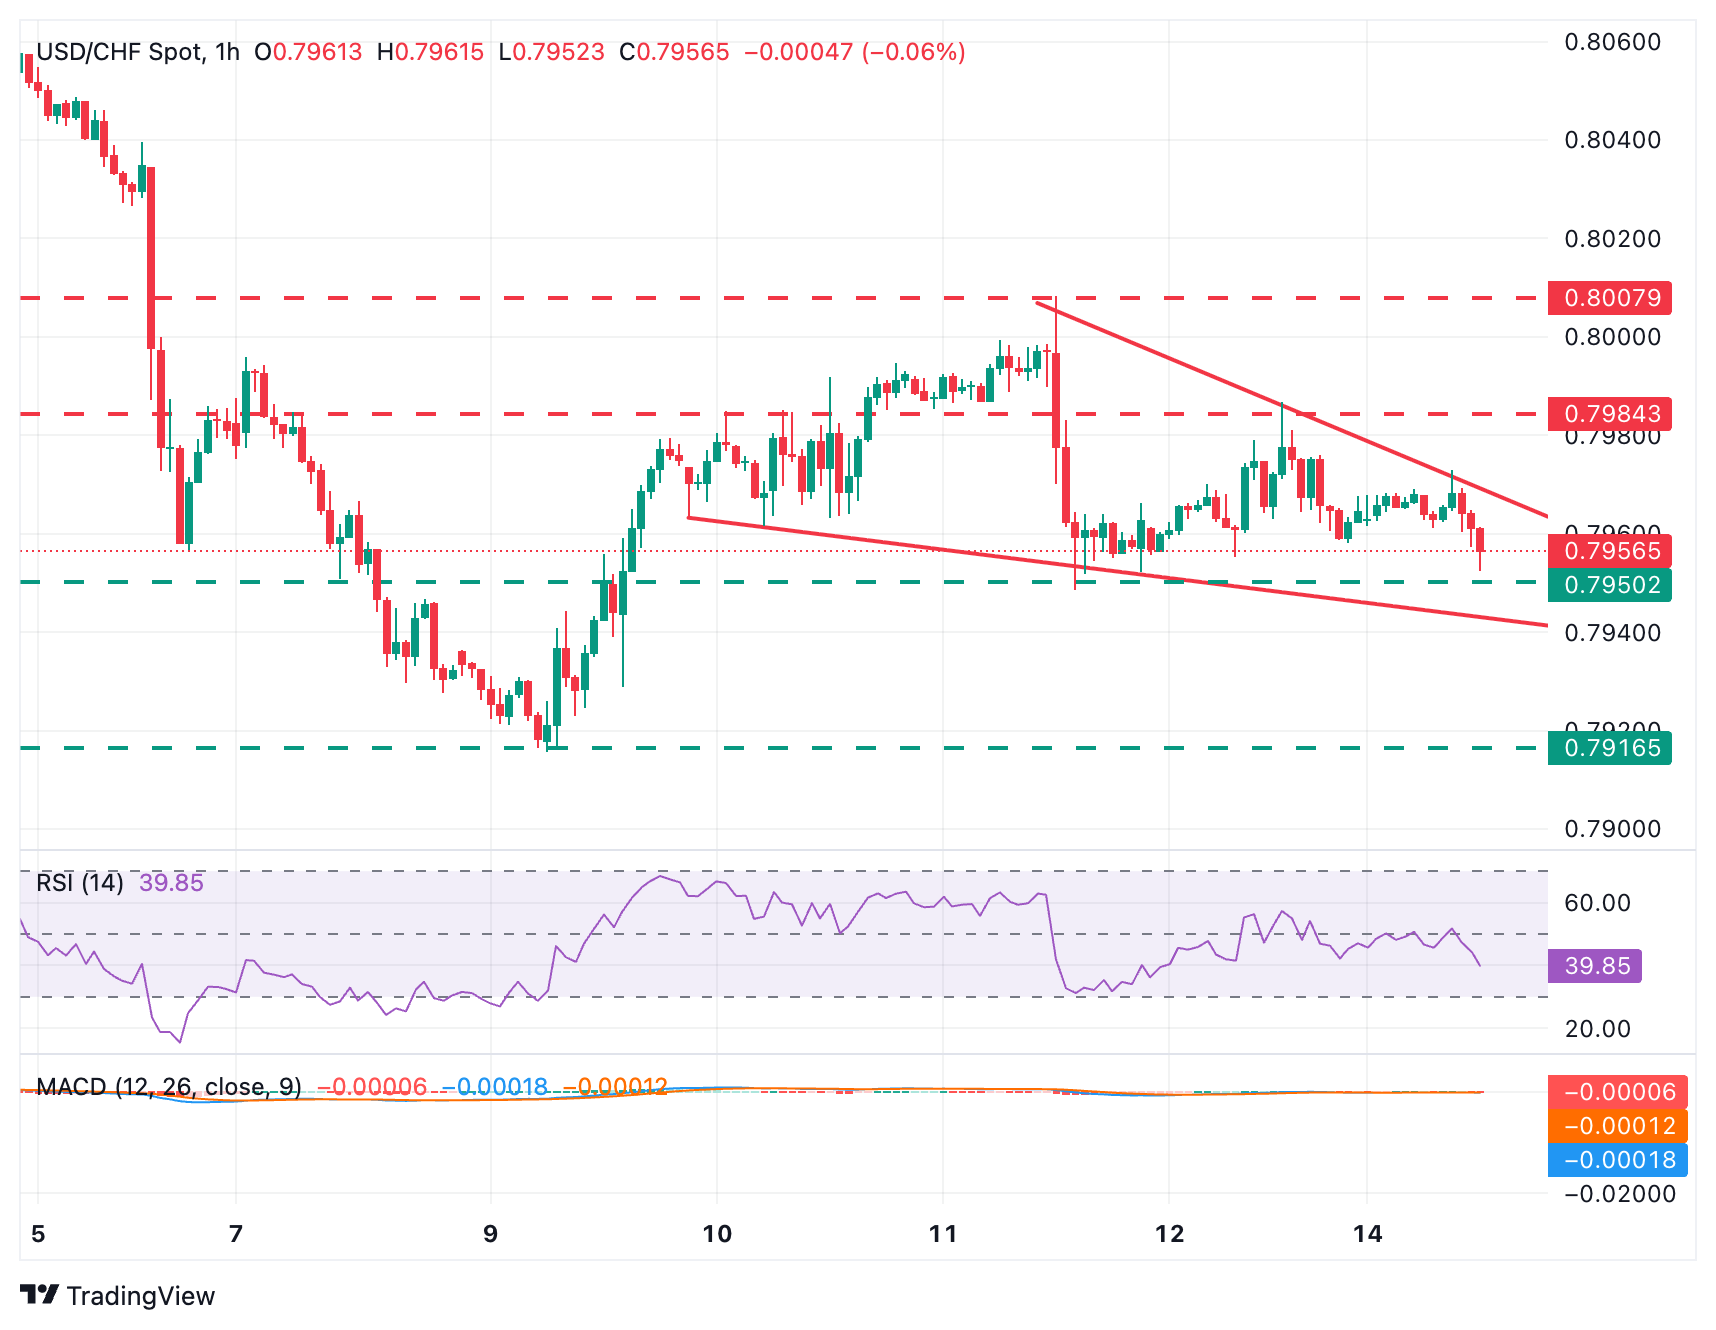
From a technical standpoint, the hourly chart shows an increasing bearish momentum after the pair’s failure at the 0.7970 area earlier today. Price action shows a descending wedge. This pattern suggests a potential bullish outcome, but so far, bears have the upper hand.
On the downside, a key support area emerges between the September 11 low, at 0.7950, and the wedge bottom, now around 0.7940. Further down, the next target would be the September 9 low, at 0.7915.
A rebound from current levels, on the other hand, would be tested at the intraday high, near 0.7970, and Friday’s high, at 0,7985. Further up, the Wedge’s target would be the September 11 high, at 0.8005.
US Dollar Price Today
The table below shows the percentage change of US Dollar (USD) against listed major currencies today. US Dollar was the strongest against the Canadian Dollar.
| USD | EUR | GBP | JPY | CAD | AUD | NZD | CHF | |
|---|---|---|---|---|---|---|---|---|
| USD | -0.10% | -0.28% | -0.16% | -0.04% | -0.19% | -0.10% | -0.11% | |
| EUR | 0.10% | -0.14% | -0.14% | 0.07% | -0.05% | -0.04% | -0.01% | |
| GBP | 0.28% | 0.14% | 0.10% | 0.22% | 0.09% | 0.11% | 0.02% | |
| JPY | 0.16% | 0.14% | -0.10% | 0.12% | 0.03% | 0.06% | 0.07% | |
| CAD | 0.04% | -0.07% | -0.22% | -0.12% | -0.05% | -0.11% | -0.20% | |
| AUD | 0.19% | 0.05% | -0.09% | -0.03% | 0.05% | 0.00% | 0.00% | |
| NZD | 0.10% | 0.04% | -0.11% | -0.06% | 0.11% | -0.01% | -0.08% | |
| CHF | 0.11% | 0.01% | -0.02% | -0.07% | 0.20% | -0.01% | 0.08% |
The heat map shows percentage changes of major currencies against each other. The base currency is picked from the left column, while the quote currency is picked from the top row. For example, if you pick the US Dollar from the left column and move along the horizontal line to the Japanese Yen, the percentage change displayed in the box will represent USD (base)/JPY (quote).

FXStreet
超過一百萬用戶依賴 FXStreet 獲取即時市場數據、圖表工具、專家洞見與外匯新聞。其全面的經濟日曆與教育網路研討會協助交易者保持資訊領先、做出審慎決策。FXStreet 擁有約 60 人的團隊,分布於巴塞隆納總部及全球各地。
Read More


