
Trade The World
USD/JPY Price Forecast: To remain sideways ahead of Powell’s Jackson Hole speech
作者 Christian Borjon Valencia
發布日期: 20 Aug 2025 | 修改日期: 20 Aug 2025


POPULAR ARTICLES

USD/JPY consolidated during Tuesday’s session, ending the day with minimal losses of 0.14%, with the pair trading near familiar levels, below the 20-day Simple Moving Average (SMA) at 147.86. At the time of writing, the pair trades at 147.61, virtually unchanged as Wednesday’s Asian session begins.
- USD/JPY consolidates, failing to reclaim 20-day SMA after rebound from recent lows.
- Resistance at 148.00 and 148.51; break higher targets 200-day SMA near 149.15.
- Support lies at 147.50 and 147.00, with further downside toward 50-day SMA if selling resumes.
USD/JPY consolidated during Tuesday’s session, ending the day with minimal losses of 0.14%, with the pair trading near familiar levels, below the 20-day Simple Moving Average (SMA) at 147.86. At the time of writing, the pair trades at 147.61, virtually unchanged as Wednesday’s Asian session begins.
From a daily chart standpoint, the pair is set to remain sideways trading with market players waiting for a fresh catalyst, which would come on Friday, with Federal Reserve Chief Jerome Powell's speech at Jackson Hole. Although there is pressure on the Fed by the Trump administration, the chances of Powell turning dovish are slim, following mixed inflation reports last week.
USD/JPY Price Forecast: Technical outlook
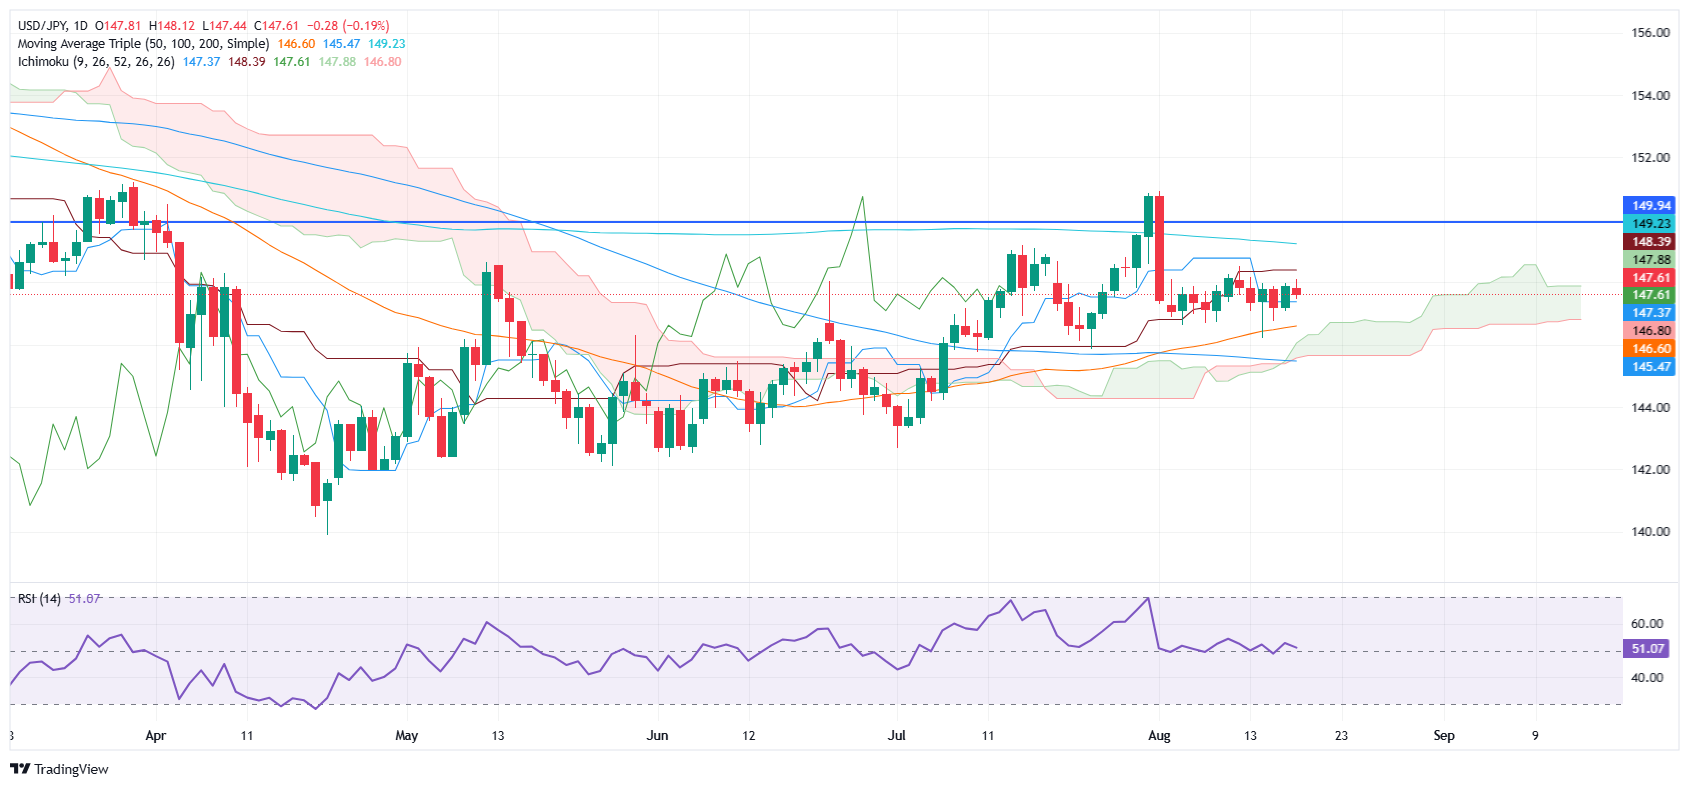
The USD/JPY trades below the 20-day SMA, after bouncing off multi-week lows of 146.21, set on August 14. It should be said that the pair has climbed three times straight, unable to conquer 148.00, seen as the first key resistance level. From a momentum standpoint, the Relative Strength Index (RSI) hints that buyers remain in control, but the index is headed towards bearish territory.
With that said, the USD/JPY first resistance would be the 20-day SMA and 148.00. If surpassed, the next stop would be August’s 12 peak at 148.51, before traders challenge the 200-day SMA at 149.15. On the flip side, if the pair slides below 147.50, the immediate support would be 147.00, followed by the 50-day SMA at 146.63.
USD/JPY Price Chart – Daily
Japanese Yen PRICE This week
The table below shows the percentage change of Japanese Yen (JPY) against listed major currencies this week. Japanese Yen was the strongest against the Australian Dollar.
| USD | EUR | GBP | JPY | CAD | AUD | NZD | CHF | |
|---|---|---|---|---|---|---|---|---|
| USD | 0.56% | 0.47% | 0.30% | 0.37% | 0.86% | 0.50% | 0.26% | |
| EUR | -0.56% | -0.10% | -0.26% | -0.20% | 0.31% | -0.09% | -0.30% | |
| GBP | -0.47% | 0.10% | -0.28% | -0.10% | 0.41% | 0.00% | -0.24% | |
| JPY | -0.30% | 0.26% | 0.28% | 0.09% | 0.58% | 0.22% | -0.04% | |
| CAD | -0.37% | 0.20% | 0.10% | -0.09% | 0.47% | 0.12% | -0.15% | |
| AUD | -0.86% | -0.31% | -0.41% | -0.58% | -0.47% | -0.40% | -0.67% | |
| NZD | -0.50% | 0.09% | -0.00% | -0.22% | -0.12% | 0.40% | -0.27% | |
| CHF | -0.26% | 0.30% | 0.24% | 0.04% | 0.15% | 0.67% | 0.27% |
The heat map shows percentage changes of major currencies against each other. The base currency is picked from the left column, while the quote currency is picked from the top row. For example, if you pick the Japanese Yen from the left column and move along the horizontal line to the US Dollar, the percentage change displayed in the box will represent JPY (base)/USD (quote).

FXStreet
超過一百萬用戶依賴 FXStreet 獲取即時市場數據、圖表工具、專家洞見與外匯新聞。其全面的經濟日曆與教育網路研討會協助交易者保持資訊領先、做出審慎決策。FXStreet 擁有約 60 人的團隊,分布於巴塞隆納總部及全球各地。
Read More


