
Trade The World
WTI Price Forecast: Trades broadly sideways near 20-day EMA around $60.00
作者 Sagar Dua
發布日期: 11 Nov 2025 | 修改日期: 11 Nov 2025


POPULAR ARTICLES

West Texas Intermediate (WTI), futures on NYMEX, trades 0.5% lower to near $5975 during the early European session on Tuesday. The Oil price faces pressure on oversupply worries, following the announcement from the OPEC+ that it will increase December output targets by 137,000 barrels per day.
- The Oil price faces selling pressure as OPEC+ expresses further oil supply increases.
- The US Senate advances a government funding bill to the House.
- WTI trades inside the Descending Triangle formation on a daily timeframe.
West Texas Intermediate (WTI), futures on NYMEX, trades 0.5% lower to near $5975 during the early European session on Tuesday. The Oil price faces pressure on oversupply worries, following the announcement from the OPEC+ that it will increase December output targets by 137,000 barrels per day. The amount of supply increases is similar to what had been targeted for October and November.
Theoretically, growing Oil oversupply concerns diminish the appeal of the Oil price.
The Oil price fails to capitalize on improving market sentiment, driven by hopes of the United States (US) government reopening. On Monday, Democratic lawmakers agreed to support the government funding bill in the US Senate and advanced it to the Republican-controlled House of Representatives. The reopening of US federal agencies after the historically longest shutdown would resume the execution of government spending, a scenario that will boost Oil demand.
Going forward, investors will focus on the OPEC Monthly Market report and the EIA Crude Oil Stockpiles data for the week ending November 7, which will be published on Wednesday and Thursday, respectively.
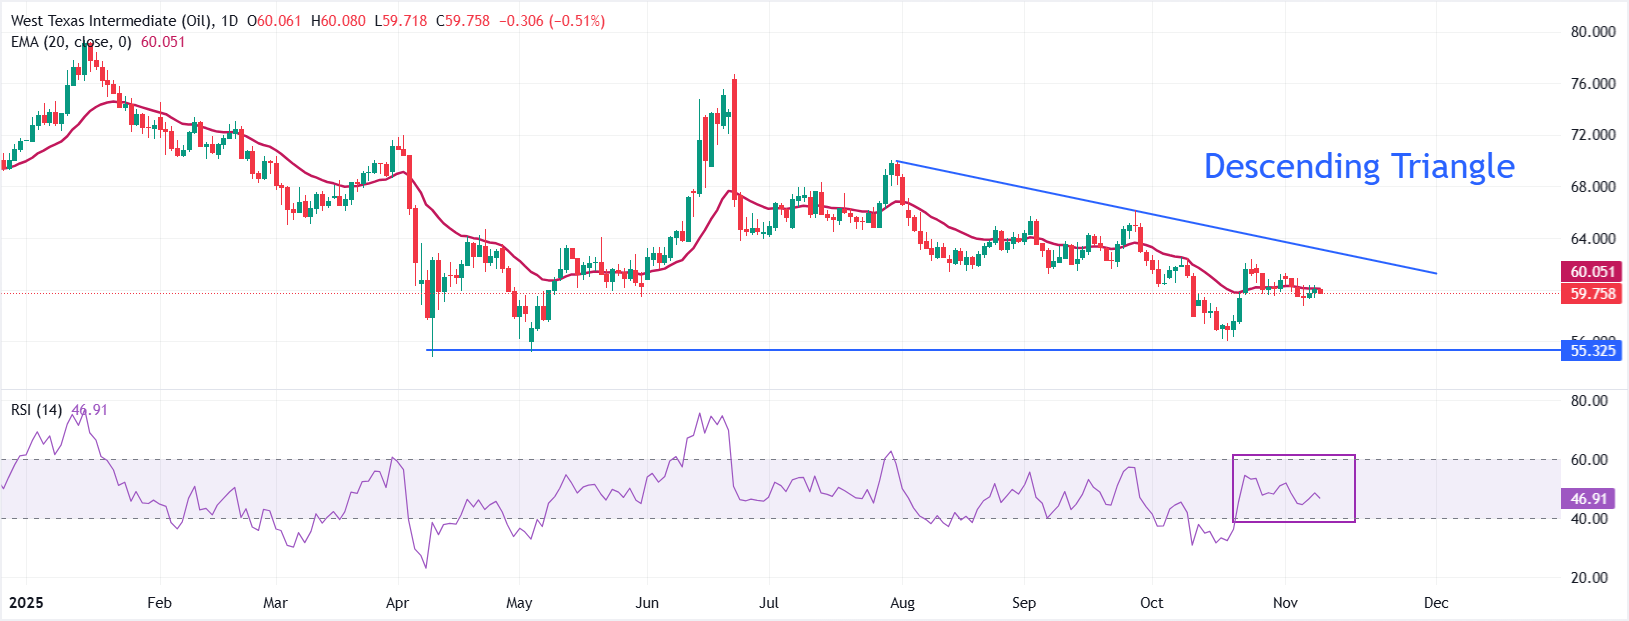
WTI trades in a tight range around $60.00 for almost two weeks. The Oil price remains sticky near the 20-day Exponential Moving Average (EMA), indicating a sideways trend.
On a broader note, the Oil price trades inside the Descending Triangle formation. The downward-sloping border of the chart pattern is plotted from the July 30 high near $70.00. Meanwhile, the horizontal resistance is placed from the April 9 low around $54.80.
The 14-day Relative Strength Index (RSI) oscillates inside the 40.00-60.00 range, indicating a sharp volatility contraction.
The Oil price could slide to near the October 20 high of $57.43 and the April 9 low around $54.80 if it breaks below the November 6 low of $58.75.
On the flip side, a recovery move the Oil price above the August 6 high of $66.00 would open the door towards the July 9 high of $68.00, followed by the July 30 high of $70.00.
WTI daily chart
WTI Oil FAQs
WTI Oil is a type of Crude Oil sold on international markets. The WTI stands for West Texas Intermediate, one of three major types including Brent and Dubai Crude. WTI is also referred to as “light” and “sweet” because of its relatively low gravity and sulfur content respectively. It is considered a high quality Oil that is easily refined. It is sourced in the United States and distributed via the Cushing hub, which is considered “The Pipeline Crossroads of the World”. It is a benchmark for the Oil market and WTI price is frequently quoted in the media.
Like all assets, supply and demand are the key drivers of WTI Oil price. As such, global growth can be a driver of increased demand and vice versa for weak global growth. Political instability, wars, and sanctions can disrupt supply and impact prices. The decisions of OPEC, a group of major Oil-producing countries, is another key driver of price. The value of the US Dollar influences the price of WTI Crude Oil, since Oil is predominantly traded in US Dollars, thus a weaker US Dollar can make Oil more affordable and vice versa.
The weekly Oil inventory reports published by the American Petroleum Institute (API) and the Energy Information Agency (EIA) impact the price of WTI Oil. Changes in inventories reflect fluctuating supply and demand. If the data shows a drop in inventories it can indicate increased demand, pushing up Oil price. Higher inventories can reflect increased supply, pushing down prices. API’s report is published every Tuesday and EIA’s the day after. Their results are usually similar, falling within 1% of each other 75% of the time. The EIA data is considered more reliable, since it is a government agency.
OPEC (Organization of the Petroleum Exporting Countries) is a group of 12 Oil-producing nations who collectively decide production quotas for member countries at twice-yearly meetings. Their decisions often impact WTI Oil prices. When OPEC decides to lower quotas, it can tighten supply, pushing up Oil prices. When OPEC increases production, it has the opposite effect. OPEC+ refers to an expanded group that includes ten extra non-OPEC members, the most notable of which is Russia.

FXStreet
超過一百萬用戶依賴 FXStreet 獲取即時市場數據、圖表工具、專家洞見與外匯新聞。其全面的經濟日曆與教育網路研討會協助交易者保持資訊領先、做出審慎決策。FXStreet 擁有約 60 人的團隊,分布於巴塞隆納總部及全球各地。
Read More


