
Trade The World
Zcash Price Forecast: ZEC risks further losses as correction from four-year high gains traction
作者 Vishal Dixit
發布日期: 14 Oct 2025 | 修改日期: 14 Oct 2025


POPULAR ARTICLES

Zcash (ZEC) price trades below $225 at the time of writing on Tuesday, with a 17% decline in the last 24 hours, emerging as the top decliner in the broader cryptocurrency market.
- Zcash extends the correction phase for the third consecutive day, crossing below $225.
- Declining trend in ZEC futures Open Interest signals lowered optimism among traders.
- The technical outlook holds a bearish bias, indicating a potential drop below $200.
Zcash (ZEC) price trades below $225 at the time of writing on Tuesday, with a 17% decline in the last 24 hours, emerging as the top decliner in the broader cryptocurrency market. Technically, the privacy-focused coin flashes bearish potential as indicated by the overheated Relative Strength Index (RSI).
Furthermore, the rising sell-side dominance in the Zcash derivatives suggests weakness in traders’ sentiment.
Interest declines in the privacy coin
Zcash is losing retail interest after forming a four-year high at $298 on Saturday, as indicated by the declining trend in ZEC futures Open Interest (OI), according to CoinGlass data. The ZEC futures OI has declined by 15% in the last 24 hours, reaching $275.49 million. Typically, OI refers to the notional value of all existing contracts, while a decline indicates that traders are either reducing position size, leveraging less, or closing positions, all of which suggest a risk-off sentiment.
Corroborating the risk-off sentiment, the long liquidations in the last 24 hours amount to $3.57 million, outpacing the $601,710 in short liquidations, which indicate a larger wipeout of bullish-aligned traders. As bulls face forced liquidations, the sell-side dominance grows in the ZEC derivatives.
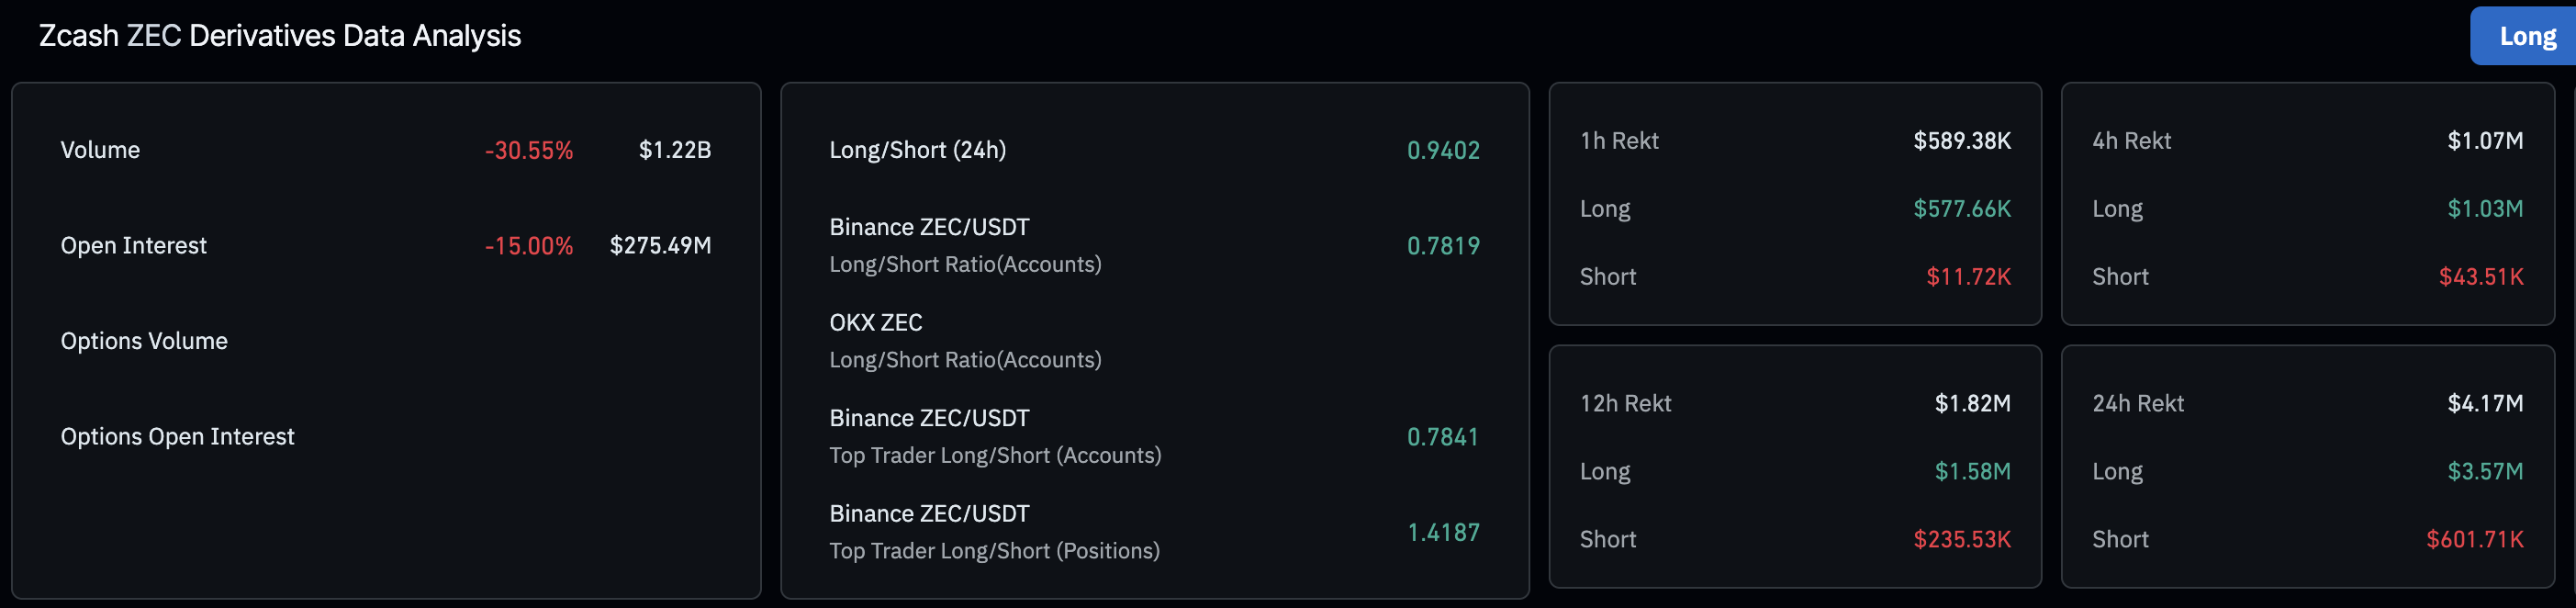
Zcash derivatives data. Source: CoinGlass
Technical outlook: Will Zcash drop to $200?
Zcash is down by nearly 10% on the day, extending the loss of around 14% so far this week. The failure to reach the $300 psychological mark led to an ongoing correction from the 78.6% Fibonacci retracement level at $295, which was drawn from the May 12, 2021, high of $372 to the $16 low of July 5, 2024, on the weekly chart.
After six consecutive weeks of an uptrend, Zcash is now trading below the 61.8% Fibonacci retracement level at $235. A bearish close to the week below this level could threaten the $200 psychological level, followed by the 50% Fibonacci retracement at $193 as the next support level.
The technical indicators on the weekly chart suggest that Zcash's recovery had run its course as the RSI entered the overbought zone. As of Tuesday, RSI is at 79, moving downwards in the overbought zone, suggesting that the buying pressure is gradually declining as bulls are either offloading or taking a hold-and-wait approach.
Still, the Moving Average Convergence Divergence (MACD), a lagging indicator, continues to rise steadily with its signal line, reflecting the underlying demand.
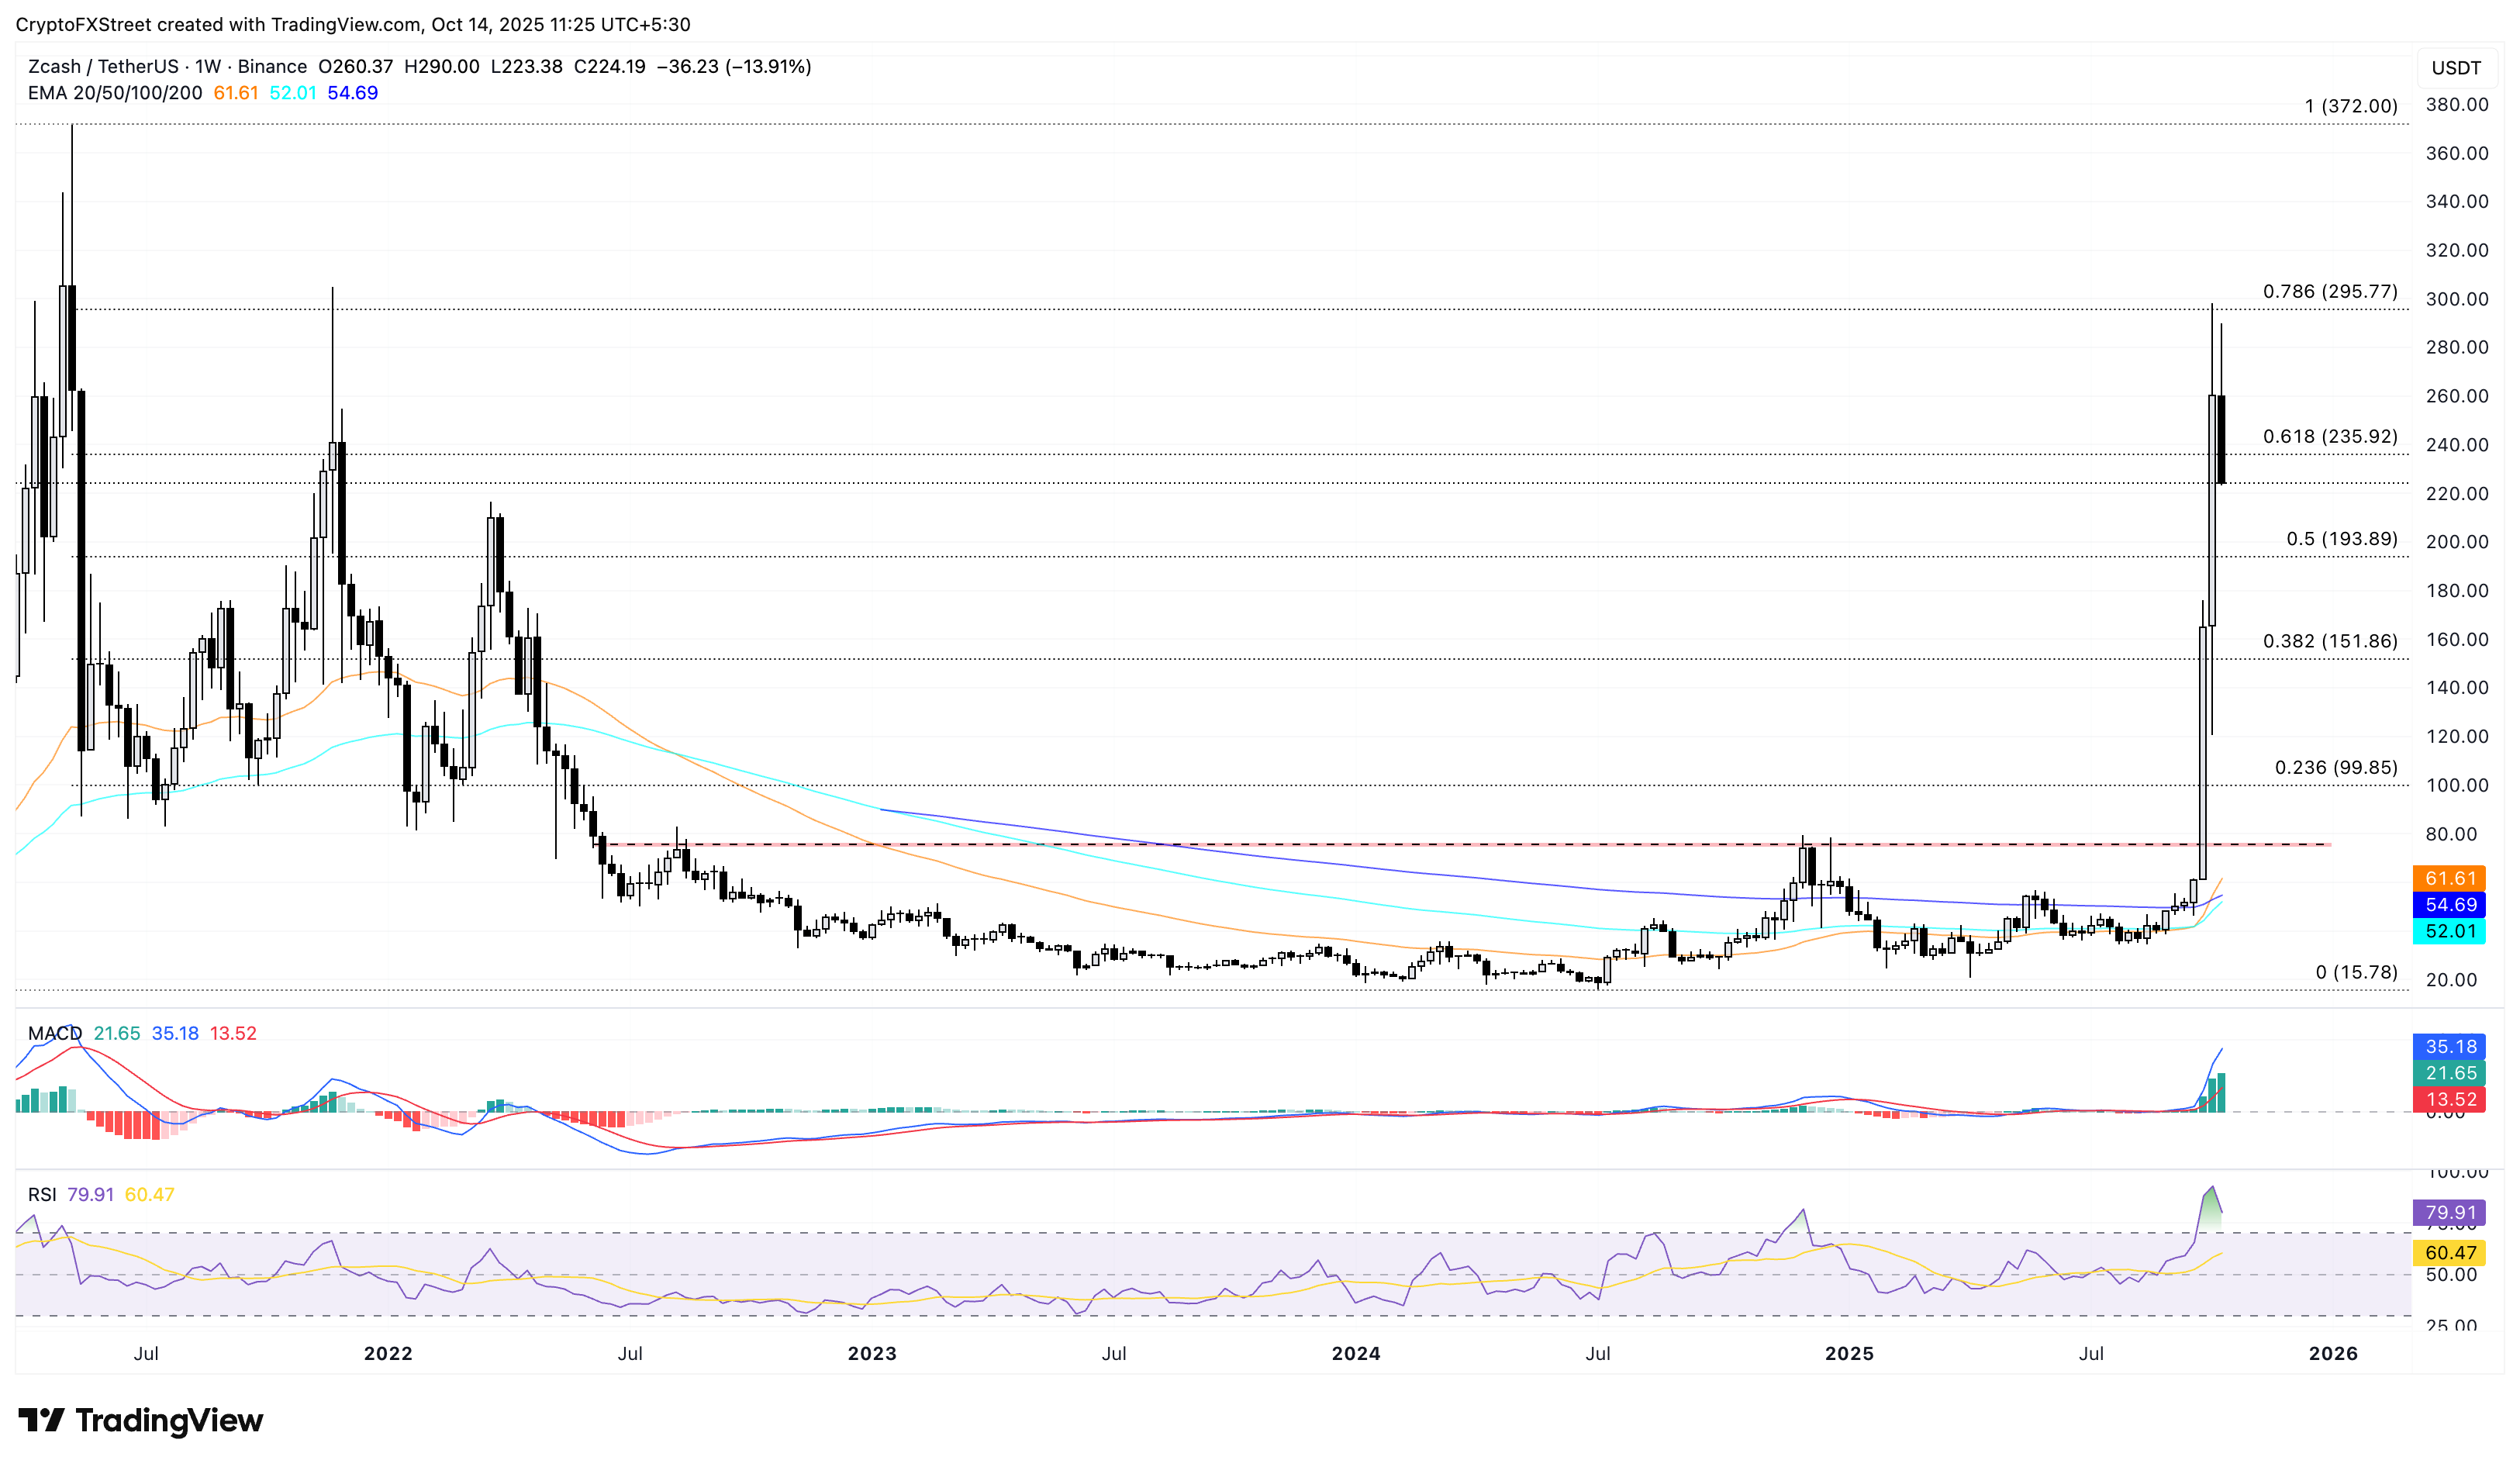
ZEC/USDT weekly price chart.
Looking up, if ZEC holds above the 61.8% Fibonacci retracement level at $235, it could bounce back to challenge the $300 psychological level.
(The story was corrected on October 14 at 09:35 GMT to update the dates referring to the Fibonacci retracement tool, to say it was drawn from the May 12, 2021, high of $372 to the $16 low of July 5, 2024.)

FXStreet
超過一百萬用戶依賴 FXStreet 獲取即時市場數據、圖表工具、專家洞見與外匯新聞。其全面的經濟日曆與教育網路研討會協助交易者保持資訊領先、做出審慎決策。FXStreet 擁有約 60 人的團隊,分布於巴塞隆納總部及全球各地。
Read More


