
Trade The World
EUR/JPY Price Forecast: Hovers around 176.00 after rebounding from confluence support zone
Von Akhtar Faruqui
Veröffentlichungsdatum: 21 Oct 2025 | Änderungsdatum: 21 Oct 2025


POPULAR ARTICLES

EUR/JPY halts its four-day losing streak, trading around 176.00 during the European hours on Tuesday. The technical analysis of the daily chart indicates an ongoing bullish bias as the currency cross is positioned within the ascending channel pattern.
- EUR/JPY may approach the all-time high of 177.94.
- The short-term momentum is stronger as the currency price moves above the nine-day Exponential Moving Average.
- The primary support lies at the nine-day EMA of 175.78.
EUR/JPY halts its four-day losing streak, trading around 176.00 during the European hours on Tuesday. The technical analysis of the daily chart indicates an ongoing bullish bias as the currency cross is positioned within the ascending channel pattern.
The short-term price momentum is stronger as the EUR/JPY cross remains above the nine-day Exponential Moving Average (EMA). Additionally, the 14-day Relative Strength Index (RSI) is positioned above the 50 mark, suggesting that bullish bias is strengthening.
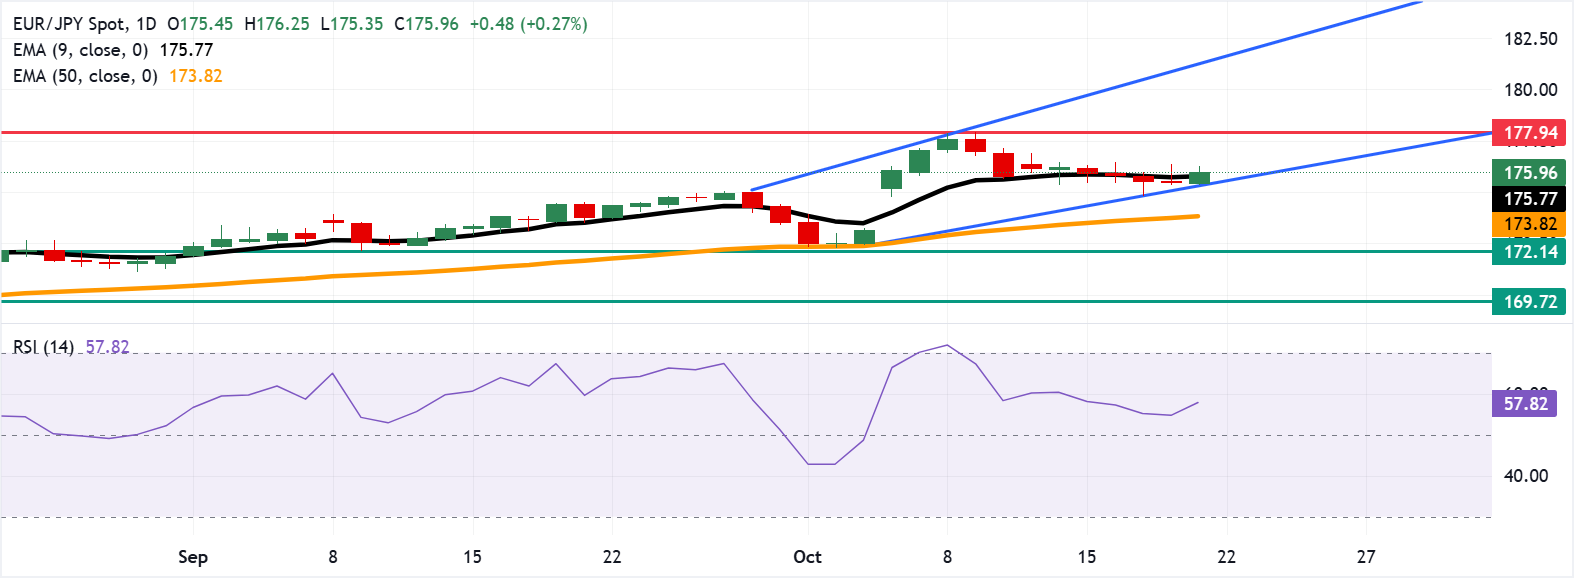
On the upside, the EUR/JPY cross may target the all-time high of 177.94, which was recorded on October 9. A break above this level would support the bullish bias and lead the currency cross to explore the region around the upper boundary of the ascending channel around 181.30.
The EUR/JPY cross may find its immediate support at the nine-day EMA of 175.78, followed by the ascending channel’s lower boundary around 175.40. A break below this confluence support zone would weaken the bullish bias and put downward pressure on the currency cross to test the 50-day EMA at 173.82. Further declines would weaken the medium-term price momentum and prompt the currency cross to test the six-week low of 172.14, which was recorded on September 9.
EUR/JPY: Daily Chart
Euro Price Today
The table below shows the percentage change of Euro (EUR) against listed major currencies today. Euro was the strongest against the New Zealand Dollar.
| USD | EUR | GBP | JPY | CAD | AUD | NZD | CHF | |
|---|---|---|---|---|---|---|---|---|
| USD | 0.06% | 0.07% | 0.29% | 0.12% | 0.26% | 0.35% | -0.08% | |
| EUR | -0.06% | -0.00% | 0.23% | 0.06% | 0.20% | 0.28% | -0.15% | |
| GBP | -0.07% | 0.00% | 0.22% | 0.06% | 0.20% | 0.29% | -0.15% | |
| JPY | -0.29% | -0.23% | -0.22% | -0.17% | -0.02% | 0.05% | -0.36% | |
| CAD | -0.12% | -0.06% | -0.06% | 0.17% | 0.14% | 0.23% | -0.20% | |
| AUD | -0.26% | -0.20% | -0.20% | 0.02% | -0.14% | 0.09% | -0.37% | |
| NZD | -0.35% | -0.28% | -0.29% | -0.05% | -0.23% | -0.09% | -0.43% | |
| CHF | 0.08% | 0.15% | 0.15% | 0.36% | 0.20% | 0.37% | 0.43% |
The heat map shows percentage changes of major currencies against each other. The base currency is picked from the left column, while the quote currency is picked from the top row. For example, if you pick the Euro from the left column and move along the horizontal line to the US Dollar, the percentage change displayed in the box will represent EUR (base)/USD (quote).

Acuity Trading
Acuity Trading ist ein 2013 gegründetes Fintech-Unternehmen mit Sitz in London, das sich auf KI-gestützte alternative Daten und Sentiment-Analysen für Handel und Investment spezialisiert hat. Sie revolutionierten das Online-Trading mit visuellen News- und Sentiment-Tools und führen den Markt weiterhin mit alpha-generierenden alternativen Daten und hochgradig interaktiven Trading-Tools auf Basis neuester KI-Forschung an.
Read More


