
Trade The World
EUR/JPY Price Forecast: Slips below 183.00 as momentum weakens
Von Akhtar Faruqui
Veröffentlichungsdatum: 7 Jan 2026 | Änderungsdatum: 7 Jan 2026


POPULAR ARTICLES

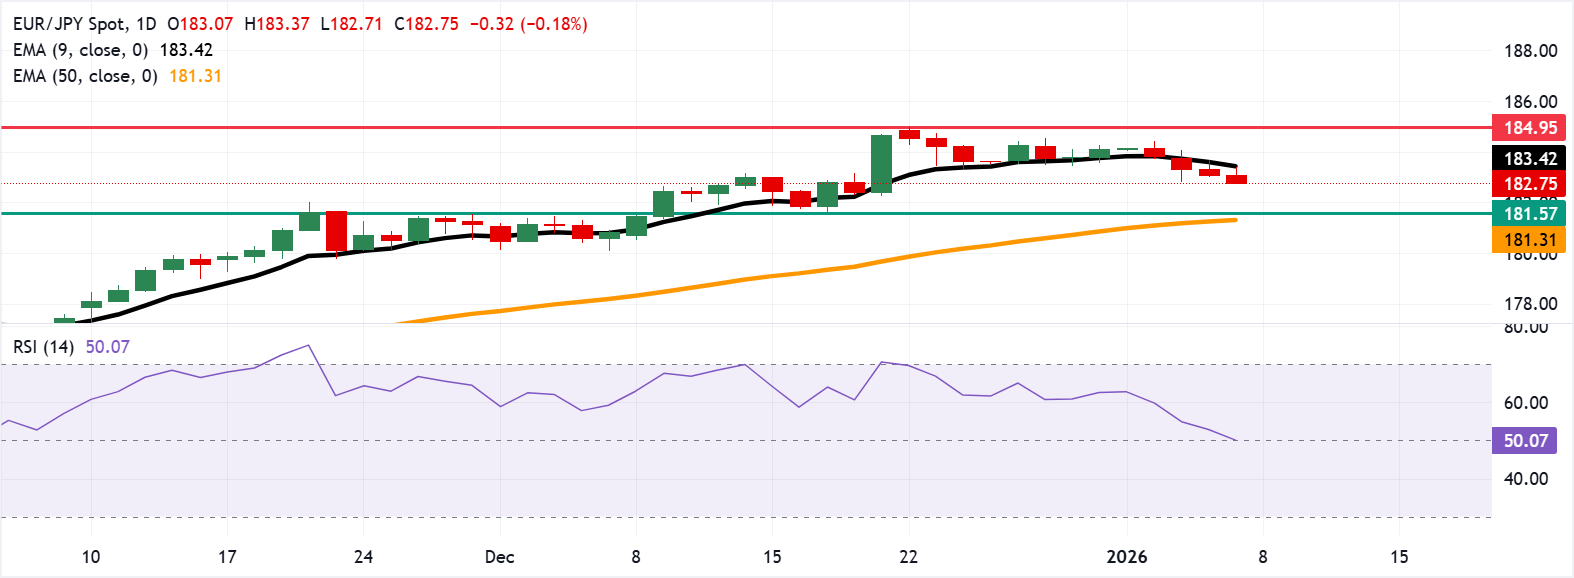
EUR/JPY extends its losses for the fourth successive session, trading around 182.80 during the European hours on Wednesday.
- EUR/JPY may explore the area around the three-week low of 181.57.
- The 14-day Relative Strength Index stands at 50.96, indicating subdued momentum.
- The primary resistance lies at the nine-day EMA of 183.44.
EUR/JPY extends its losses for the fourth successive session, trading around 182.80 during the European hours on Wednesday. The currency cross remains subdued following the release of Germany’s Retail Sales, which climbed 1.1% year-over-year (YoY) in November, following an increase of 0.9% in October. Monthly Retail Sales fell 0.6% in November, against a 0.3% decline in October and the market expectations of a 0.2% increase.
The technical analysis of the daily chart suggests that the 14-day Relative Strength Index (RSI) sits at 50.96 (neutral), confirming tempered momentum. The EUR/JPY cross remains above the rising 50-day Exponential Moving Average (EMA), while it stalls beneath a softening nine-day EMA, pointing to consolidation after the recent advance.
The EUR/JPY cross may navigate the region around the initial support at the three-week low of 181.57, recorded on December 17, followed by the 50-day EMA at 181.31. Holding above the 50-day EMA would keep the medium-term uptrend intact, while a drop through the first floor could expose the deeper level.
On the upside, the EUR/JPY cross may rebound toward the nine-day EMA at 183.44. Recovery through the nine-day EMA could re-establish upside traction and refocus the topside path toward the all-time high of 184.95, which was recorded on December 22, aligned with the psychological level of 185.00.
Euro Price Today
The table below shows the percentage change of Euro (EUR) against listed major currencies today. Euro was the weakest against the Japanese Yen.
| USD | EUR | GBP | JPY | CAD | AUD | NZD | CHF | |
|---|---|---|---|---|---|---|---|---|
| USD | 0.06% | 0.04% | -0.09% | 0.11% | 0.00% | 0.11% | 0.09% | |
| EUR | -0.06% | -0.01% | -0.16% | 0.05% | -0.05% | 0.04% | 0.03% | |
| GBP | -0.04% | 0.00% | -0.15% | 0.06% | -0.04% | 0.06% | 0.04% | |
| JPY | 0.09% | 0.16% | 0.15% | 0.21% | 0.11% | 0.20% | 0.19% | |
| CAD | -0.11% | -0.05% | -0.06% | -0.21% | -0.10% | -0.01% | -0.02% | |
| AUD | -0.00% | 0.05% | 0.04% | -0.11% | 0.10% | 0.10% | 0.08% | |
| NZD | -0.11% | -0.04% | -0.06% | -0.20% | 0.00% | -0.10% | -0.02% | |
| CHF | -0.09% | -0.03% | -0.04% | -0.19% | 0.02% | -0.08% | 0.02% |
The heat map shows percentage changes of major currencies against each other. The base currency is picked from the left column, while the quote currency is picked from the top row. For example, if you pick the Euro from the left column and move along the horizontal line to the US Dollar, the percentage change displayed in the box will represent EUR (base)/USD (quote).
(The technical analysis of this story was written with the help of an AI tool.)

Acuity Trading
Acuity Trading ist ein 2013 gegründetes Fintech-Unternehmen mit Sitz in London, das sich auf KI-gestützte alternative Daten und Sentiment-Analysen für Handel und Investment spezialisiert hat. Sie revolutionierten das Online-Trading mit visuellen News- und Sentiment-Tools und führen den Markt weiterhin mit alpha-generierenden alternativen Daten und hochgradig interaktiven Trading-Tools auf Basis neuester KI-Forschung an.
Read More


