
Trade The World
GBP/JPY Price Forecast: Bulls are testing resistance at 200.30 area
Von Guillermo Alcala
Veröffentlichungsdatum: 25 Sep 2025 | Änderungsdatum: 25 Sep 2025


POPULAR ARTICLES

The British Pound is trading higher against the Japanese Yen for the fourth consecutive day. The pair bounced up from the 199.20 area last week and has returned above the 200.00 level; however, a broken trendline resistance in the vicinity of 200.30 is currently holding bulls back for now.
- Pound bulls have encountered resistance above the 200.00 level in their rally against the Yen.
- The JPY remains on its back foot with traders awaiting Tokyo CPI data.
- GBP/JPY is attempting to overcome a reverse trendline at 200.30.
The British Pound is trading higher against the Japanese Yen for the fourth consecutive day. The pair bounced up from the 199.20 area last week and has returned above the 200.00 level; however, a broken trendline resistance in the vicinity of 200.30 is currently holding bulls back for now.
The pound has been drawing support from a broad-based Yen weakness this week. The minutes of the latest BoJ meeting have failed to provide any significant support to the Yen, as investors await Tokyo CPI data, due later today, with the market split about the chances of a rate hike in October.
GBP/JPY 4-Hour Chart
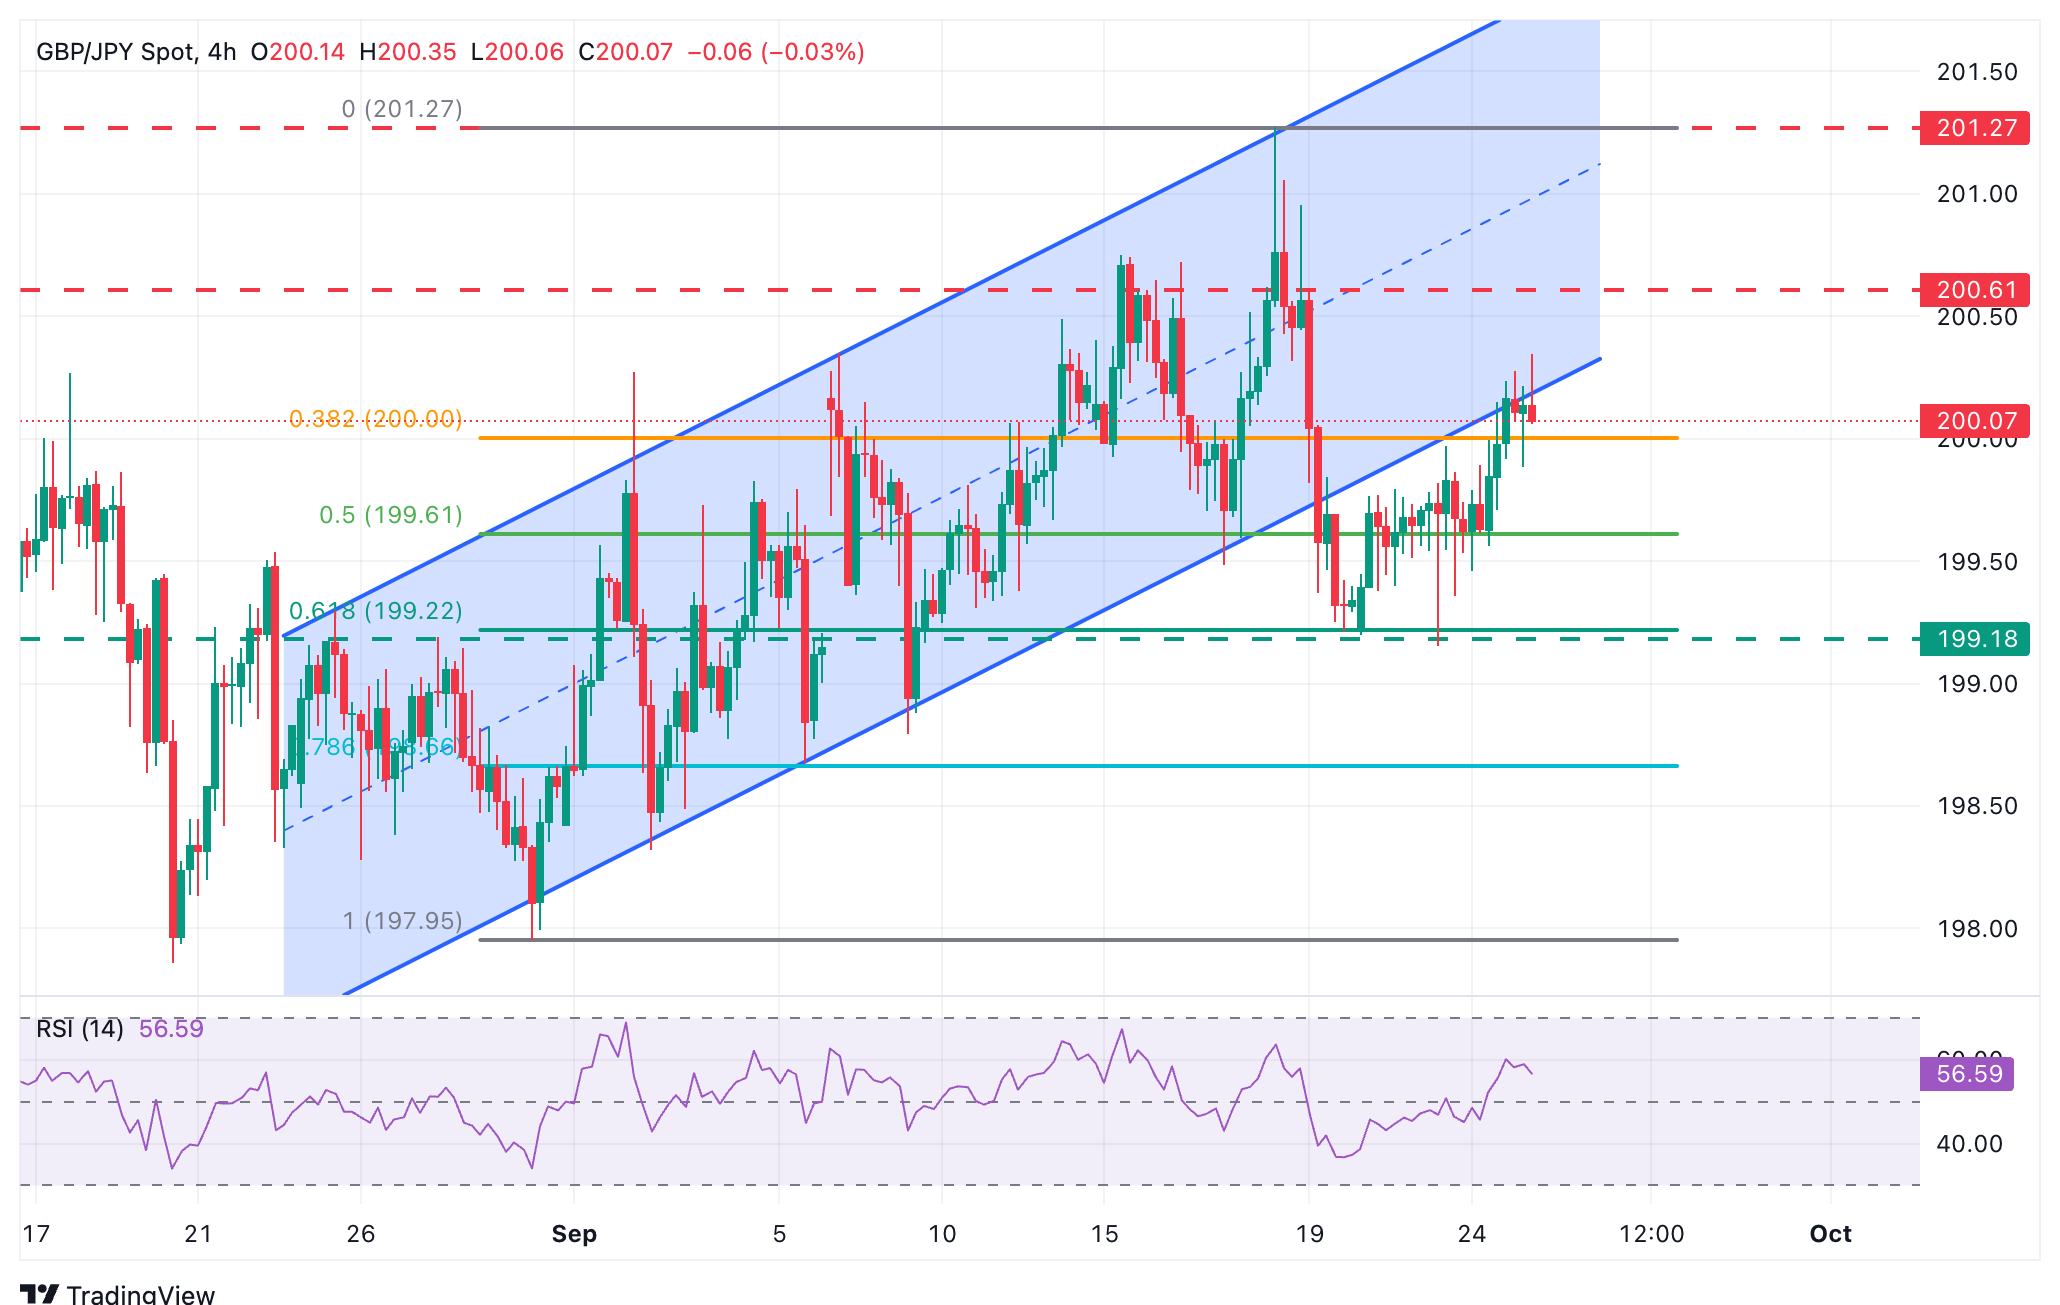
The technical picture is positive. Indicators on t-hour chats show a strong bullish momentum, but the pair would need to return above the bottom of the broken channel, at 200.30, to extend its recovery towards the September 19 high, at 200.50, and the year-to-date high, at 201.27
To the downside, the intra-day low, near 199.90, is likely to challenge a potential bearish reaction. Below here, the 199.20 area, which contained downside attempts on September 18 and 23, will come into focus. Further down, the 78.6% retracement of the September rally meets the September 5 low at 168.65.
Japanese Yen Price Today
The table below shows the percentage change of Japanese Yen (JPY) against listed major currencies today. Japanese Yen was the strongest against the Swiss Franc.
| USD | EUR | GBP | JPY | CAD | AUD | NZD | CHF | |
|---|---|---|---|---|---|---|---|---|
| USD | -0.06% | -0.08% | -0.15% | 0.01% | -0.13% | -0.12% | 0.04% | |
| EUR | 0.06% | -0.04% | -0.12% | 0.06% | -0.05% | -0.07% | 0.10% | |
| GBP | 0.08% | 0.04% | -0.06% | 0.10% | -0.04% | -0.01% | 0.17% | |
| JPY | 0.15% | 0.12% | 0.06% | 0.14% | -0.00% | 0.19% | 0.20% | |
| CAD | -0.01% | -0.06% | -0.10% | -0.14% | -0.12% | -0.13% | 0.07% | |
| AUD | 0.13% | 0.05% | 0.04% | 0.00% | 0.12% | 0.30% | 0.16% | |
| NZD | 0.12% | 0.07% | 0.00% | -0.19% | 0.13% | -0.30% | -0.09% | |
| CHF | -0.04% | -0.10% | -0.17% | -0.20% | -0.07% | -0.16% | 0.09% |
The heat map shows percentage changes of major currencies against each other. The base currency is picked from the left column, while the quote currency is picked from the top row. For example, if you pick the Japanese Yen from the left column and move along the horizontal line to the US Dollar, the percentage change displayed in the box will represent JPY (base)/USD (quote).
encountered resistance above the 200.00 level in

Acuity Trading
Acuity Trading ist ein 2013 gegründetes Fintech-Unternehmen mit Sitz in London, das sich auf KI-gestützte alternative Daten und Sentiment-Analysen für Handel und Investment spezialisiert hat. Sie revolutionierten das Online-Trading mit visuellen News- und Sentiment-Tools und führen den Markt weiterhin mit alpha-generierenden alternativen Daten und hochgradig interaktiven Trading-Tools auf Basis neuester KI-Forschung an.
Read More


