
GBP/USD rallies as Trump tariff threats against Europe weigh on US Dollar
Von Christian Borjon Valencia
Veröffentlichungsdatum: 19 Jan 2026 | Änderungsdatum: 19 Jan 2026


BELIEBTE ARTIKEL
GBP/USD rises on Monday after tensions between the US and Europe had grown following a social media post of US President Donald Trump threatening to impose duties on eight European countries. At the time of writing, the pair trades at 1.3414, up 0.28%.
- GBP/USD climbs as Trump threatens tariffs on Europe, reviving trade war fears and weakening the US Dollar.
- The European Union and the United Kingdom signal a potential retaliation, adding pressure on the Greenback amid rising geopolitical uncertainty.
- Traders eye UK jobs, inflation data and Trump’s speech in Davos for fresh Sterling catalysts.
GBP/USD rises on Monday after tensions between the US and Europe had grown following a social media post of US President Donald Trump threatening to impose duties on eight European countries. At the time of writing, the pair trades at 1.3414, up 0.28%.
Sterling advances as US–Europe trade tensions spark broad Dollar selling
Over the weekend, Trump announced 10% tariffs on eight countries, including Denmark, Norway, Sweden, France, Germany, Finland, the Netherlands and the UK. The duties would be effective on February 1 and would be increased to 25% on June 1 if they failed to reach an agreement, so the US can annex or purchase Greenland.
As a response, the European Union (EU) and the UK seem set to retaliate against the US. The EU is preparing to impose €93 billion of tariffs on the US or restrict American companies from the European market.
The news is a headwind for Greenback, which is down 0.38% in the day, according to the US Dollar Index (DXY). The DXY, which measures the US Dollar’s performance against a basket of six currencies, is down 0.30% to 99.08.
According to Reuters, UK Prime Minister Keir Starmer called for a calm discussion on Greenland on Monday.
Meanwhile, GBP/USD has risen on broad US Dollar weakness, in tune with seasonality. During the last five years, Sterling posted positive numbers even though the swaps market had priced in less easing on the Federal Reserve than on the Bank of England.
Ahead this week, the UK docket will feature jobs data and inflation figures. In the US, traders will eye jobs, housing data and a speech by US President Donald Trump at the World Economic Forum in Davos.
In two of the last five years, Sterling was positive in January, but so far in 2026 is down after traders priced out fewer rate cuts by the Federal Reserve towards the end of the year.
GBP/USD Price Forecast: Technical outlook
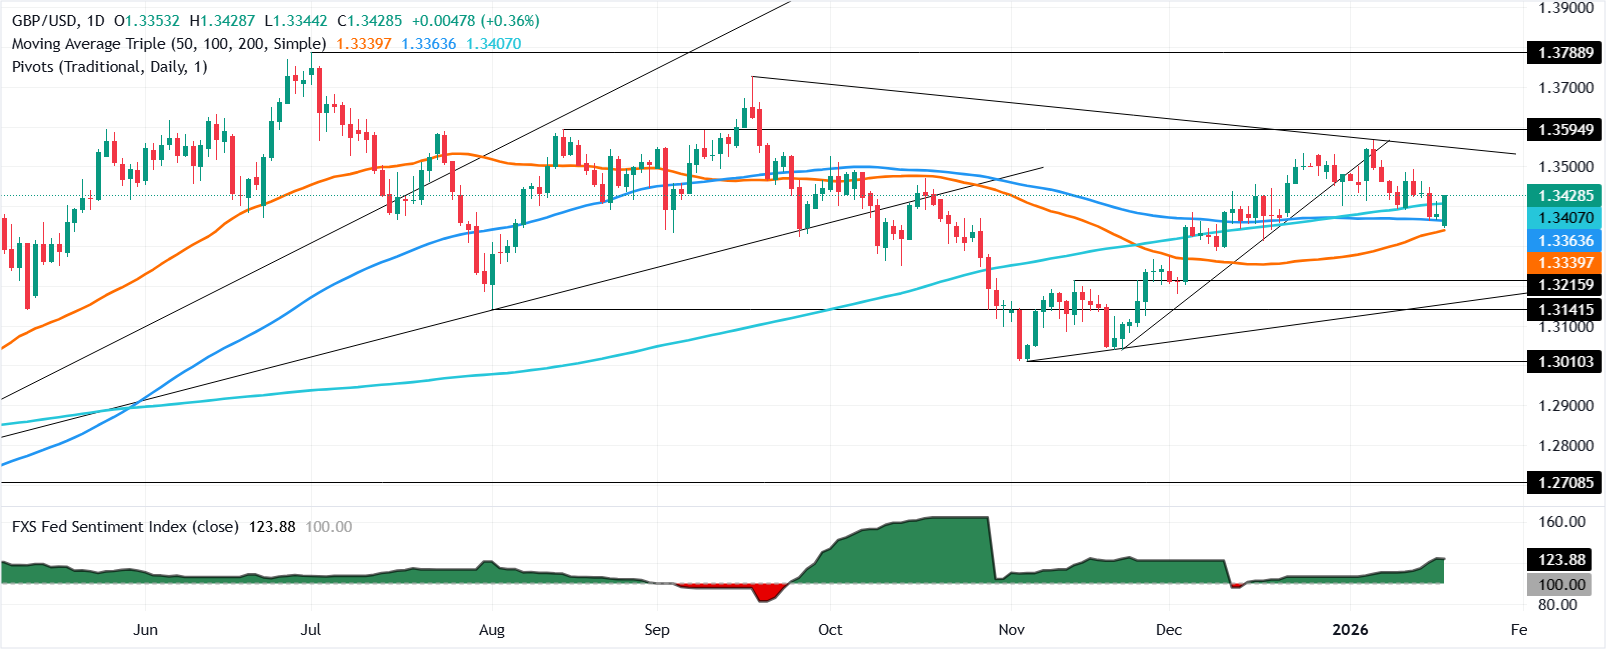
The GBP/USD technical picture shows the pair remains downward biased, but a daily close above the 200-day Simple Moving Average (SMA) at 1.3400 could sponsor a recovery if buyers reclaim the latest cycle high of 1.3567, the January 6 high.
Otherwise, if sellers drive the pair below 1.3400, expect further losses with the 50-day SMA being the next support below the 200-day SMA at 1.3325, followed by 1.3300.
Pound Sterling Price This Month
The table below shows the percentage change of British Pound (GBP) against listed major currencies this month. British Pound was the strongest against the Canadian Dollar.
| USD | EUR | GBP | JPY | CAD | AUD | NZD | CHF | |
|---|---|---|---|---|---|---|---|---|
| USD | 0.98% | 0.38% | 0.98% | 1.21% | -0.57% | -0.02% | 0.63% | |
| EUR | -0.98% | -0.63% | 0.06% | 0.30% | -1.16% | -0.92% | -0.27% | |
| GBP | -0.38% | 0.63% | 0.70% | 0.95% | -0.53% | -0.29% | 0.36% | |
| JPY | -0.98% | -0.06% | -0.70% | 0.15% | -1.43% | -1.46% | -0.23% | |
| CAD | -1.21% | -0.30% | -0.95% | -0.15% | -1.57% | -1.60% | -0.57% | |
| AUD | 0.57% | 1.16% | 0.53% | 1.43% | 1.57% | 0.24% | 0.90% | |
| NZD | 0.02% | 0.92% | 0.29% | 1.46% | 1.60% | -0.24% | 0.65% | |
| CHF | -0.63% | 0.27% | -0.36% | 0.23% | 0.57% | -0.90% | -0.65% |
The heat map shows percentage changes of major currencies against each other. The base currency is picked from the left column, while the quote currency is picked from the top row. For example, if you pick the British Pound from the left column and move along the horizontal line to the US Dollar, the percentage change displayed in the box will represent GBP (base)/USD (quote).

Acuity Trading ist ein 2013 gegründetes Fintech-Unternehmen mit Sitz in London, das sich auf KI-gestützte alternative Daten und Sentiment-Analysen für Handel und Investment spezialisiert hat. Sie revolutionierten das Online-Trading mit visuellen News- und Sentiment-Tools und führen den Markt weiterhin mit alpha-generierenden alternativen Daten und hochgradig interaktiven Trading-Tools auf Basis neuester KI-Forschung an.
Weiterlesen


