
Silver Price Analysis: Uptrend holds as RSI divergence signals corrective risks
Von Christian Borjon Valencia
Veröffentlichungsdatum: 4 Dec 2025 | Änderungsdatum: 4 Dec 2025


BELIEBTE ARTIKEL

Silver price retreats late in the North American session on Wednesday even though the US Dollar weakens after data reaffirmed investors intentions that the Federal Reserve would cut rates next week. At the time of writing, XAG/USD trades at $58.49 down 0.14%.
- Silver pulls back to $58.49 after bouncing from $57.54, even as data reinforces expectations of a Fed rate cut next week.
- Mild RSI divergence signals risk of a corrective move toward the $53.80–$54.00 support zone and 50-day SMA at $50.25.
- A break above $59.00 would open the door toward the $60.00 handle and fresh all-time highs.
Silver price retreats late in the North American session on Wednesday even though the US Dollar weakens after data reaffirmed investors intentions that the Federal Reserve would cut rates next week. At the time of writing, XAG/USD trades at $58.49 down 0.14%.
XAG/USD Price Forecast: Technical outlook
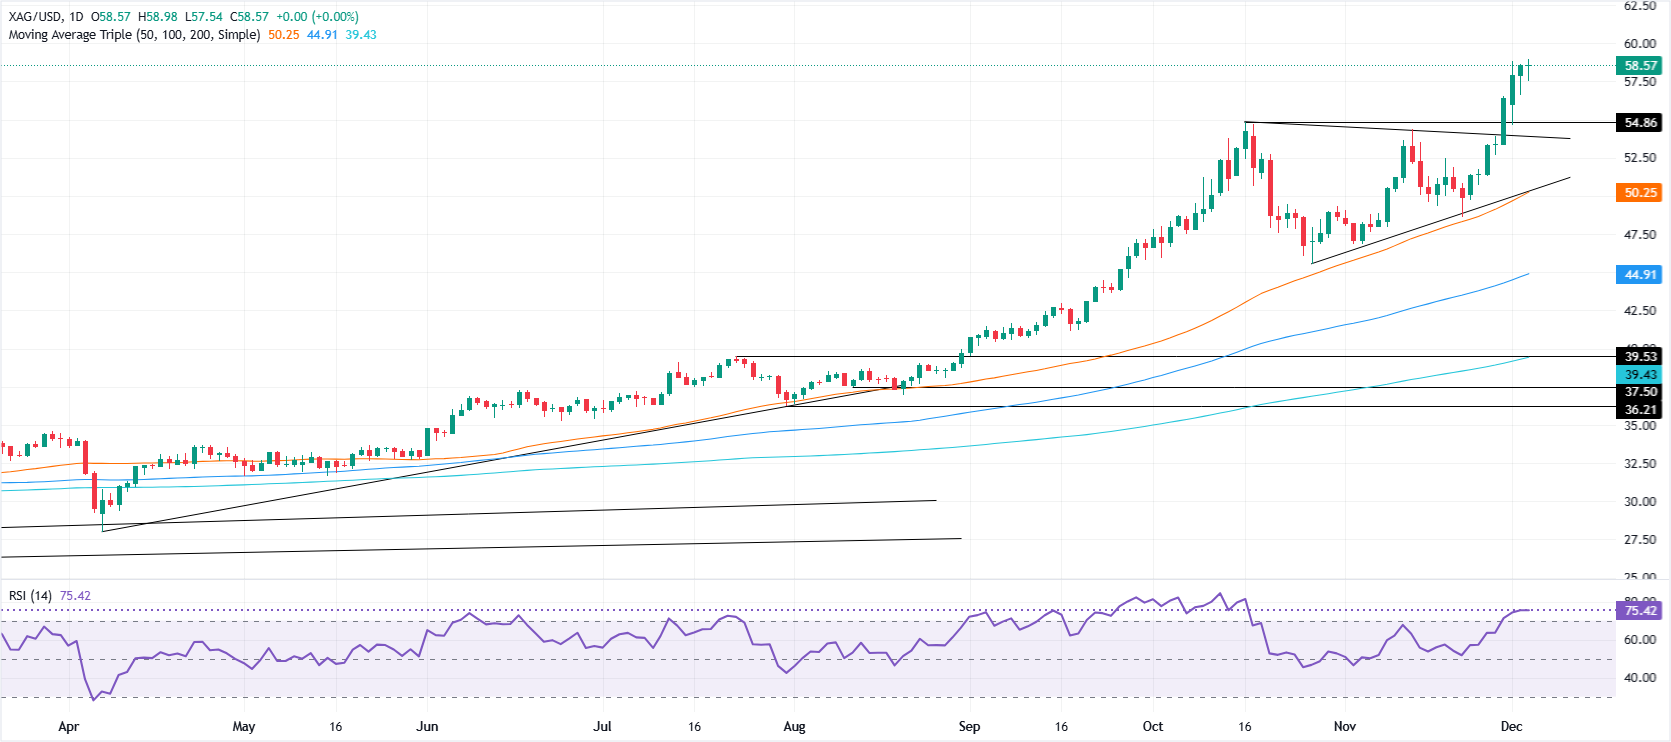
Silver price uptrend remains intact, even though the grey metal dipped towards a daily low of $57.54, before reclaiming the $58.00 figure. Bullish momentum remains in place, but a “mild divergence” between price action and the Relative Strength Index (RSI) could pave the way for a pullback.
In that outcome, sellers would eye as first key support at a previous resistance trendline turned support at around $53.80-$54.00, before testing the 50-day Simple Moving Average (SMA) at $50.25.
Conversely, if buyers clear $59.00, up next lies the $60.00 figure to refresh all-time highs.
Silver Price Chart – Daily
Silver FAQs
Silver is a precious metal highly traded among investors. It has been historically used as a store of value and a medium of exchange. Although less popular than Gold, traders may turn to Silver to diversify their investment portfolio, for its intrinsic value or as a potential hedge during high-inflation periods. Investors can buy physical Silver, in coins or in bars, or trade it through vehicles such as Exchange Traded Funds, which track its price on international markets.
Silver prices can move due to a wide range of factors. Geopolitical instability or fears of a deep recession can make Silver price escalate due to its safe-haven status, although to a lesser extent than Gold's. As a yieldless asset, Silver tends to rise with lower interest rates. Its moves also depend on how the US Dollar (USD) behaves as the asset is priced in dollars (XAG/USD). A strong Dollar tends to keep the price of Silver at bay, whereas a weaker Dollar is likely to propel prices up. Other factors such as investment demand, mining supply – Silver is much more abundant than Gold – and recycling rates can also affect prices.
Silver is widely used in industry, particularly in sectors such as electronics or solar energy, as it has one of the highest electric conductivity of all metals – more than Copper and Gold. A surge in demand can increase prices, while a decline tends to lower them. Dynamics in the US, Chinese and Indian economies can also contribute to price swings: for the US and particularly China, their big industrial sectors use Silver in various processes; in India, consumers’ demand for the precious metal for jewellery also plays a key role in setting prices.
Silver prices tend to follow Gold's moves. When Gold prices rise, Silver typically follows suit, as their status as safe-haven assets is similar. The Gold/Silver ratio, which shows the number of ounces of Silver needed to equal the value of one ounce of Gold, may help to determine the relative valuation between both metals. Some investors may consider a high ratio as an indicator that Silver is undervalued, or Gold is overvalued. On the contrary, a low ratio might suggest that Gold is undervalued relative to Silver.

Acuity Trading ist ein 2013 gegründetes Fintech-Unternehmen mit Sitz in London, das sich auf KI-gestützte alternative Daten und Sentiment-Analysen für Handel und Investment spezialisiert hat. Sie revolutionierten das Online-Trading mit visuellen News- und Sentiment-Tools und führen den Markt weiterhin mit alpha-generierenden alternativen Daten und hochgradig interaktiven Trading-Tools auf Basis neuester KI-Forschung an.
Weiterlesen


