
Top 3 Price Prediction: Bitcoin, Ethereum, Ripple – BTC, ETH and XRP consolidate with short-term cautious bullish bias
Von Manish Chhetri
Veröffentlichungsdatum: 27 Feb 2026 | Änderungsdatum: 27 Feb 2026


BELIEBTE ARTIKEL

Bitcoin (BTC), Ethereum (ETH) and Ripple (XRP) are consolidating near key technical areas on Friday, showing mild signs of stabilization after recent volatility.
- Bitcoin steadies at $67,300 on Friday after slipping slightly so far this week.
- Ethereum hovers around $2,000 after being rejected by the upper consolidation boundary at $2,149.
- XRP is stabilizing at $1.40 following a recent recovery around a key support area.
Bitcoin (BTC), Ethereum (ETH) and Ripple (XRP) are consolidating near key technical areas on Friday, showing mild signs of stabilization after recent volatility. BTC holds above $67,000 despite mild losses so far this week, while ETH hovers around $2,000 after a rejection near its upper consolidation boundary. Meanwhile, XRP steadies at $1.40 after finding support around a key level. The price action of these top three cryptocurrencies by market capitalization suggests a cautiously constructive tone as traders await a key catalyst that could pave the way for further upside moves.
Bitcoin moves back inside the consolidation range
Bitcoin price broke and closed below the lower consolidation boundary at $65,729 on Monday and declined slightly, hitting a daily low of $62,510 the next day. However, BTC price rebounded sharply on Wednesday, recovering Monday’s losses and closed above $67,900. After such a massive move, BTC declined slightly the next day and, as of Friday, steadies at around $67,400.
If BTC continues its recovery, it could extend the advance toward the upper boundary of the consolidation range at $71,746.
The Relative Strength Index (RSI) reads 41, rebounding from the oversold territory earlier this week, indicating fading bearish momentum. For the recovery rally to be sustained, the RSI must move above the 50 neutral level. The Moving Average Convergence Divergence (MACD) showed a bullish crossover that remains intact, suggesting a positive outlook.
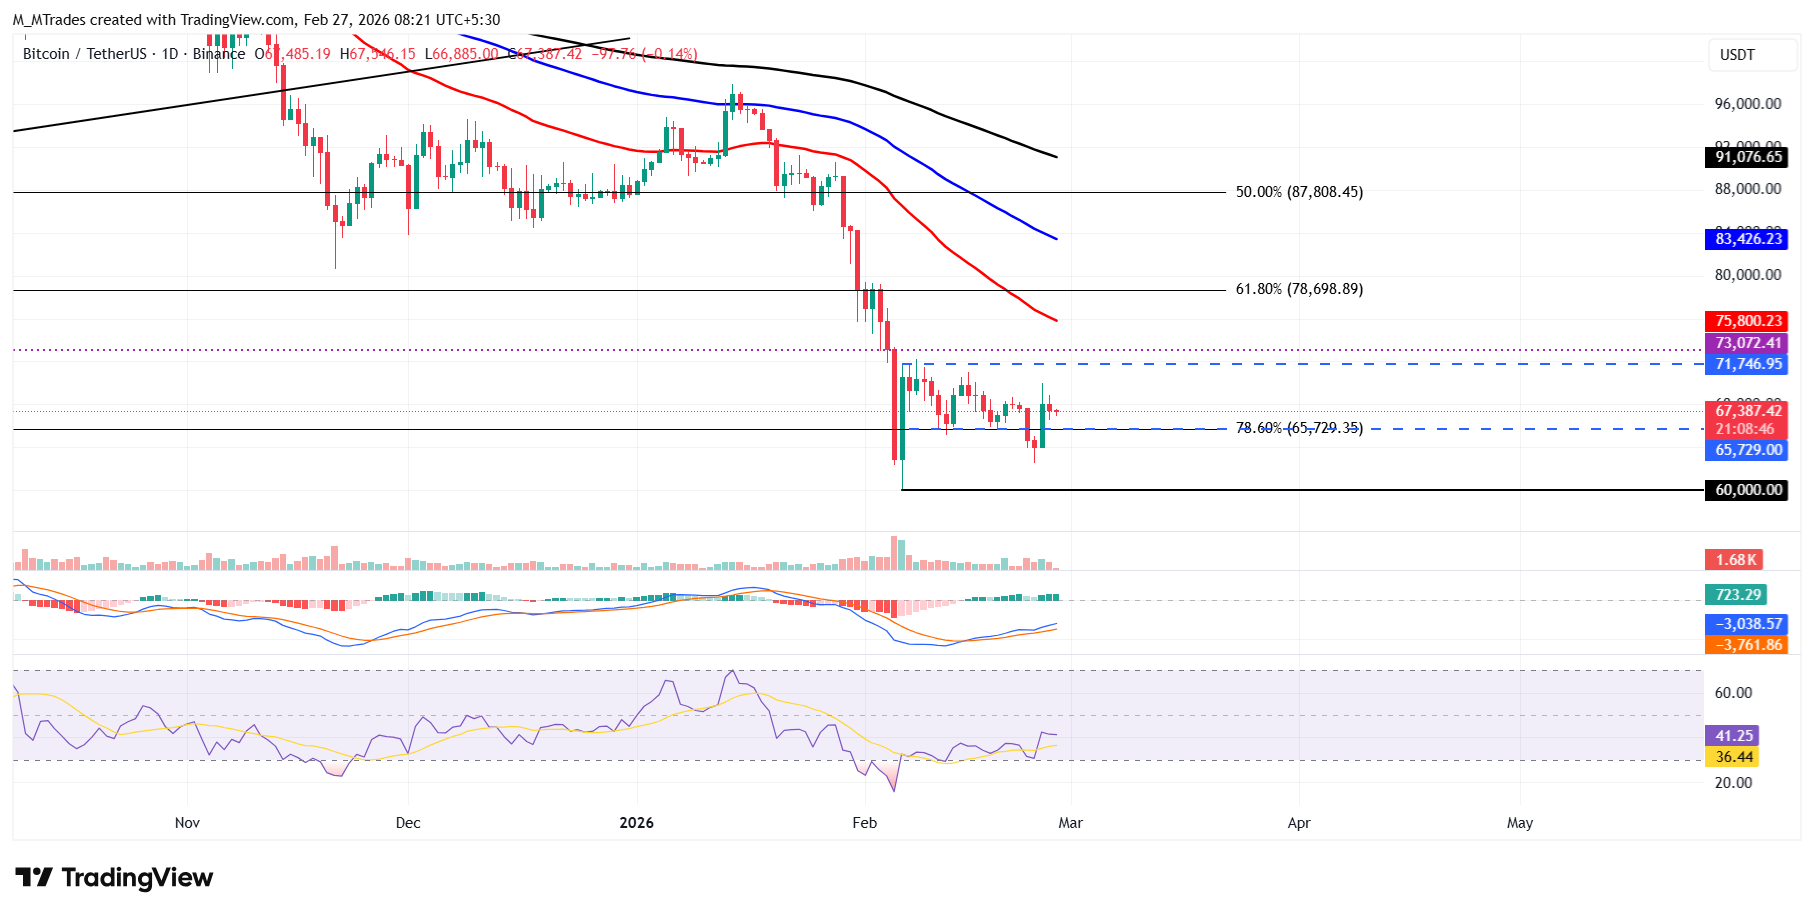
However, if BTC fails to close above the lower consolidation range at $65,729, it could extend the decline toward Tuesday’s low at $62,510. A close below this level could extend further losses toward the key support level at $60,000.
Ethereum faces rejection from the upper consolidation range
Ethereum price began the week on a negative note, declining nearly 6% through Tuesday and nearing the lower consolidation boundary at $1,747. ETH rebounded by more than 11% on Wednesday, retesting the upper consolidation range at $2,149 and declined slightly the next day. As of Friday, ETH is trading around $2,000.
If ETH recovers, it could extend the advance toward the upper consolidation range at $2,149. A close above this level could extend the advance toward the 50-day Exponential Moving Average (EMA) at $2,363.
Like Bitcoin, ETH’s RSI and MACD indicate fading bearish momentum, hinting at a possible recovery ahead.
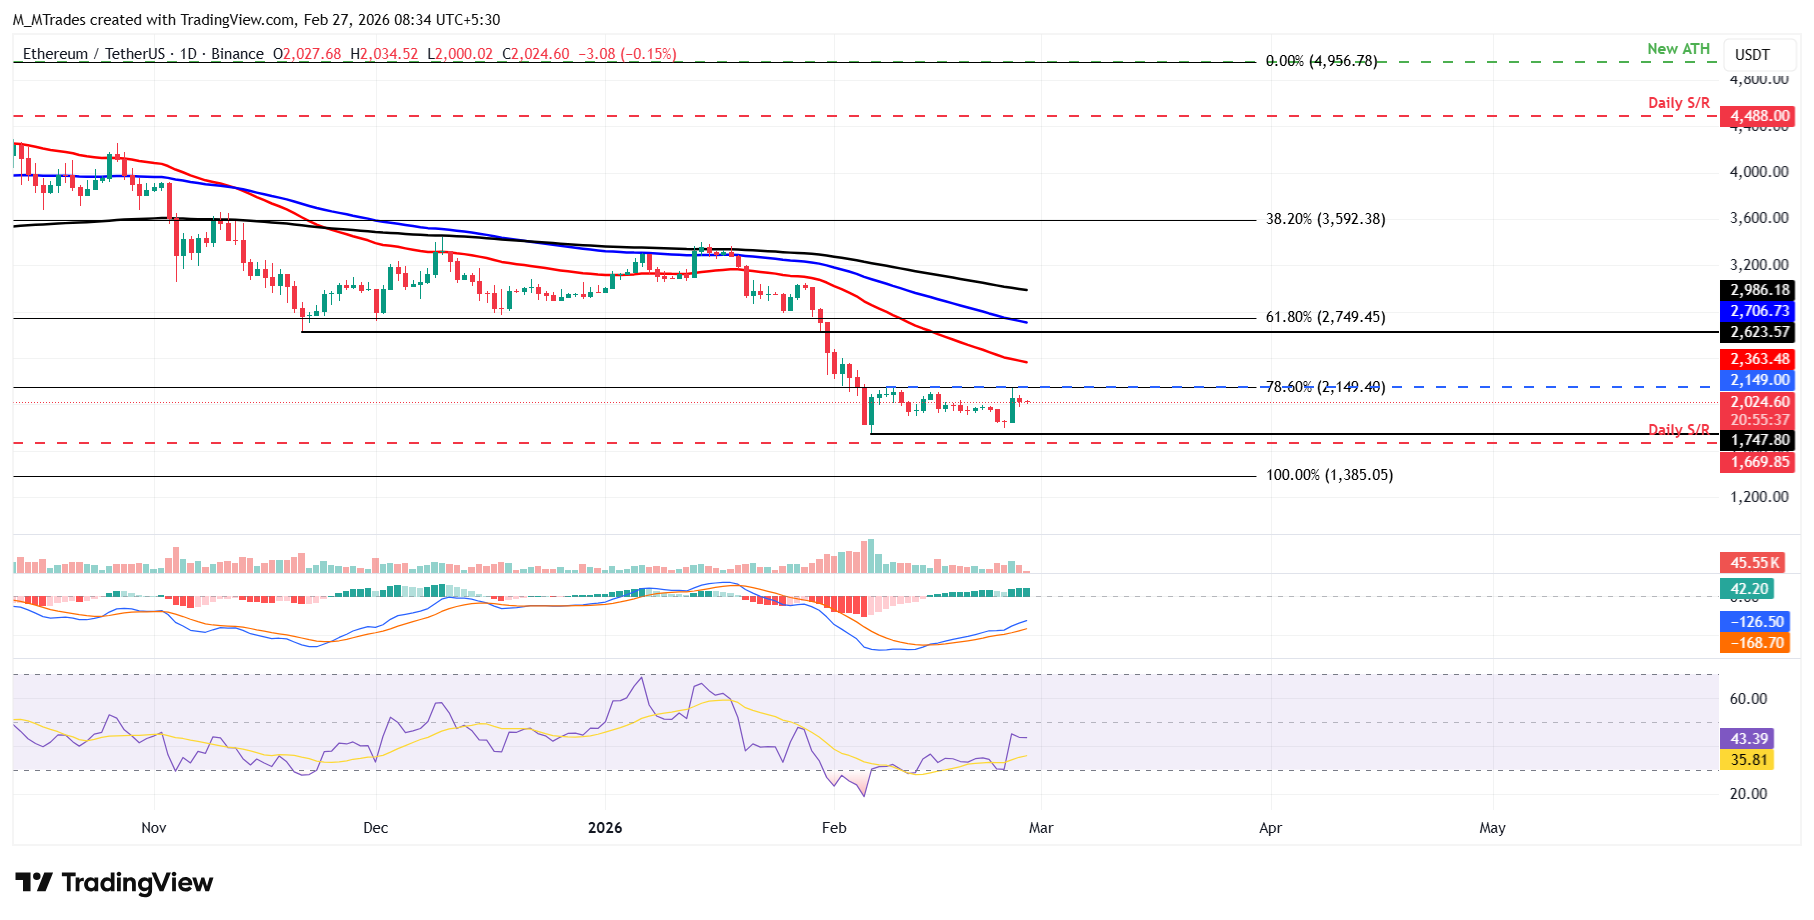
On the other hand, if ETH corrects, it could extend the decline toward the lower consolidation range at $1,747.
XRP rebounds after finding support around the weekly level
XRP price closed below the lower trendline boundary of a falling wedge on Monday and declined slightly, nearing the weekly support at $1.30 the next day. On Wednesday, XRP rebounded by more than 6%, but it declined slightly the next day. As of writing on Friday, XRP is trading at $1.40.
If the lower trendline boundary holds as support, it could extend the recovery toward the key psychological level at $1.50.
Like Bitcoin and Ethereum, XRP’s momentum indicators also signal a fading bearish bias, likely supporting the recovery thesis.
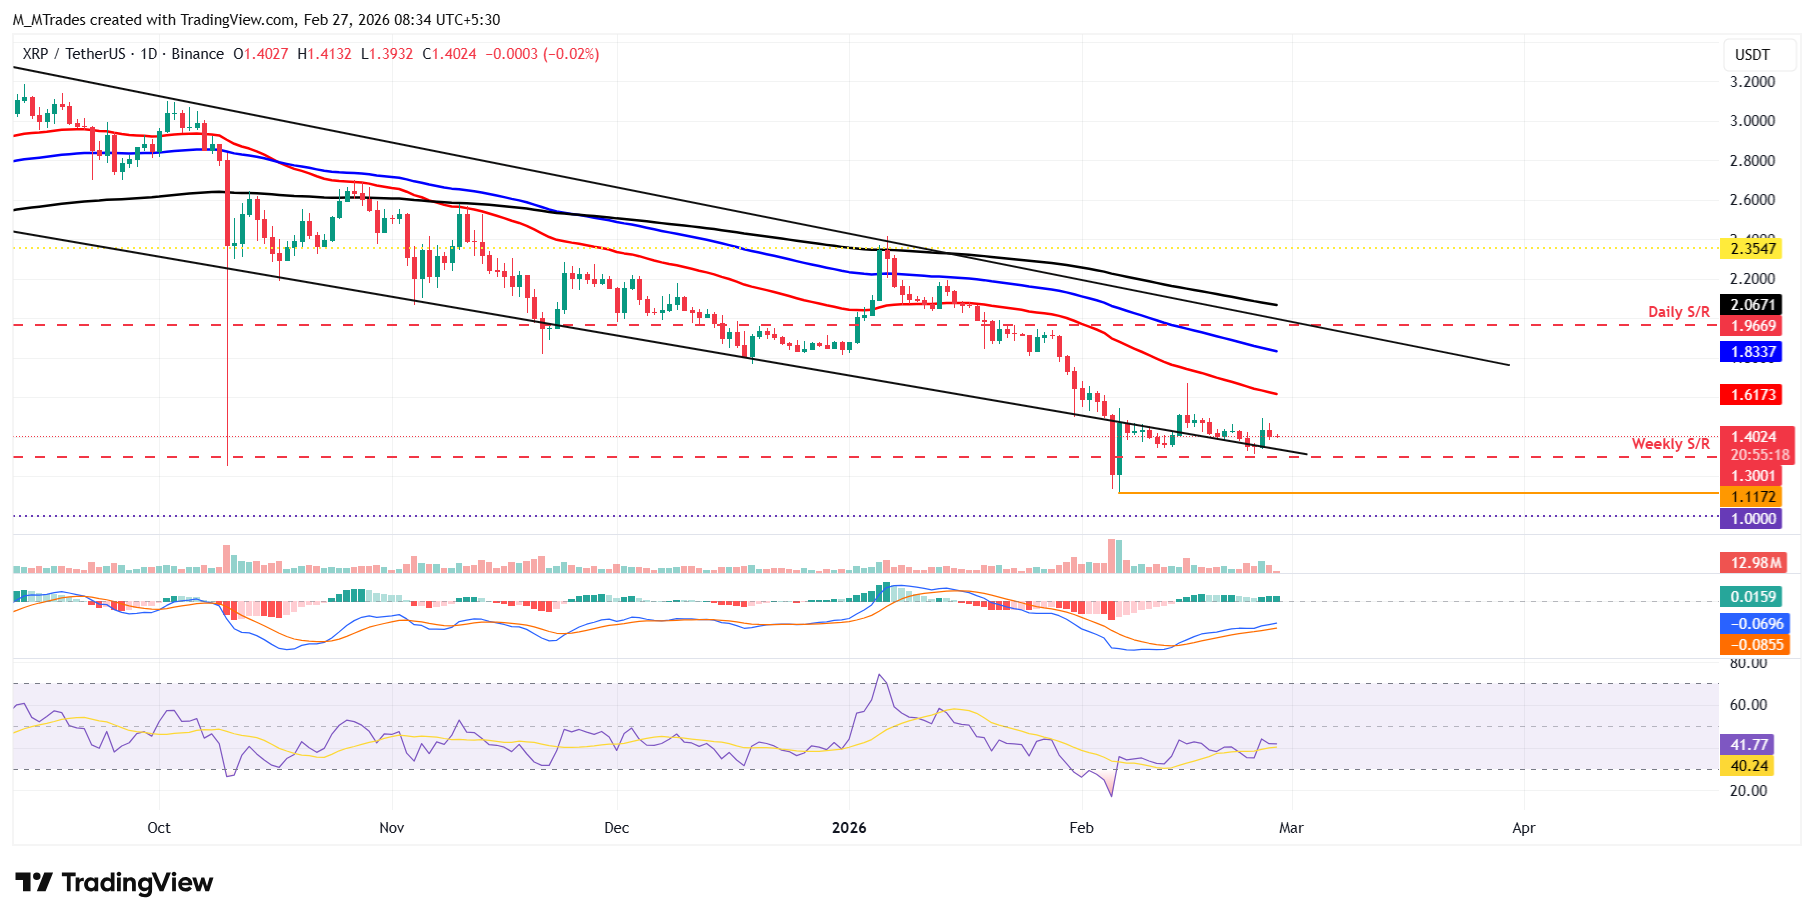
On the downside, if XRP fails to find support around the trendline and corrects, it could extend the decline toward the weekly support at $1.30. A close below this level could extend the losses toward the February 6 low of $1.11.
Cryptocurrency metrics FAQs
The developer or creator of each cryptocurrency decides on the total number of tokens that can be minted or issued. Only a certain number of these assets can be minted by mining, staking or other mechanisms. This is defined by the algorithm of the underlying blockchain technology. On the other hand, circulating supply can also be decreased via actions such as burning tokens, or mistakenly sending assets to addresses of other incompatible blockchains.
Market capitalization is the result of multiplying the circulating supply of a certain asset by the asset’s current market value.
Trading volume refers to the total number of tokens for a specific asset that has been transacted or exchanged between buyers and sellers within set trading hours, for example, 24 hours. It is used to gauge market sentiment, this metric combines all volumes on centralized exchanges and decentralized exchanges. Increasing trading volume often denotes the demand for a certain asset as more people are buying and selling the cryptocurrency.
Funding rates are a concept designed to encourage traders to take positions and ensure perpetual contract prices match spot markets. It defines a mechanism by exchanges to ensure that future prices and index prices periodic payments regularly converge. When the funding rate is positive, the price of the perpetual contract is higher than the mark price. This means traders who are bullish and have opened long positions pay traders who are in short positions. On the other hand, a negative funding rate means perpetual prices are below the mark price, and hence traders with short positions pay traders who have opened long positions.

Acuity Trading ist ein 2013 gegründetes Fintech-Unternehmen mit Sitz in London, das sich auf KI-gestützte alternative Daten und Sentiment-Analysen für Handel und Investment spezialisiert hat. Sie revolutionierten das Online-Trading mit visuellen News- und Sentiment-Tools und führen den Markt weiterhin mit alpha-generierenden alternativen Daten und hochgradig interaktiven Trading-Tools auf Basis neuester KI-Forschung an.
Weiterlesen


