
Cardano Price Forecast: ADA declines despite record high whale holding
Von Vishal Dixit
Aktualisiert: 14 May 2026


BELIEBTE ARTIKEL

Cardano (ADA) edges lower on Thursday, facing consistent selling pressure so far this week. On-chain data shows persistent buying from large wallet investors, with holdings expanding to a record high, while derivatives data shows short-term weakness on the retail side.
- Cardano tests its 50-day EMA at $0.2603 on Thursday amid a steady decline so far this week.
- Derivatives data reflects risk-off behavior in the retail space as leverage-driven Open Interest shrinks amid heightened liquidation.
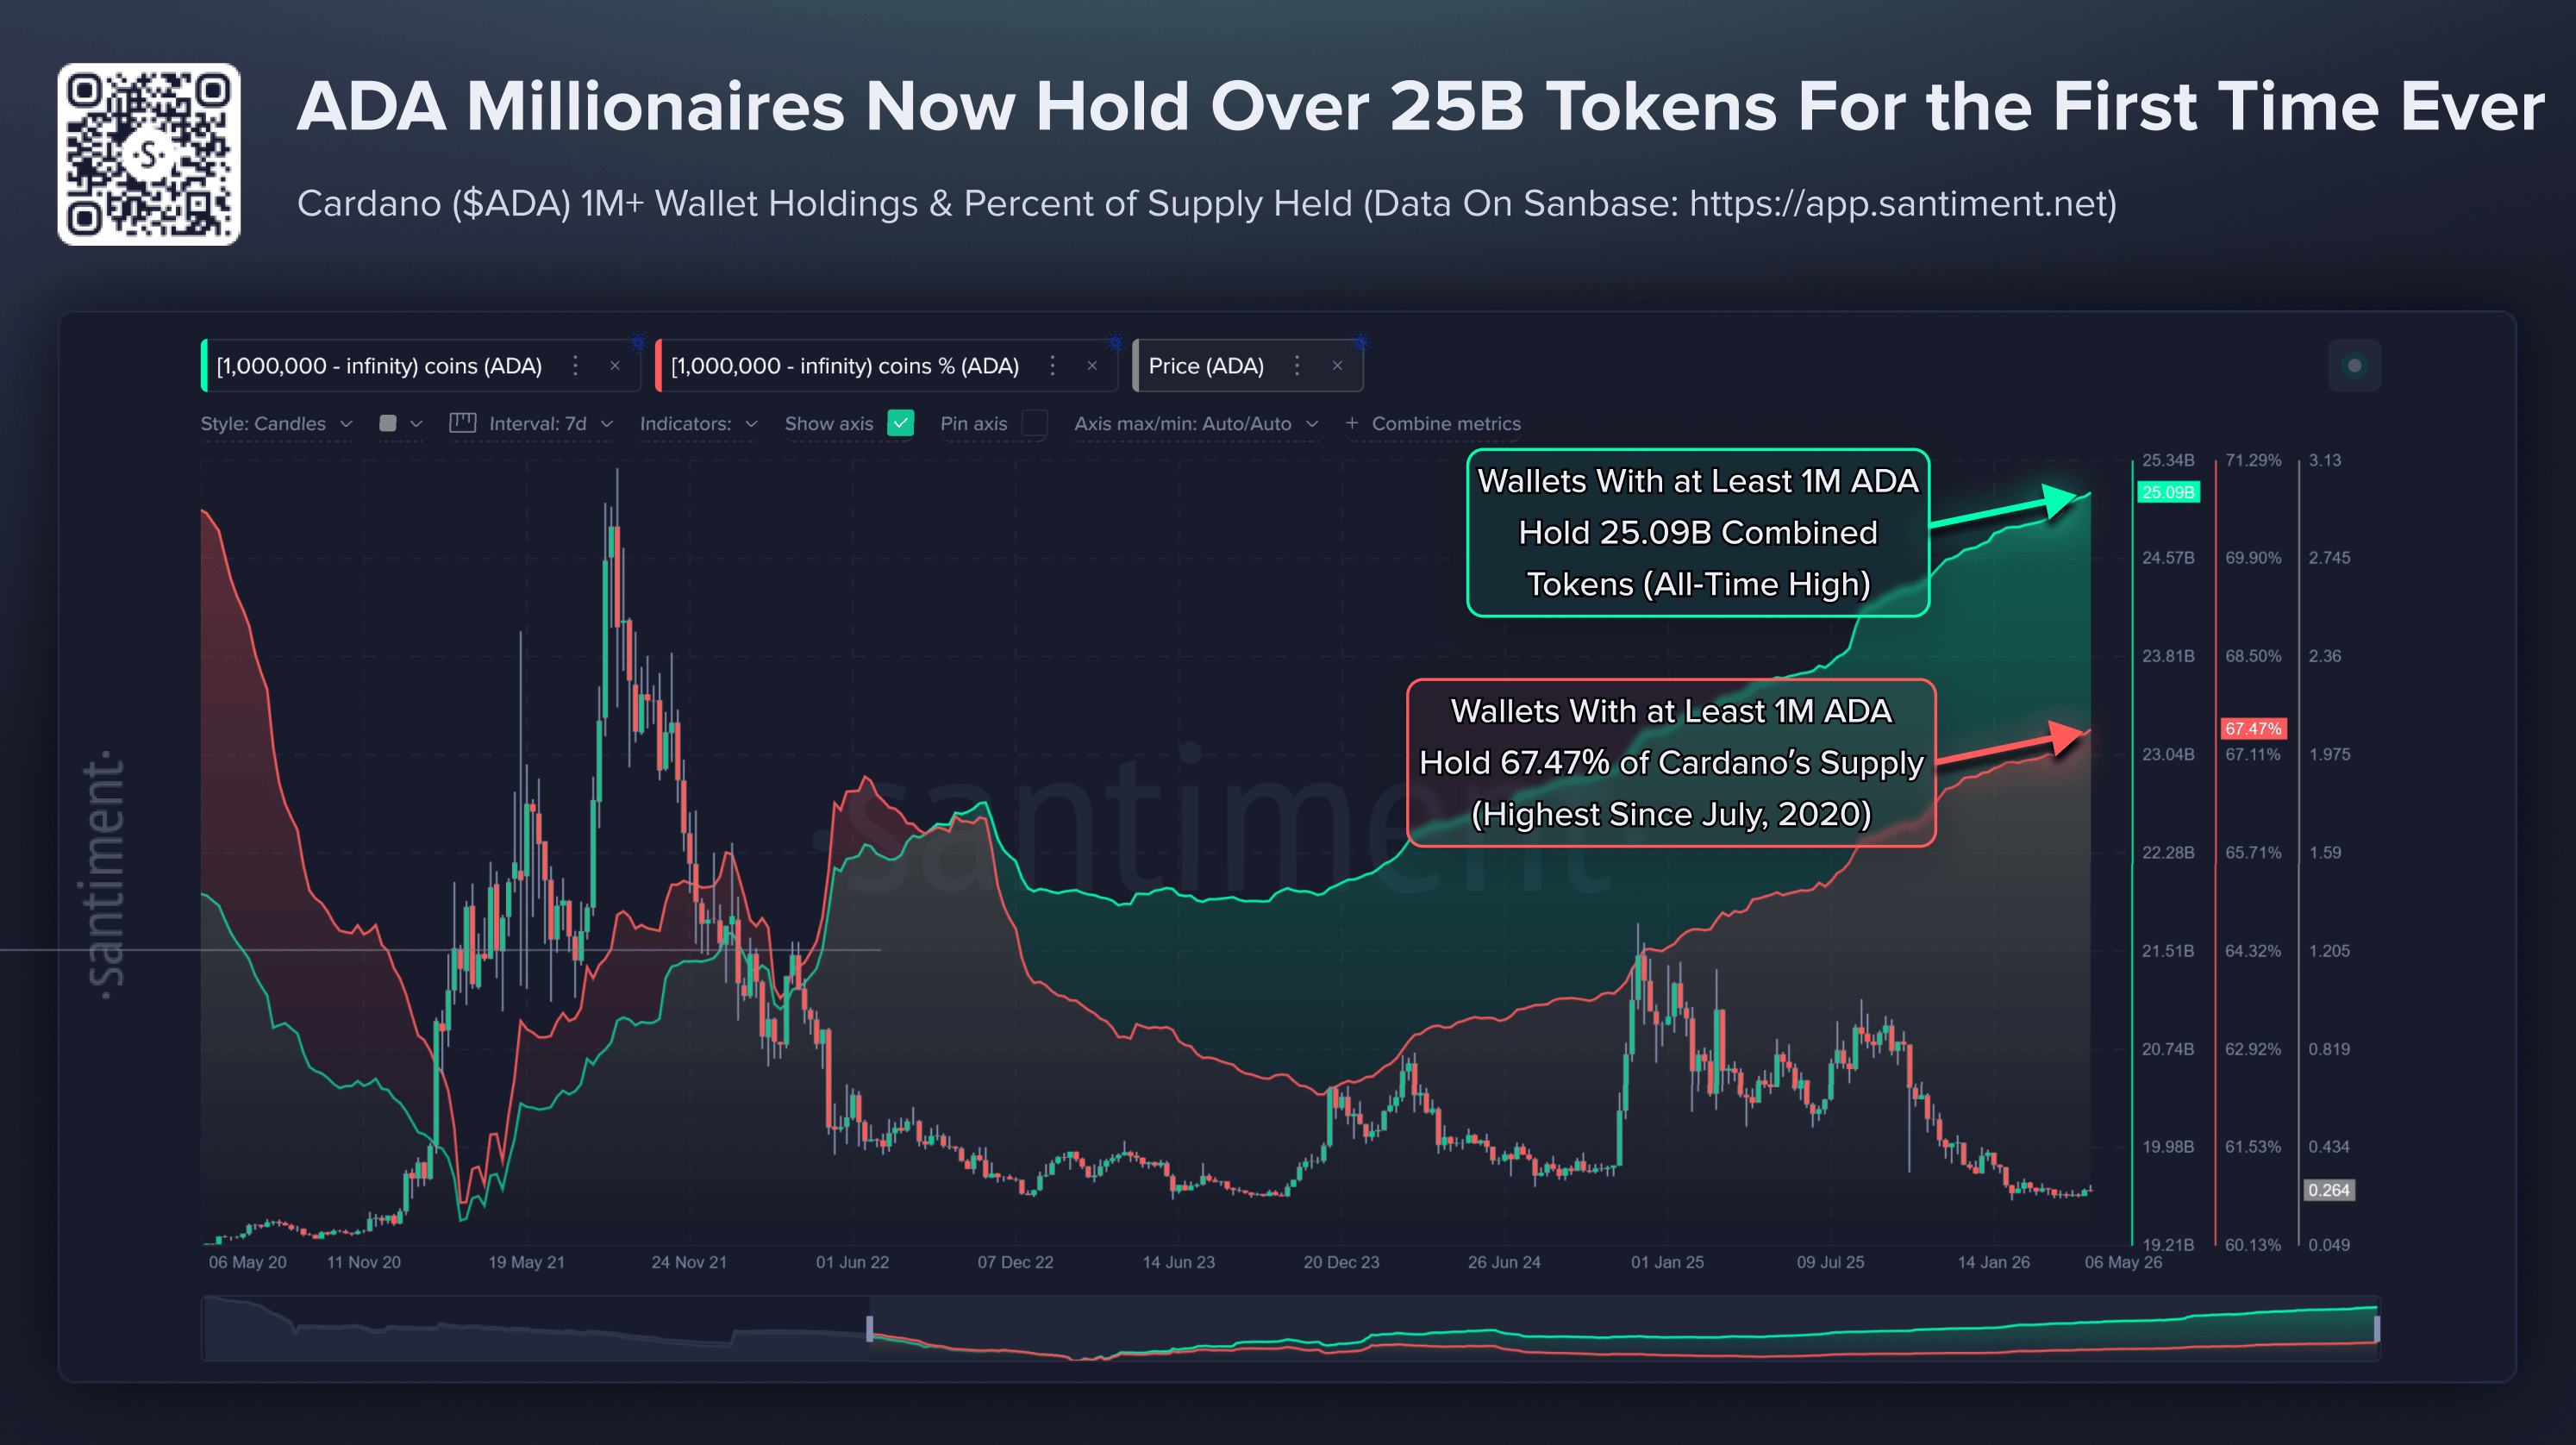
- Cardano whales with over 1 million ADA tokens reach a record high holding amid a steady buy-the-dip strategy.
Cardano (ADA) edges lower on Thursday, facing consistent selling pressure so far this week. On-chain data shows persistent buying from large wallet investors, with holdings expanding to a record high, while derivatives data shows short-term weakness on the retail side.
Cardano should sustain above its 50-day Exponential Moving Average (EMA) at $0.2603 to retain a constructive bias.
Cardano whales buy the dip while retail confidence declines
Large wallet investors, commonly referred to as whales, are dominating the ADA supply. Santiment data shows that whale addresses holding over 1 million ADA tokens hold 25.09 billion ADA, roughly 67% of the ADA supply.
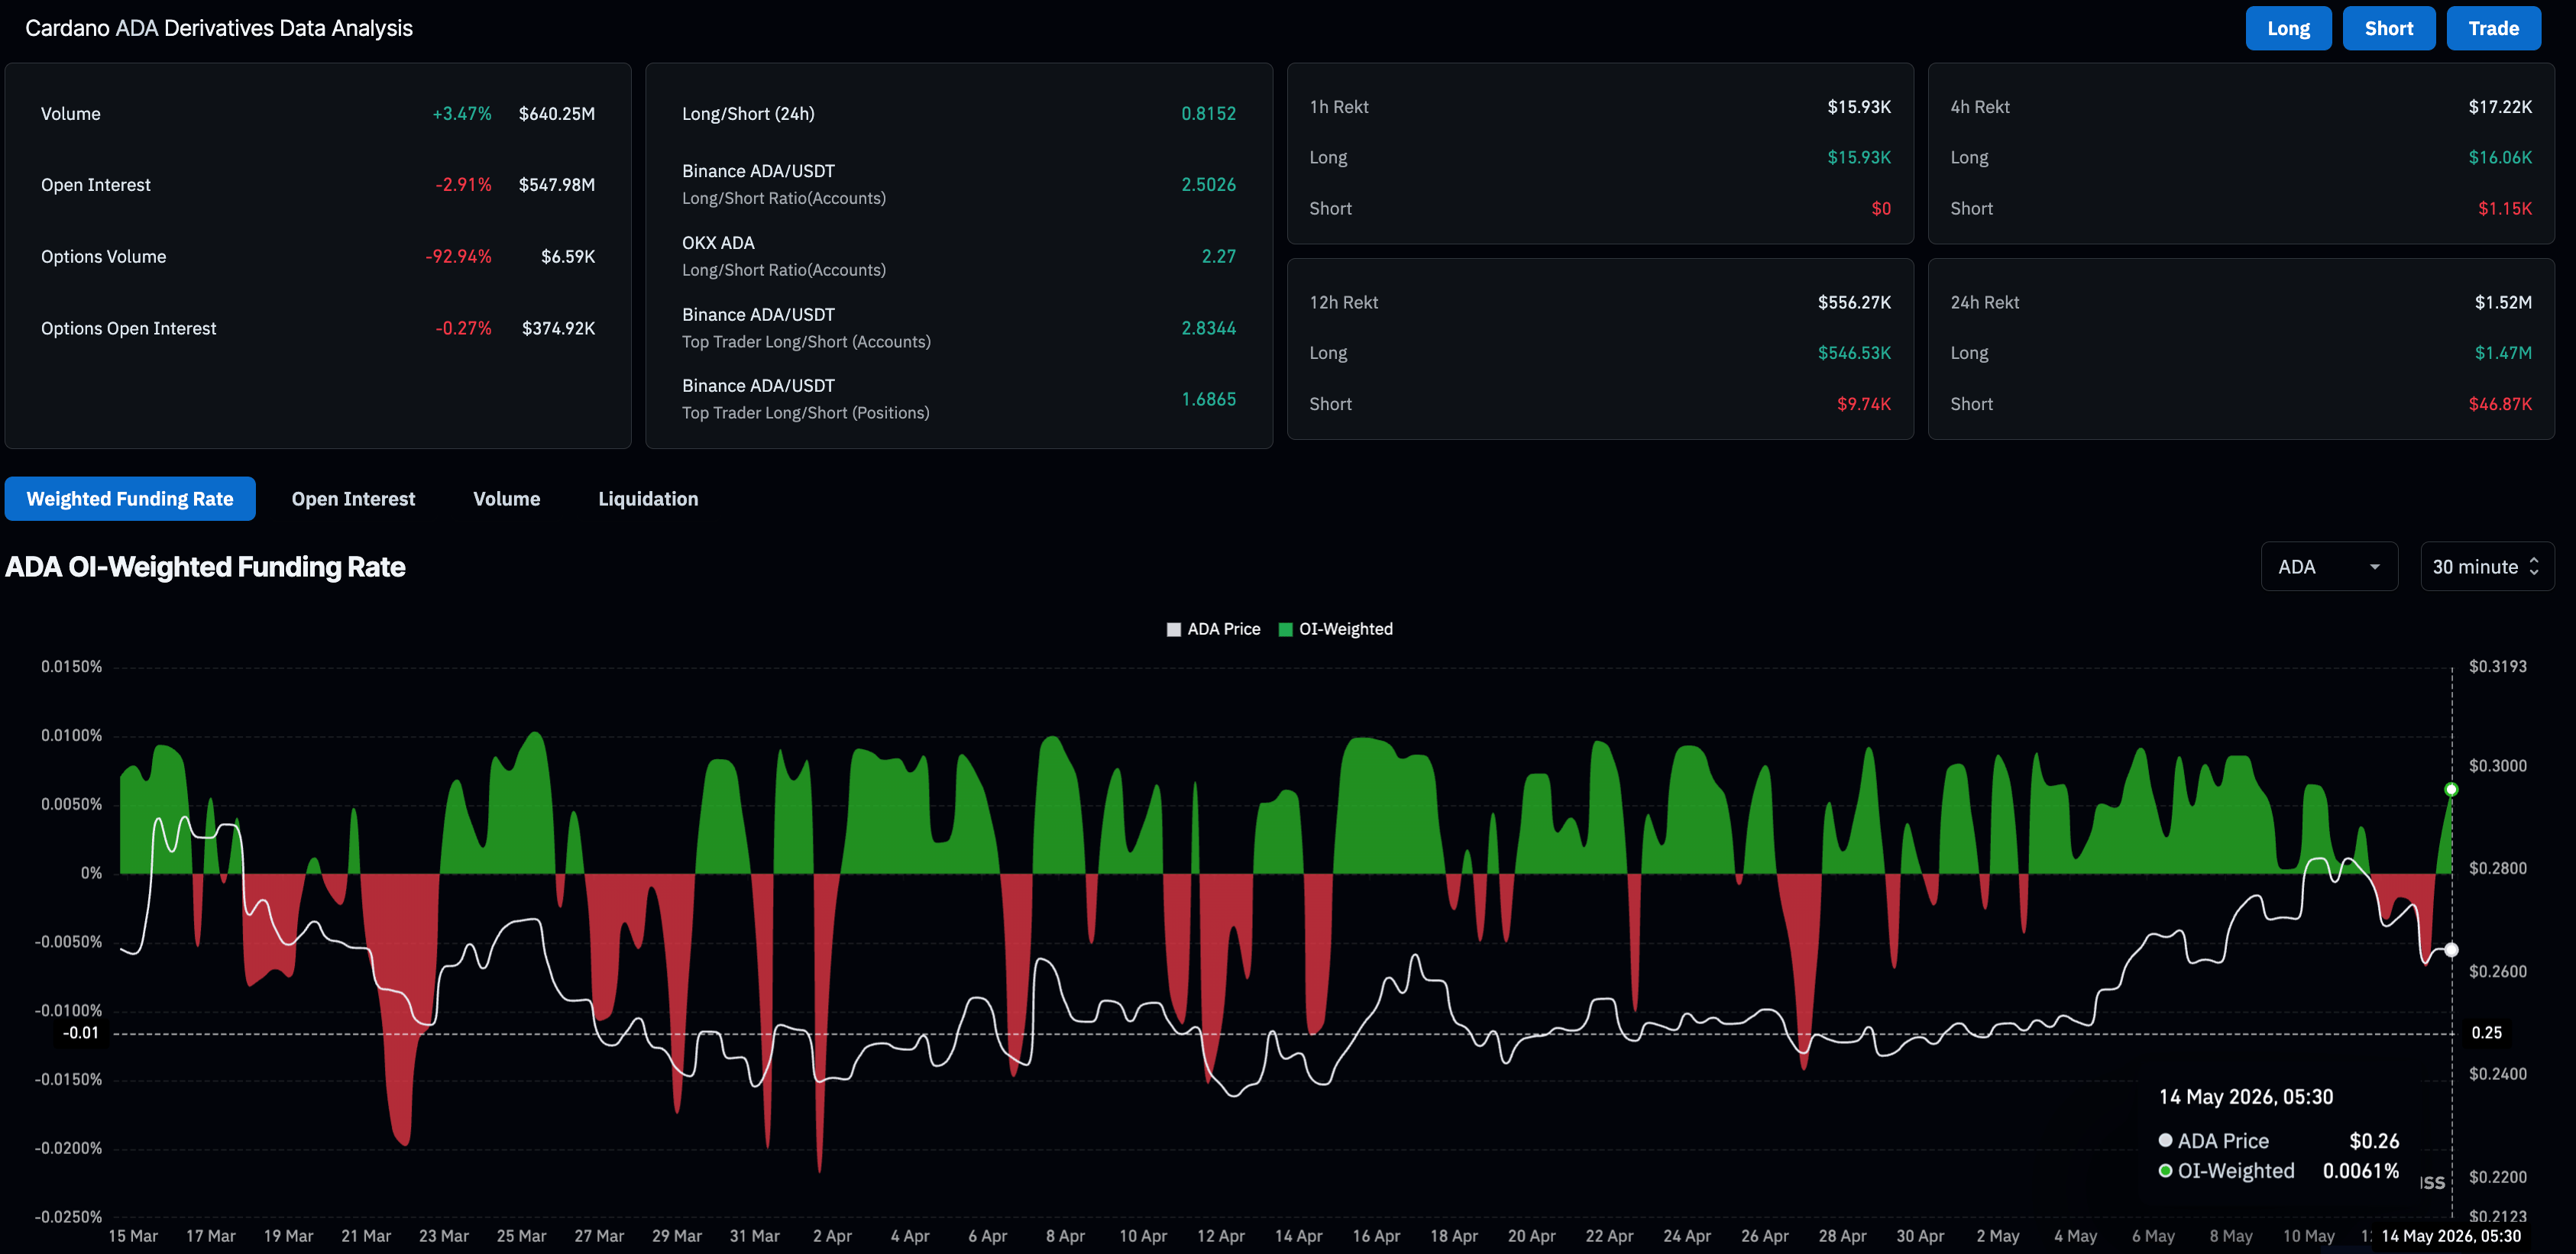
On the derivatives side, ADA futures Open Interest (OI) is down almost 3% over the last 24 hours to $547.98 million, indicating a positional wipeout led by $1.47 million of long liquidations during the same period. However, the funding rates have flipped positive to 0.0061%, suggesting anticipation of a rebound among investors.
In short, retail demand wobbles while whales maintain a long-term perspective.
Technical outlook: Will Cardano hold above its 50-day EMA?
Cardano holds just above the 50-day Exponential Moving Average (EMA) near $0.2603 and the Bollinger middle band around $0.2593, keeping the near-term tone broadly neutral. Upside attempts remain constrained within a medium-term corrective context as ADA remains well below the 100-day EMA at roughly $0.2858 and the 200-day EMA near $0.3762.
Momentum indicators on the daily chart suggest a reducing bullish momentum as the Relative Strength Index (RSI) at 53 slips toward the midline from overbought levels, while the Moving Average Convergence Divergence (MACD) approaches the signal line for a potential bearish crossover.
On the downside, initial support is seen at the 50-day EMA near $0.2603 and the Bollinger middle band near $0.2593, with the Bollinger lower band around $0.2357 providing a deeper cushion should sellers regain control.
On the topside, immediate resistance emerges at the Bollinger upper band around $0.2828, ahead of the 100-day EMA at about $0.2858, while the 200-day EMA near $0.3762 marks a more distant barrier that would need to be reclaimed to reinstate a sustained bullish trend.
(The technical analysis of this story was written with the help of an AI tool.)

Über eine Million Nutzer verlassen sich auf FXStreet für Echtzeit-Marktdaten, Charting-Tools, Experteneinblicke und Forex-News. Der umfassende Wirtschaftskalender und die Bildungs-Webinare helfen Tradern, informiert zu bleiben und fundierte Entscheidungen zu treffen. FXStreet wird von einem Team von rund 60 Fachleuten getragen, verteilt auf den Hauptsitz in Barcelona und verschiedene Regionen weltweit.
Weiterlesen


