
Cardano Price Forecast: Whale selling, cautious derivatives limit ADA rebound
Von Manish Chhetri
Aktualisiert: 12 Jun 2026


BELIEBTE ARTIKEL

Cardano (ADA) is trading near $0.170 at the time of writing on Friday after staging a modest rebound from last week's sharp correction. However, the recovery remains fragile as large holders have resumed reducing their positions, adding fresh selling pressure to ADA.
- Cardano price nears $0.170 on Friday after a modest rebound from last week's sharp correction.
- Santiment data shows that whales have resumed offloading ADA tokens, increasing selling pressure.
- Mixed derivatives metrics suggest traders remain cautious, capping ADA's potential recovery.
Cardano (ADA) is trading near $0.170 at the time of writing on Friday after staging a modest rebound from last week's sharp correction. However, the recovery remains fragile as large holders have resumed reducing their positions, adding fresh selling pressure to ADA. Meanwhile, mixed signals from derivatives markets suggest traders remain cautious, capping ADA’s recovery potential.
Whales offload ADA tokens
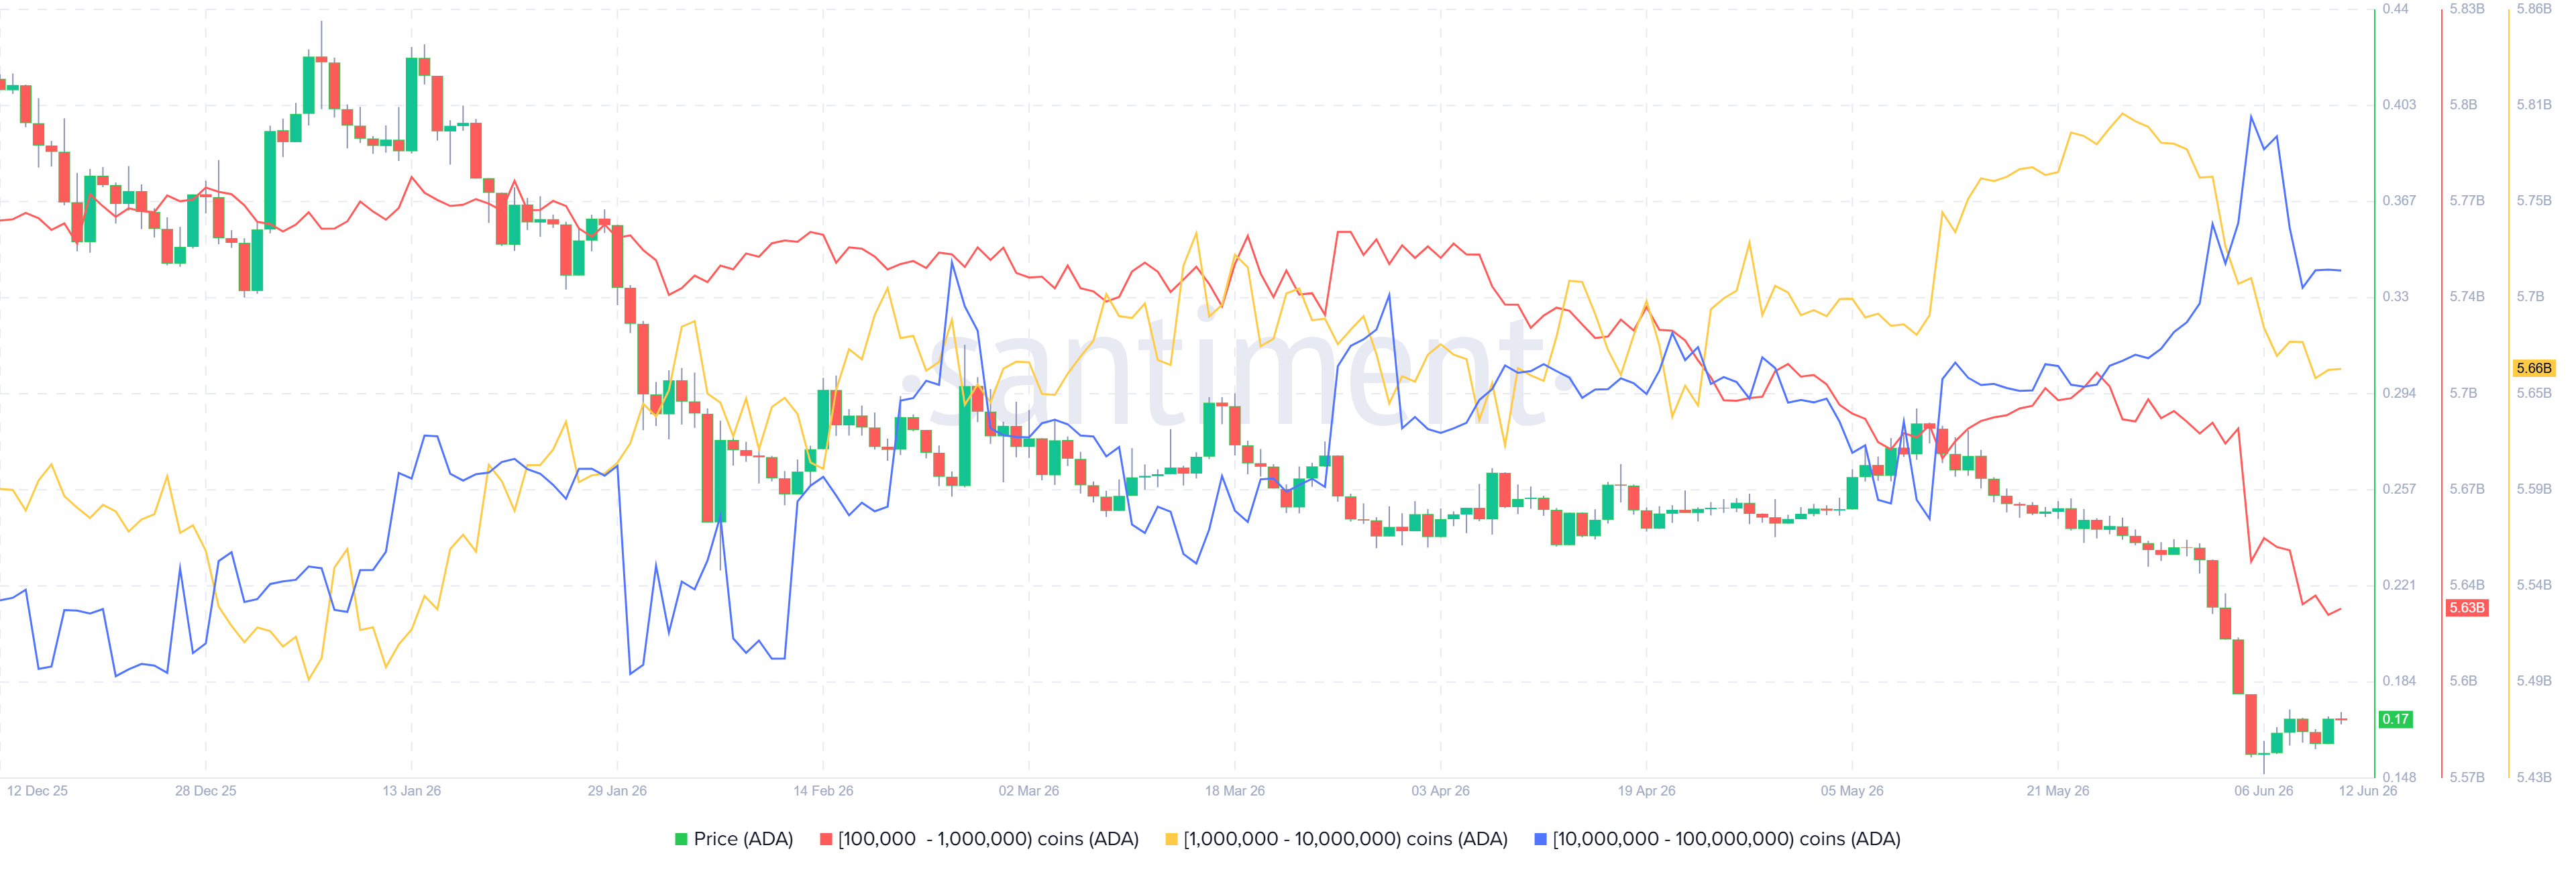
Santiment’s Supply Distribution data shows that whale wallets resumed offloading ADA tokens after last week’s correction.
The metric indicates that whales holding between 100,000 and 1 million (red line), 1 million and 10 million (yellow line) and 10 million and 100 million ADA tokens have shed 260 million tokens since June 5, fueling the near-term selling pressure.
Mixed derivatives metrics cap ADA recovery
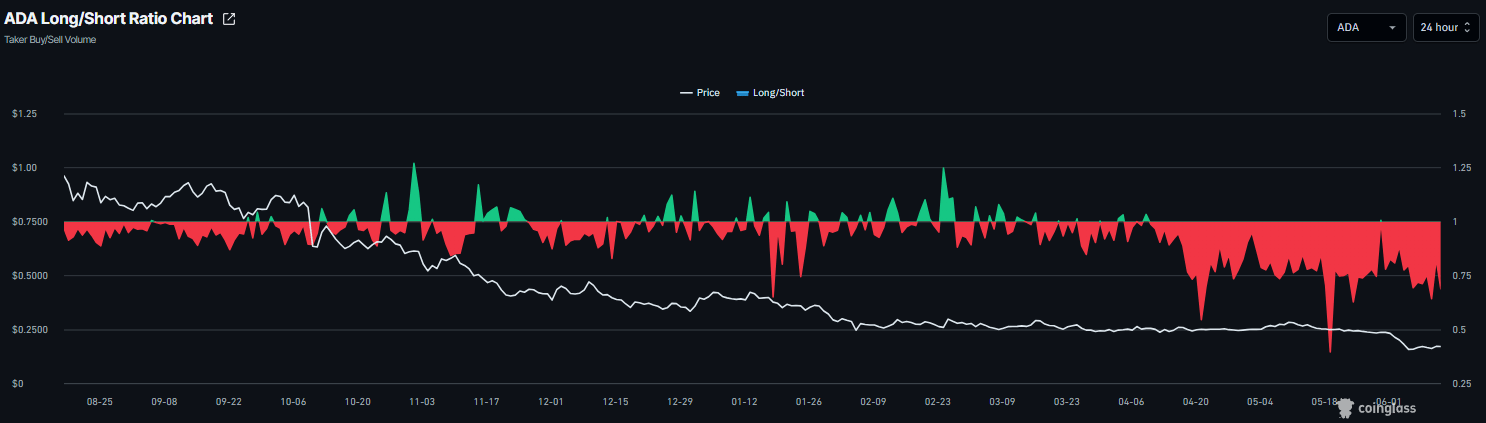
On the derivatives side, Cardano data show mixed sentiment. CoinGlass’ long-to-short ratio for ADA reads 0.68 on Friday, nearing its lowest level in over a month. This ratio, being below one, reflects bearish sentiment in the market, as more traders are betting on the asset’s price to fall.
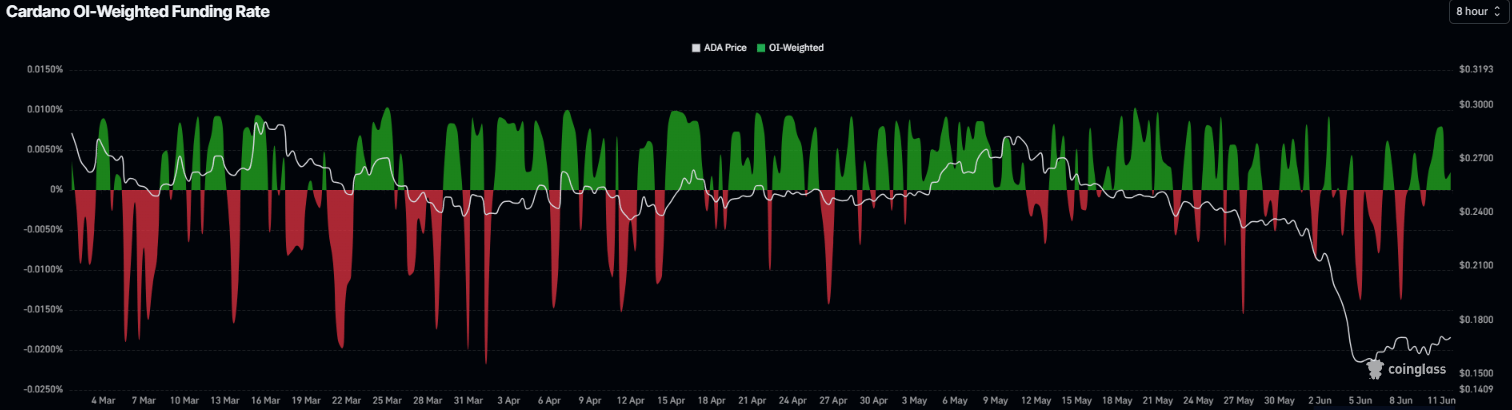
However, the funding rates data show improving sentiment. CoinGlass’ OI-Weighted Funding Rate data for ADA flipped positive on Wednesday, reading 0.0022%on Friday. This positive rate indicates that longs are paying shorts and projecting a bullish sentiment.
The above-mentioned combination suggests indecision among Cardano investors and a lack of clear directional bias.
Cardano Price Forecast: Is ADA gearing up for a deeper correction?
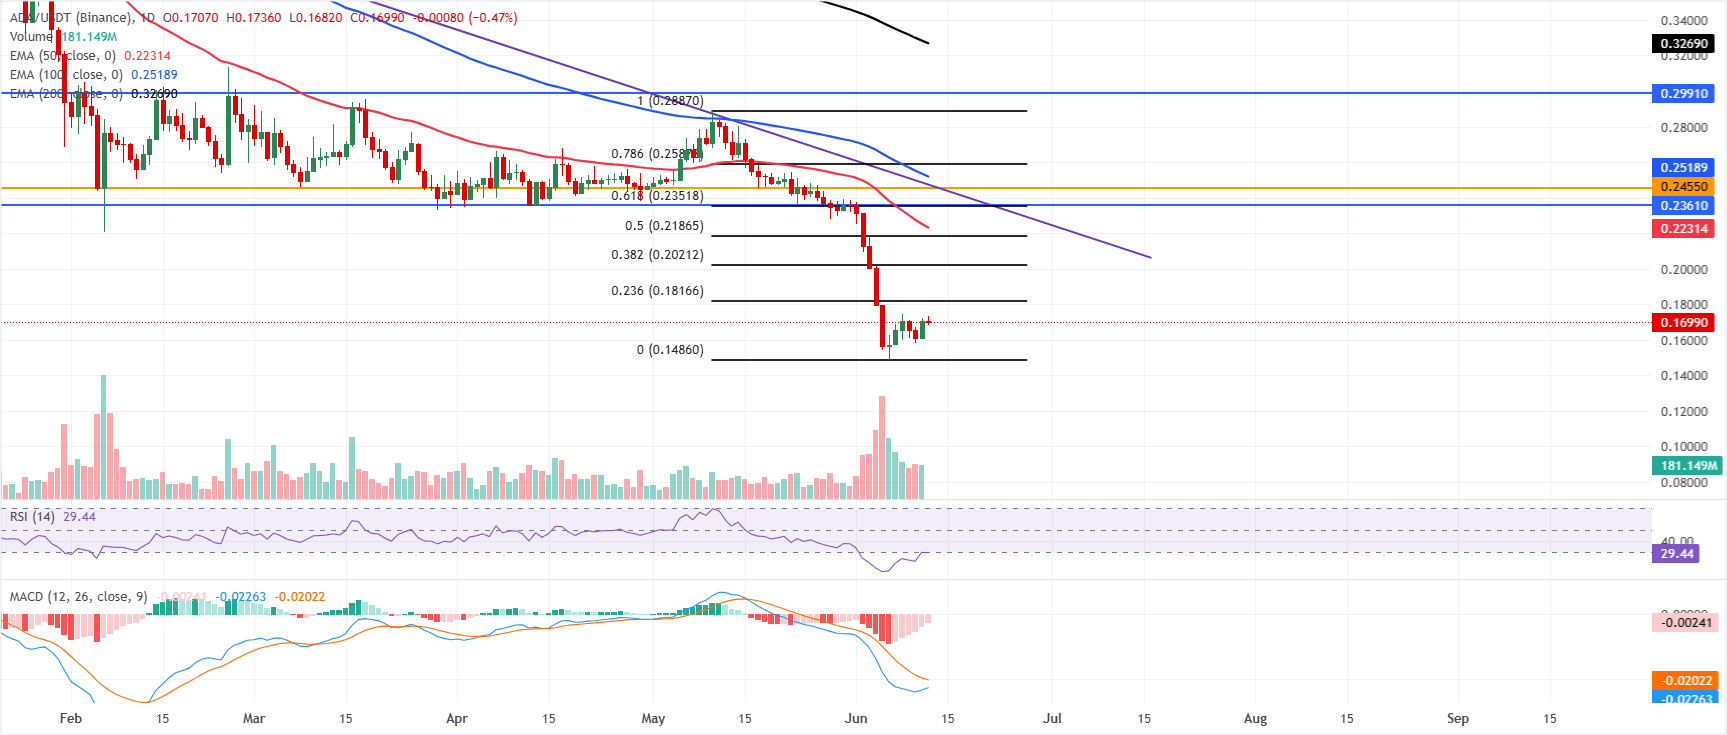
Cardano price trades at $0.169 on Friday, extending a dominant bearish phase after breaking decisively below prior range floors. ADA sits well below the 50-day, 100-day, and 200-day Exponential Moving Averages, which cluster between roughly $0.220 and $0.330, reinforcing a heavy topside cap.
Momentum remains weak, with the Relative Strength Index (RSI) on the daily chart hovering just below the 30 line and the Moving Average Convergence Divergence (MACD) still negative, hinting that downside pressure persists even as conditions edge toward oversold territory.
On the topside, initial resistance is now aligned with the 23.6% Fibonacci retracement at $0.181, followed by the $0.202 and $0.218 retracement levels that mark intermediate recovery checkpoints. The 50-day EMA at $0.223, the 61.8% Fibonacci retracement at $0.235, and the nearby horizontal barrier at $0.236 form a dense supply band ahead of $0.245–$0.246, where a horizontal level and the broken downtrend line converge, capping the broader bearish structure.
On the downside, the only notable technical floor lies at the recent swing anchor near $0.148, where buyers may attempt to stabilize the decline if selling resumes.
(The technical analysis of this story was written with the help of an AI tool.)

Über eine Million Nutzer verlassen sich auf FXStreet für Echtzeit-Marktdaten, Charting-Tools, Experteneinblicke und Forex-News. Der umfassende Wirtschaftskalender und die Bildungs-Webinare helfen Tradern, informiert zu bleiben und fundierte Entscheidungen zu treffen. FXStreet wird von einem Team von rund 60 Fachleuten getragen, verteilt auf den Hauptsitz in Barcelona und verschiedene Regionen weltweit.
Weiterlesen


