
Crypto Market Overview: Bitcoin below $72,000 as Fed delays rate cut – LayerZero, Bonk, Zcash lead losses
Von Vishal Dixit
Veröffentlichungsdatum: 19 Mar 2026 | Änderungsdatum: 19 Mar 2026


BELIEBTE ARTIKEL

The cryptocurrency market faces renewed pressure as the US Federal Reserve (Fed) delays the interest rate cut for a second consecutive meeting, pushing down Bitcoin (BTC) below $72,000 and prompting a market-wide liquidation of more than $450 million over the last 24 hours.
- Bitcoin slips below $72,000 as the US Federal Reserve keeps the interest rate unchanged for the second consecutive meeting this year.
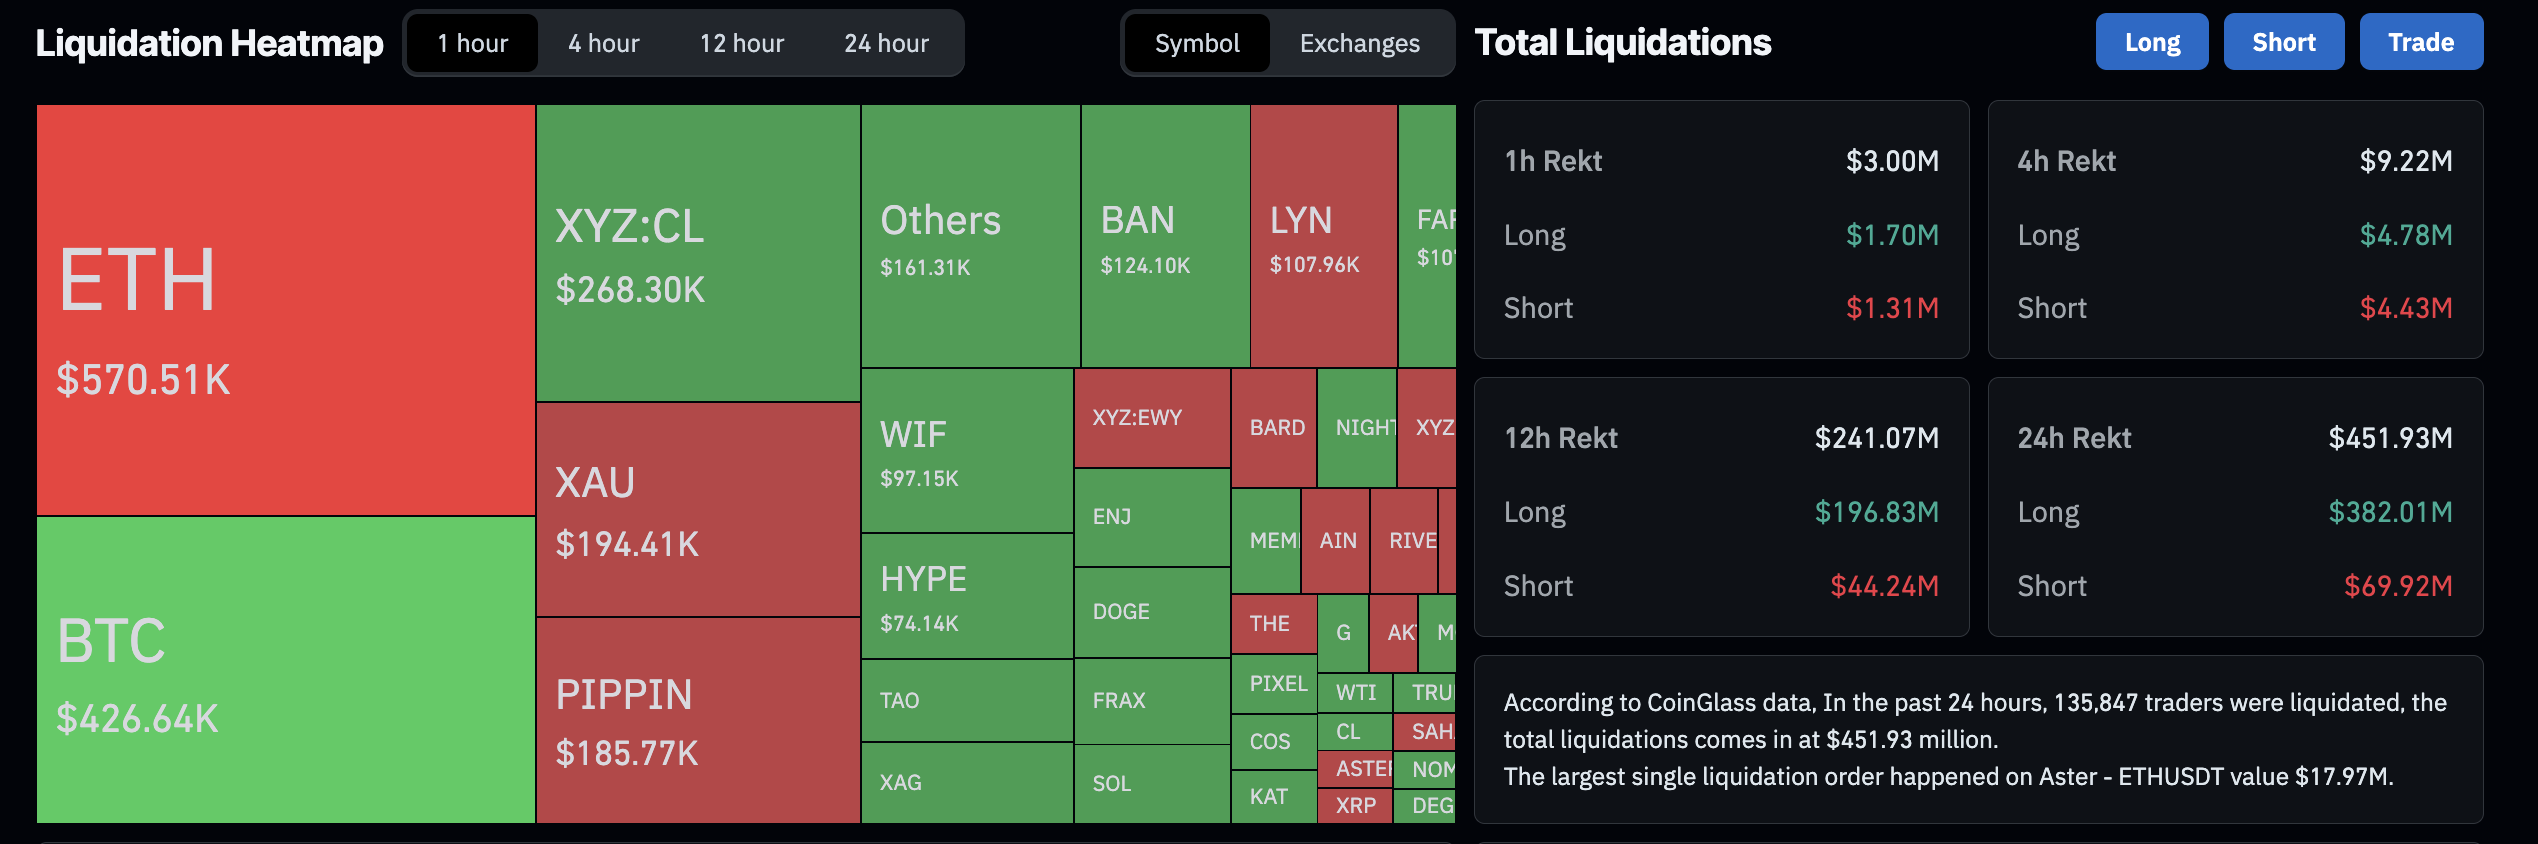
- Total liquidation over the last 24 hours exceeded $450 million, driven by the unwinding of bullish positions.
- LayerZero, Bonk, and Zcash lead the decline with double-digit losses in the last 24 hours.
The cryptocurrency market faces renewed pressure as the US Federal Reserve (Fed) delays the interest rate cut for a second consecutive meeting, pushing down Bitcoin (BTC) below $72,000 and prompting a market-wide liquidation of more than $450 million over the last 24 hours. Amid such conditions, LayerZero (ZRO), Bonk (BONK), and Zcash (ZEC) are leading the losses with nearly double-digit losses over the same time.
Delay in rate cuts weighs down on the crypto market
The US Fed Chair Jerome Powell has announced that the interest rate will remain unchanged for the second consecutive meeting this year, while the PCE inflation forecast for 2026 has increased to 2.7%. The Fed reached the decision with an 11-1 vote, with Fed Governor Miran dissenting in favor of an interest rate cut. Overall, the US Fed shows uncertainty about the effects of the ongoing U.S.-Iran war.
Reacting to the delay in rate cuts, the cryptocurrency market recorded massive liquidations over the past 24 hours, totaling $451.93 million, driven primarily by long liquidations of $382.01 million, reflecting renewed downside pressure.
Bitcoin under pressure, risks a $70,000 breakdown
Bitcoin hovers close to $71,000 at press time on Thursday, extending losses for the third consecutive day after Wednesday’s 3% decline. The Crypto King marks a daily close below the 50-day Exponential Moving Average (EMA) at $71,089, targeting the 78.6% trend-based Fibonacci level at $68,839 as the immediate support.
If Bitcoin slips below this level, it could extend the decline to the February 5 low near $62,945.
The Moving Average Convergence Divergence (MACD) edges lower toward its signal line, risking a potential bearish crossover as the positive histograms contract, suggesting that the bullish momentum is waning. Additionally, the Relative Strength Index (RSI) at 51 drops to the midline, consistent with the mid-week correction.
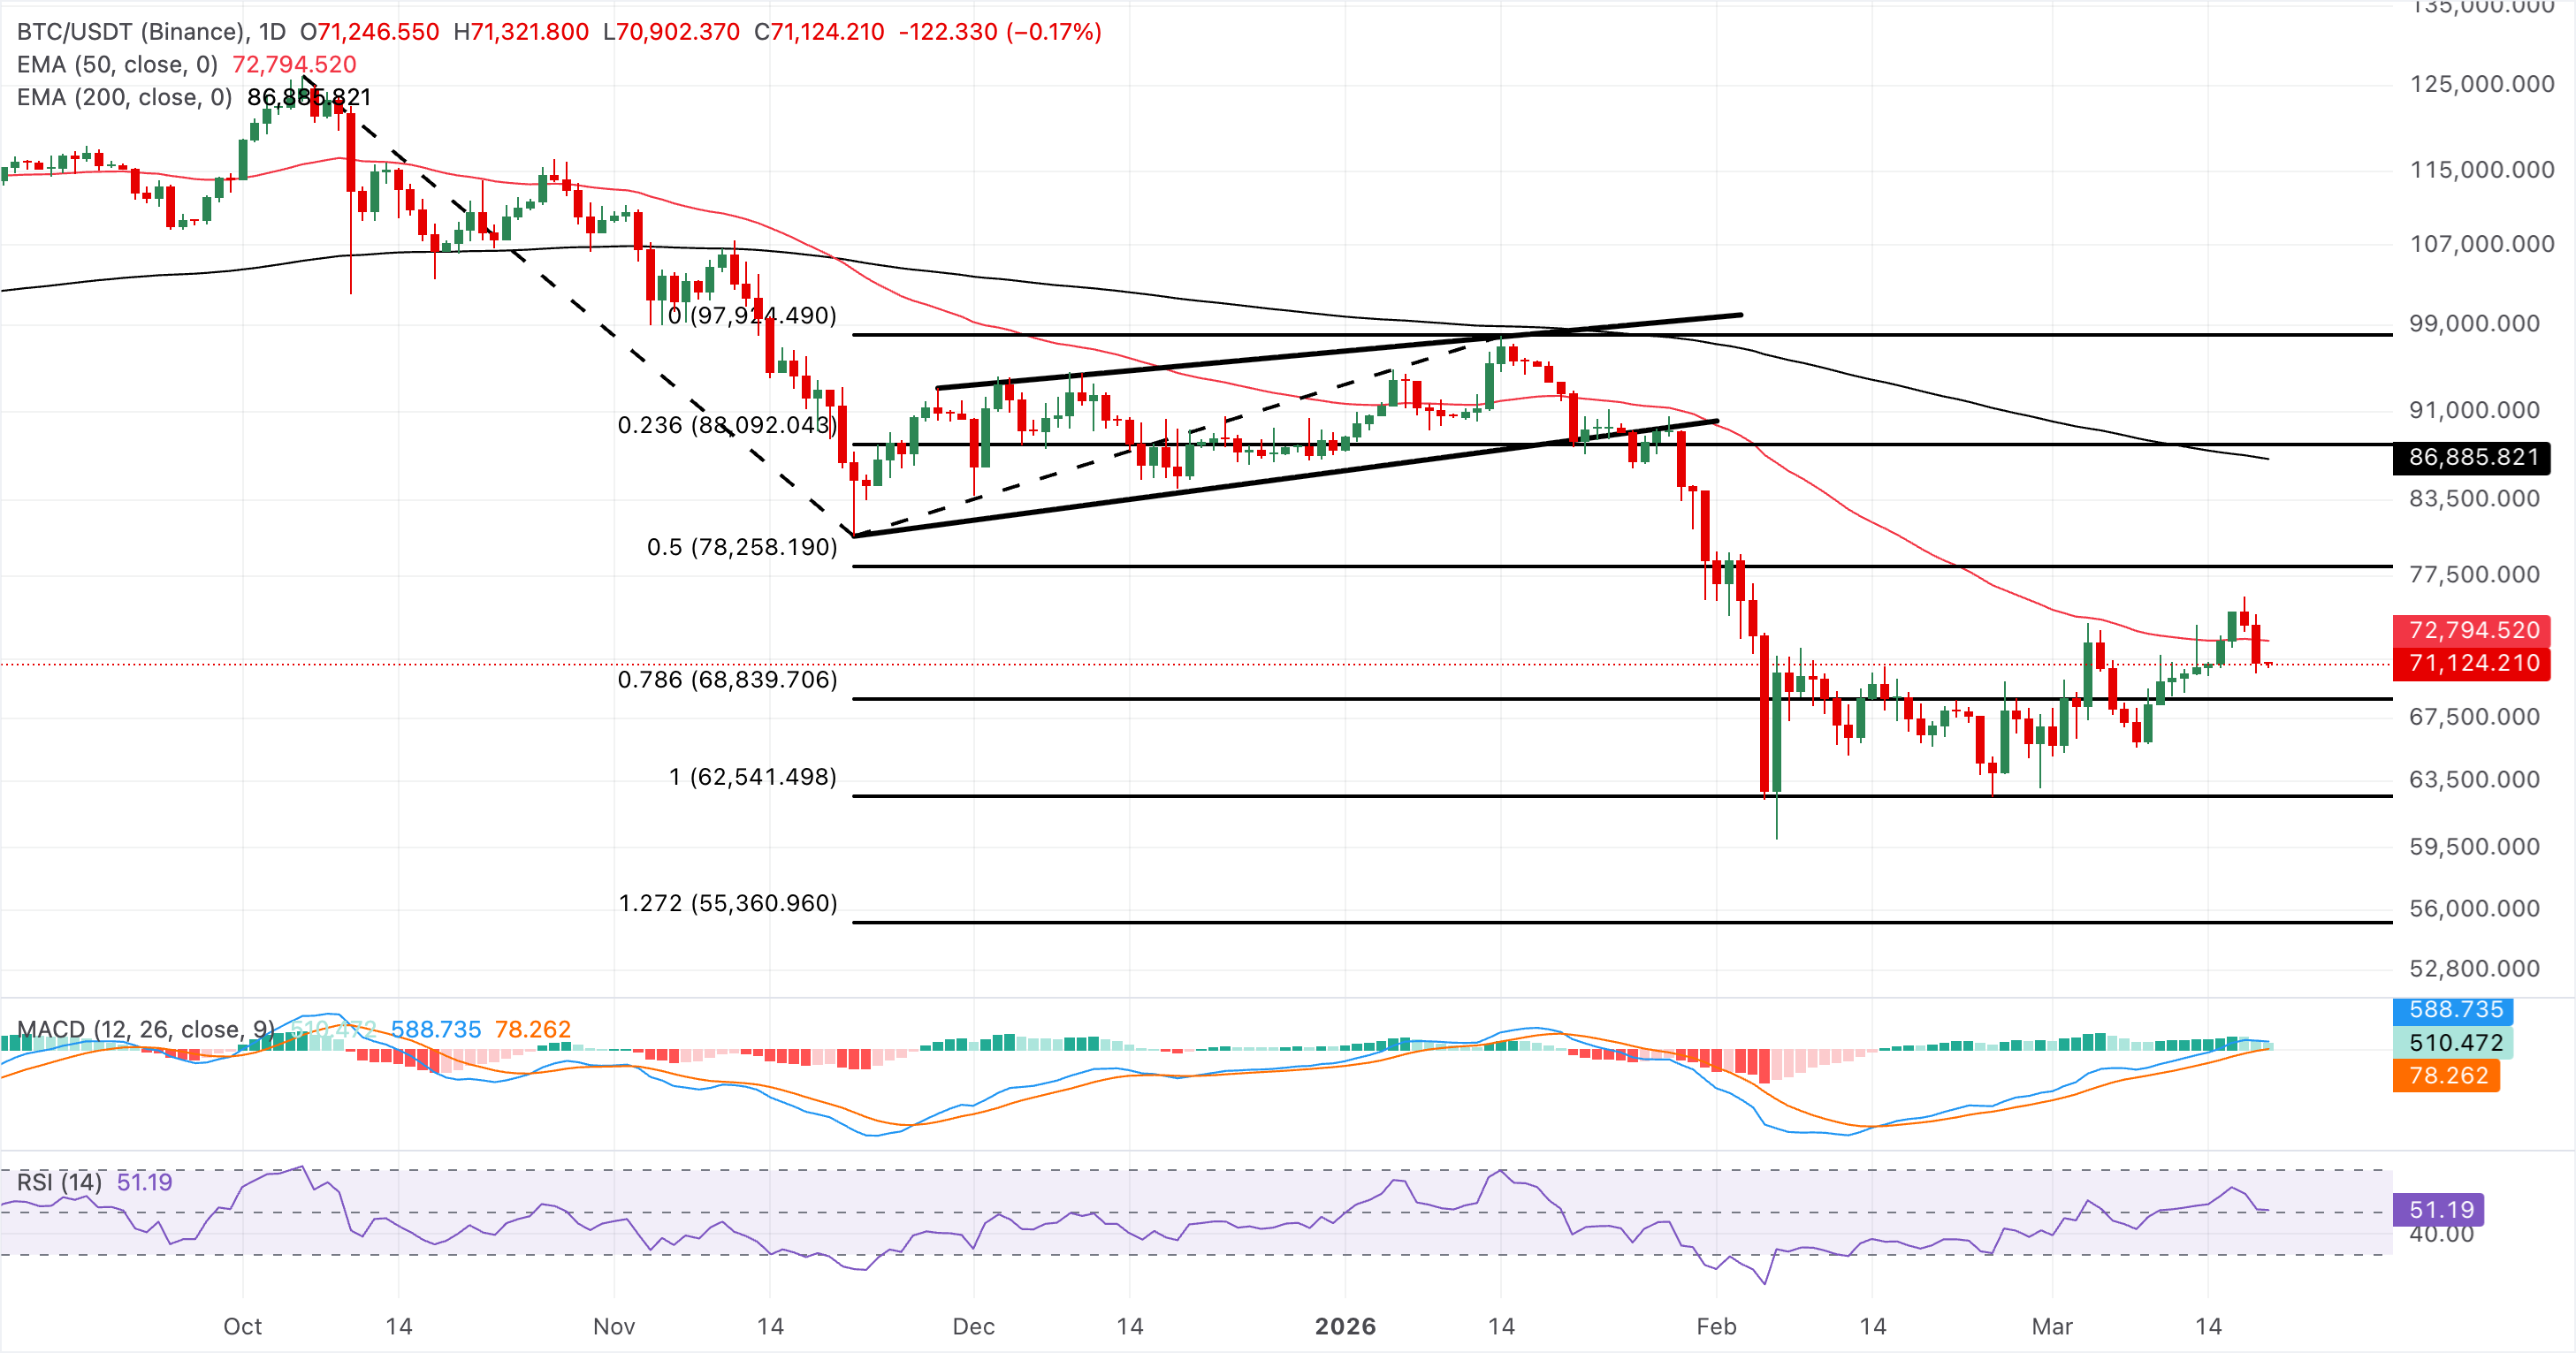
To reclaim the upward trend, Bitcoin should secure a daily close above the 50-day EMA at $71,089, which could extend the upside to the 50% retracement at $78,258.
Top Crypto Losers: LayerZero, Bonk, and Zcash lead losses
LayerZero is down 2% at press time on Thursday, extending the 8% drop from the previous day. The near-term bias turns cautiously bullish as ZRO holds above the rising 50-day EMA, while the 100-day EMA has started to slope higher and is narrowing the gap with the 200-day EMA. This configuration points to improving underlying trend conditions despite the latest pullback from the recent peak near $2.31.
The MACD remains in positive territory, but its line has rolled over toward the signal line, and the histogram has contracted, suggesting fading upside momentum after the prior impulse. The RSI near 56 stays above its midline, supporting a modest bullish tone but not signaling overbought conditions.
Initial support emerges at the 50-day EMA at $1.86, with a break exposing the 100-day EMA at $1.77, where a deeper correction would test the durability of the medium-term uptrend.
On the topside, immediate resistance sits at the recent swing high near $2.40, with a daily close above this level needed to reassert bullish momentum toward higher territory. If bulls defend the moving average cluster and reclaim $2.40, the broader technical structure would favor an extension of the advance in the coming sessions.
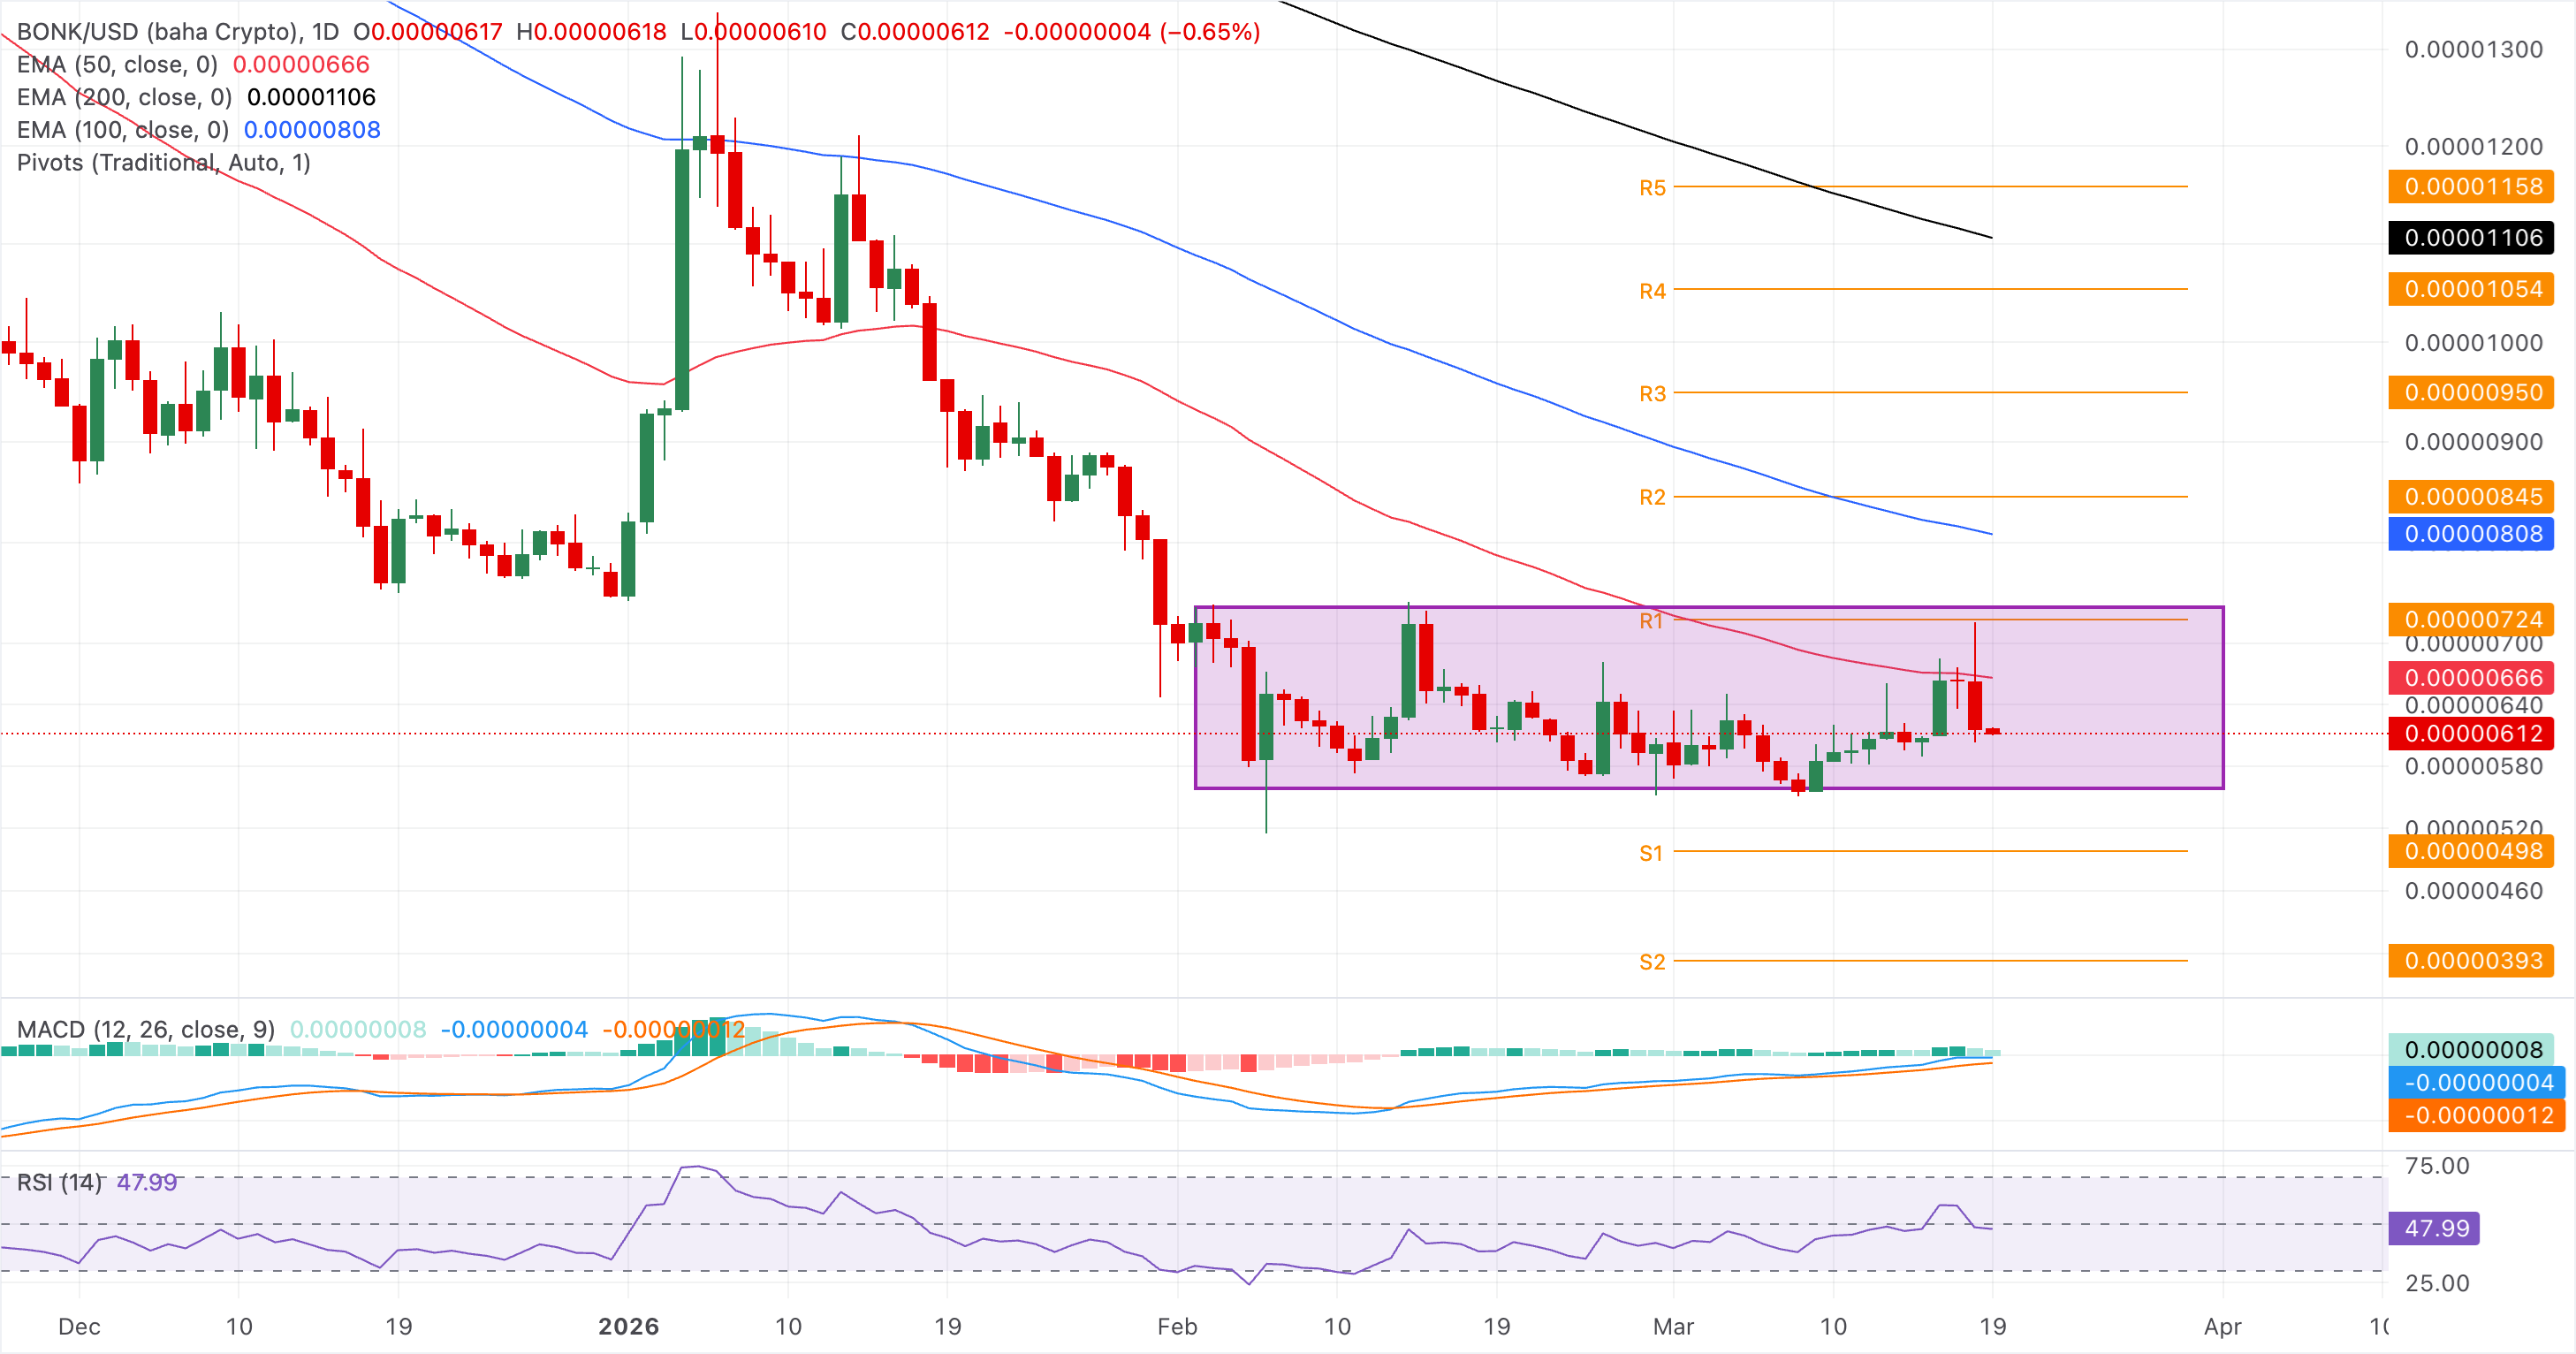
Bonk holds steady above $0.00000600 at the time of writing on Thursday, following a 7% drop the previous day. The technical backdrop is neutral with a mild downside tilt, as BONK reverses within a consolidation range while the 50-, 100-, and 200-day EMA descend, keeping the broader bias bearish.
Momentum is subdued rather than directional: the RSI around the mid-40s recedes from last week’s brief push above 50, suggesting fading bullish follow-through and leaving the pair in a consolidative phase without clear directional pressure.
The path of least resistance targets the consolidation range floor at $0.00000559, followed by the S1 Pivot Point at $0.00000498.

Looking up, the 50-day EMA at $0.00000666 remains the critical resistance.
Zcash trades near $250 at press time on Thursday, after an 8% decline the previous day. The near-term tone is mixed as ZEC failed to surpass its 200-day EMA at $281 after breaking above the long-running descending resistance line, signaling a struggled transition away from the prior downtrend.
Momentum improves as the MACD remains in positive territory with the MACD line above its signal line, while the RSI around 54 signals moderate bullish momentum rather than overbought conditions.
Initial resistance emerges at the 50-day EMA near $263, followed by the recent swing high at $276.
On the downside, immediate support lies at the broken trendline around $234.00, where a failure would expose the mid-March floor around 197.90 and weaken the nascent bullish bias.
(The technical analysis of this story was written with the help of an AI tool.)

Über eine Million Nutzer verlassen sich auf FXStreet für Echtzeit-Marktdaten, Charting-Tools, Experteneinblicke und Forex-News. Der umfassende Wirtschaftskalender und die Bildungs-Webinare helfen Tradern, informiert zu bleiben und fundierte Entscheidungen zu treffen. FXStreet wird von einem Team von rund 60 Fachleuten getragen, verteilt auf den Hauptsitz in Barcelona und verschiedene Regionen weltweit.
Weiterlesen


