

Crypto Market Overview: Zcash, Worldcoin sustain gains while Bitcoin loses steam
- Bitcoin edges lower on Monday, slipping below $63,000 as price remains capped below the 50-day EMA at around $65,000.
- Crypto market sentiment remains mixed as the US-Iran dispute over the Strait of Hormuz continues.
- Zcash and Worldcoin sustain gains over the last 24 hours, emerging as top performers.
Bitcoin (BTC) trades below $63,000 on Monday, edging lower as price remains capped below its 50-day Exponential Moving Average (EMA) at $65,212. Market sentiment remains on edge as geopolitical tensions between the US and Iran stay elevated over the Strait of Hormuz. Zcash (ZEC) and Worldcoin (WLD) sustain gains over the last 24 hours, emerging as top performers.
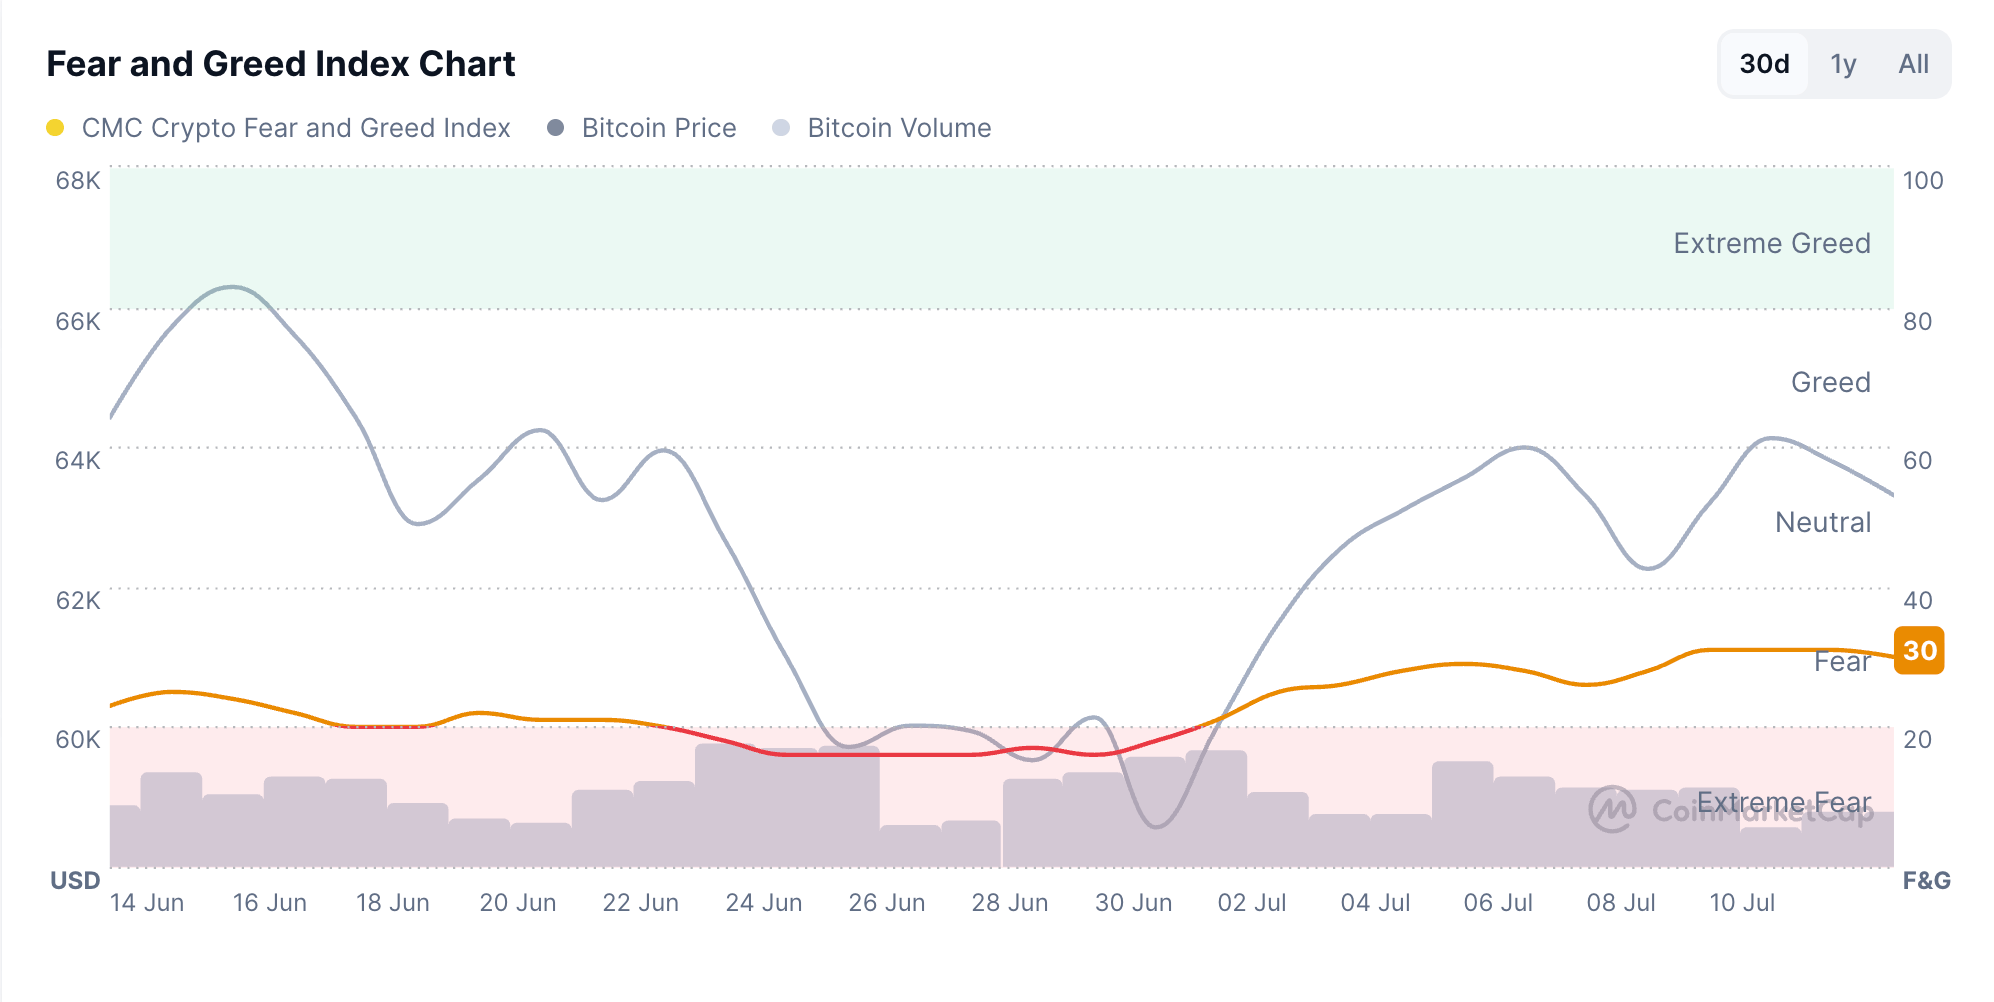
CoinMarketCap’s Fear and Greed Index at 30 on Monday holds steady in the “Fear” zone, ranging from 20 to 40.
Bitcoin loses steam, vulnerable to deeper losses
Bitcoin maintains a capped bias below its 50-day EMA near $65,194 and well under the 200-day EMA around $75,692. From a technical perspective, the path of least resistance suggests a steeper correction in BTC toward the $60,000 psychological support.
The Moving Average Convergence Divergence (MACD) histogram remains in positive territory and above its signal line, hinting at improving short-term momentum, while the Relative Strength Index (RSI) dips to 48, below the 50 mark, suggesting only modest directional conviction despite the broader downside structure.
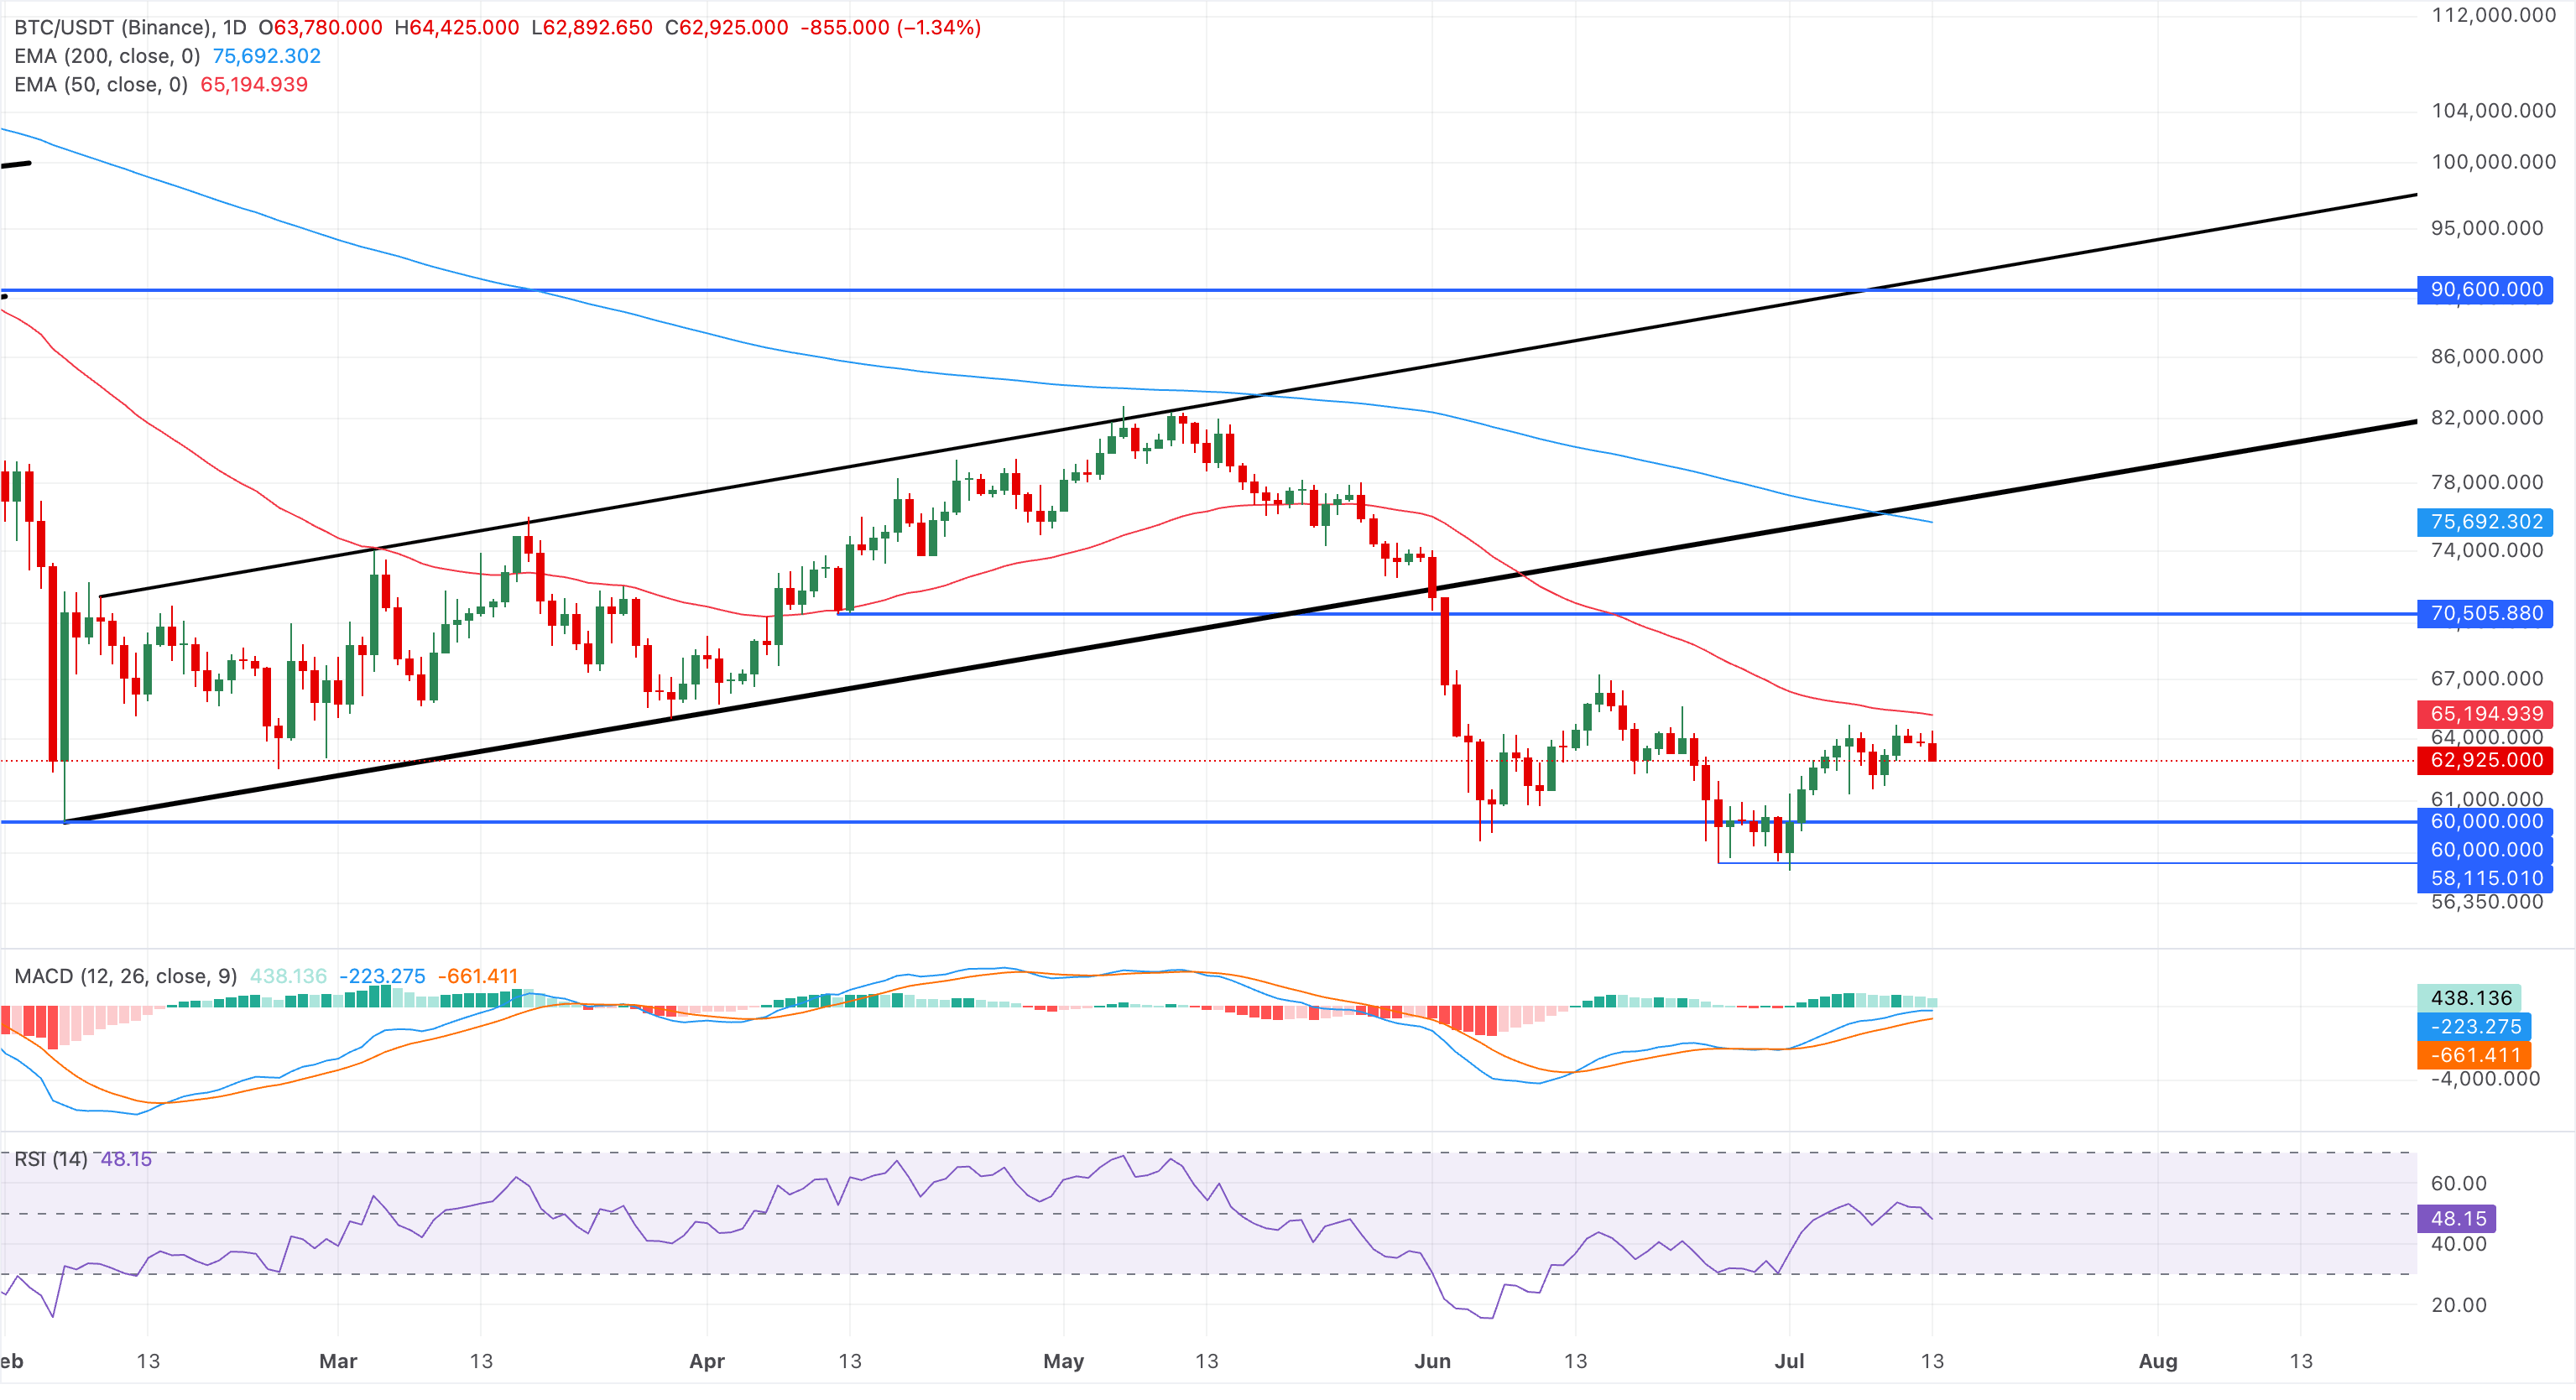
On the topside, initial resistance is seen at the 50-day EMA around $65,194, with a more substantial barrier at the $70,000 round figure.
Zcash and Worldcoin recovery at risk
Zcash trades above $500 at press time on Monday, after four consecutive days of recovery. The privacy coin maintains a constructive bullish tone as price holds well above the 50-day EMA near $465 and the 200-day EMA around $393.
The bounce above the 78.6% Fibonacci retracement at $520, measured from the $184 to $690 upswing, reinforces an ongoing recovery. If buying pressure sustains, ZEC could test the previous all-time high around $690.
That said, the RSI remains firm near 63, suggesting persistent buying pressure, while the MACD stays in positive territory with the line above its signal and an expanding histogram, hinting that upside momentum remains in play even as the advance starts to stretch.
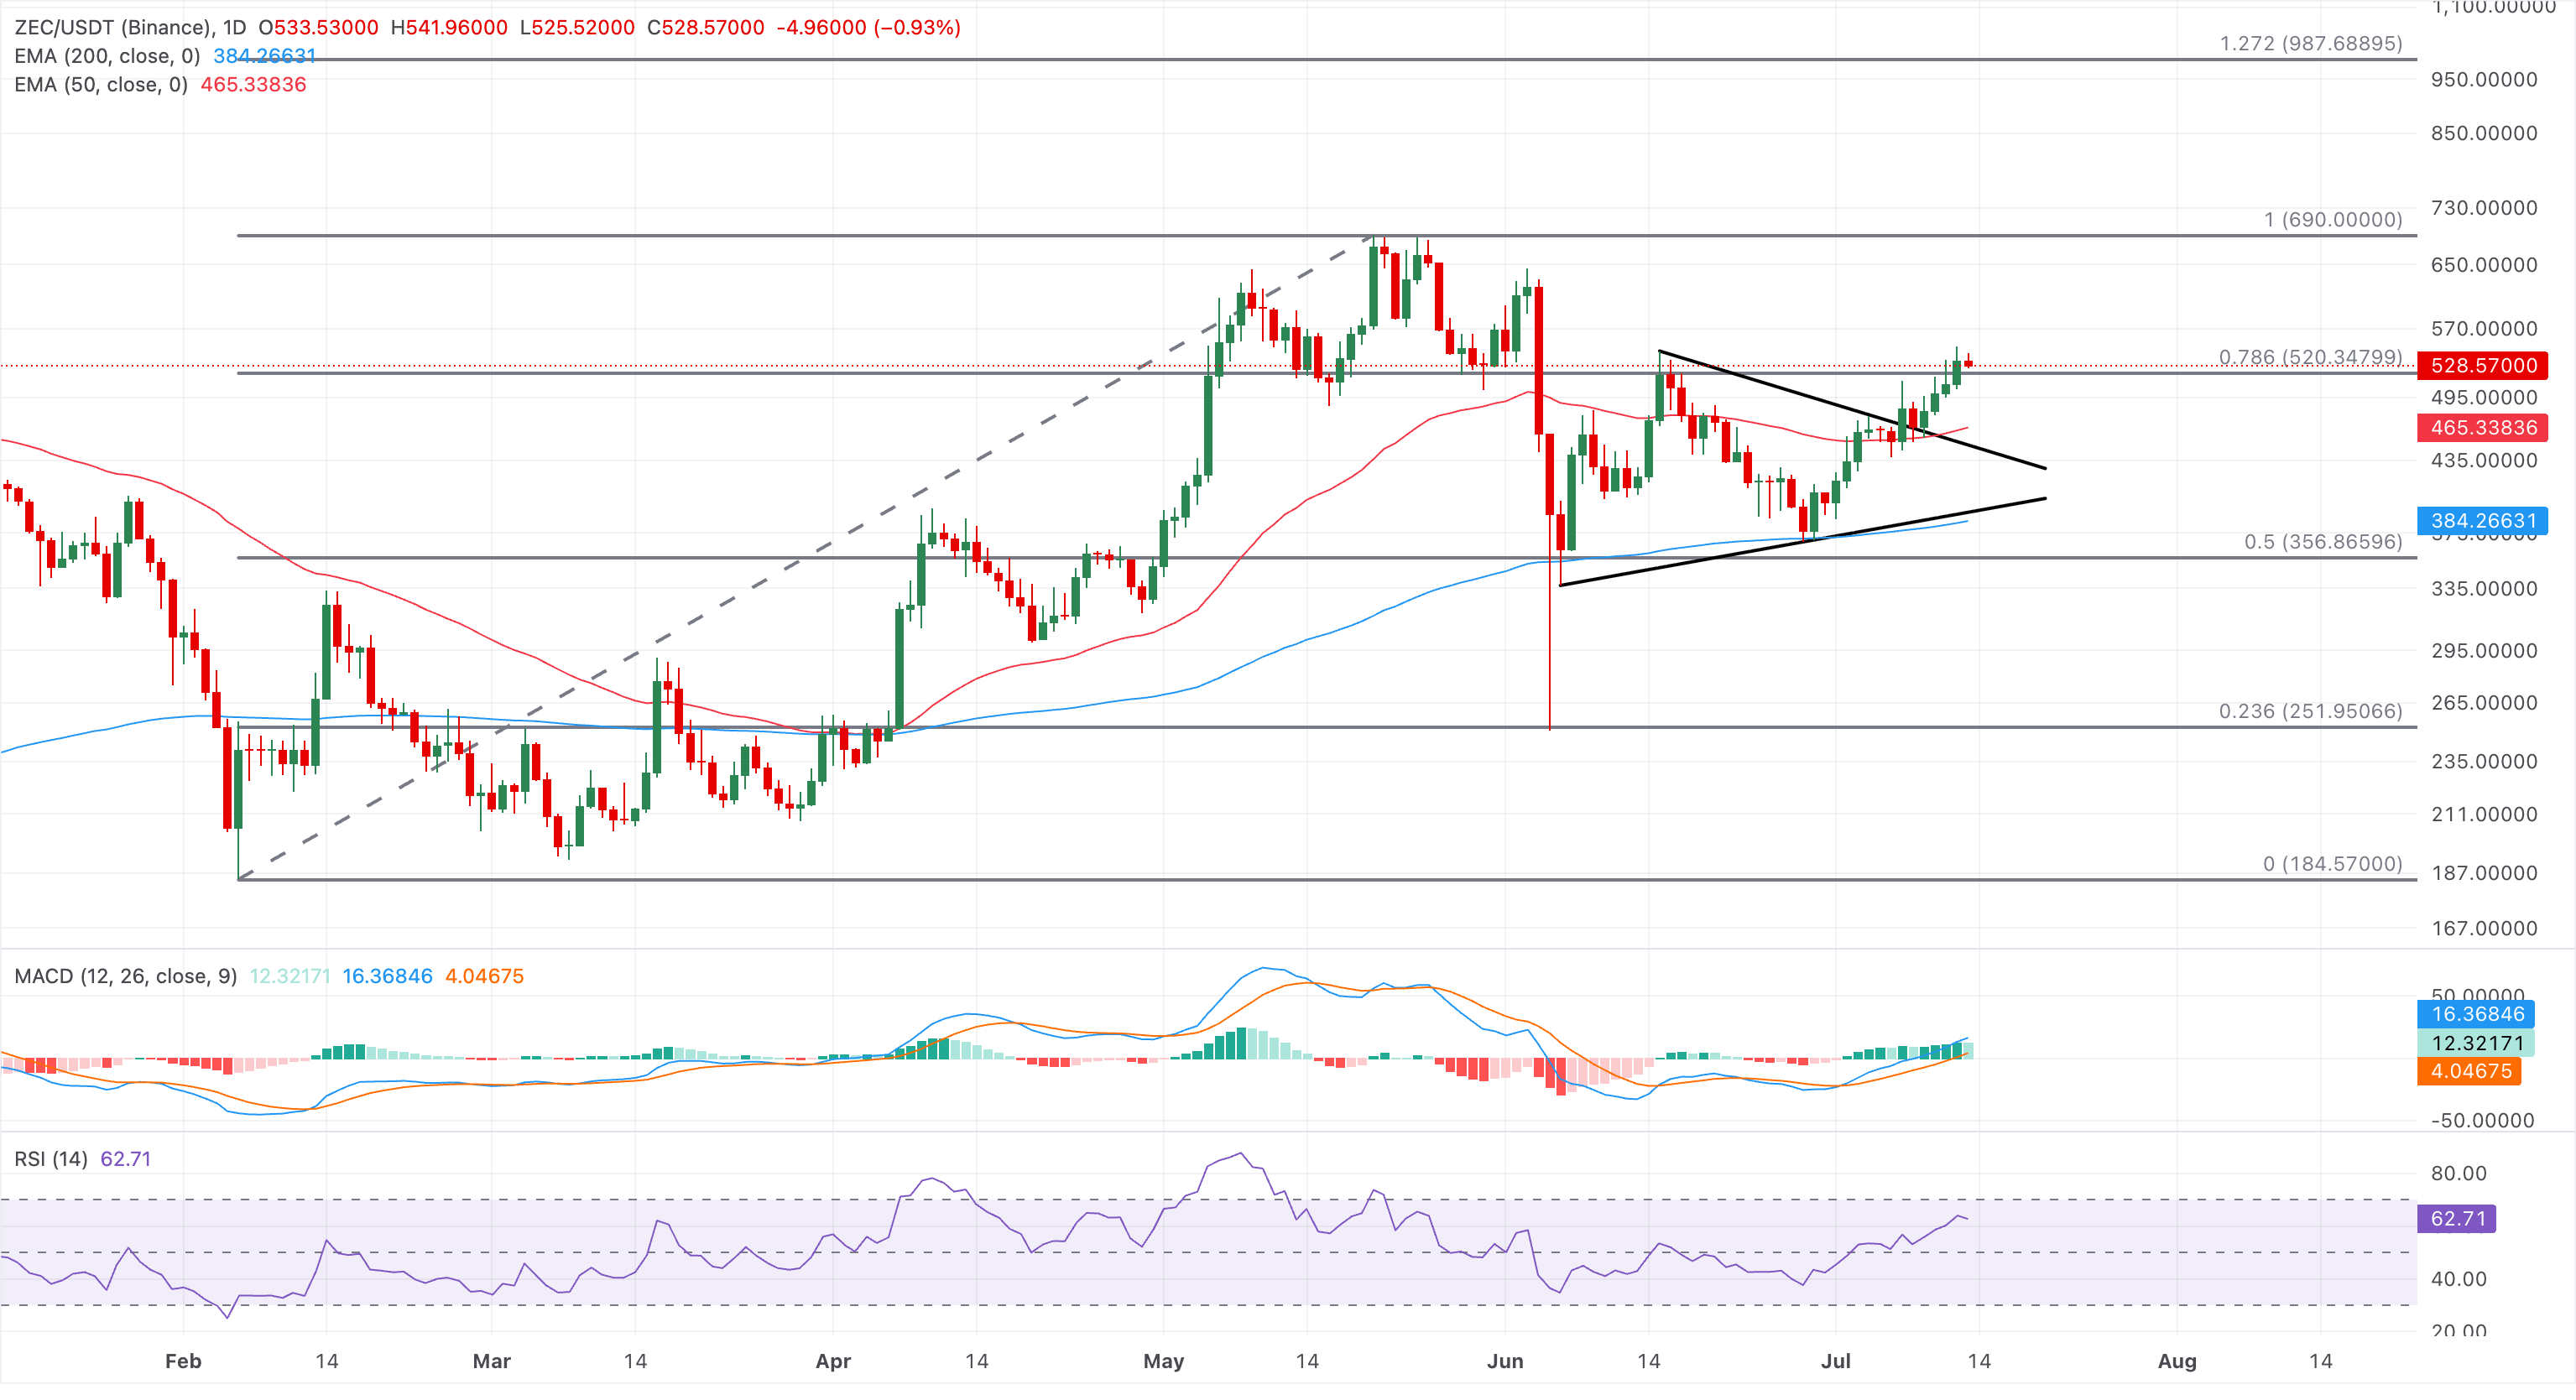
On the downside, immediate support is seen at the 50-day EMA at $465 and the prior descending trendline break zone near $450, followed by the 200-day EMA at $393 and the 50% retracement at $356, which together offer deeper structural cushions.
Worldcoin holds a mildly bearish bias as it tests the 50-day EMA at $0.4294, around the 50% retracement at $0.4048, measured over the $0.2267 to $0.7229 upswing. A decisive close above $0.4294 could test the 200-day EMA near $0.4722, where a daily close above could challenge the 78.6% Fibonacci retracement at $0.5640.
Momentum readings back this cautious tone, with the RSI lingering around 47 in neutral-to-soft territory and the MACD line marginally below the signal line, hinting that downside pressure has eased but not reversed.
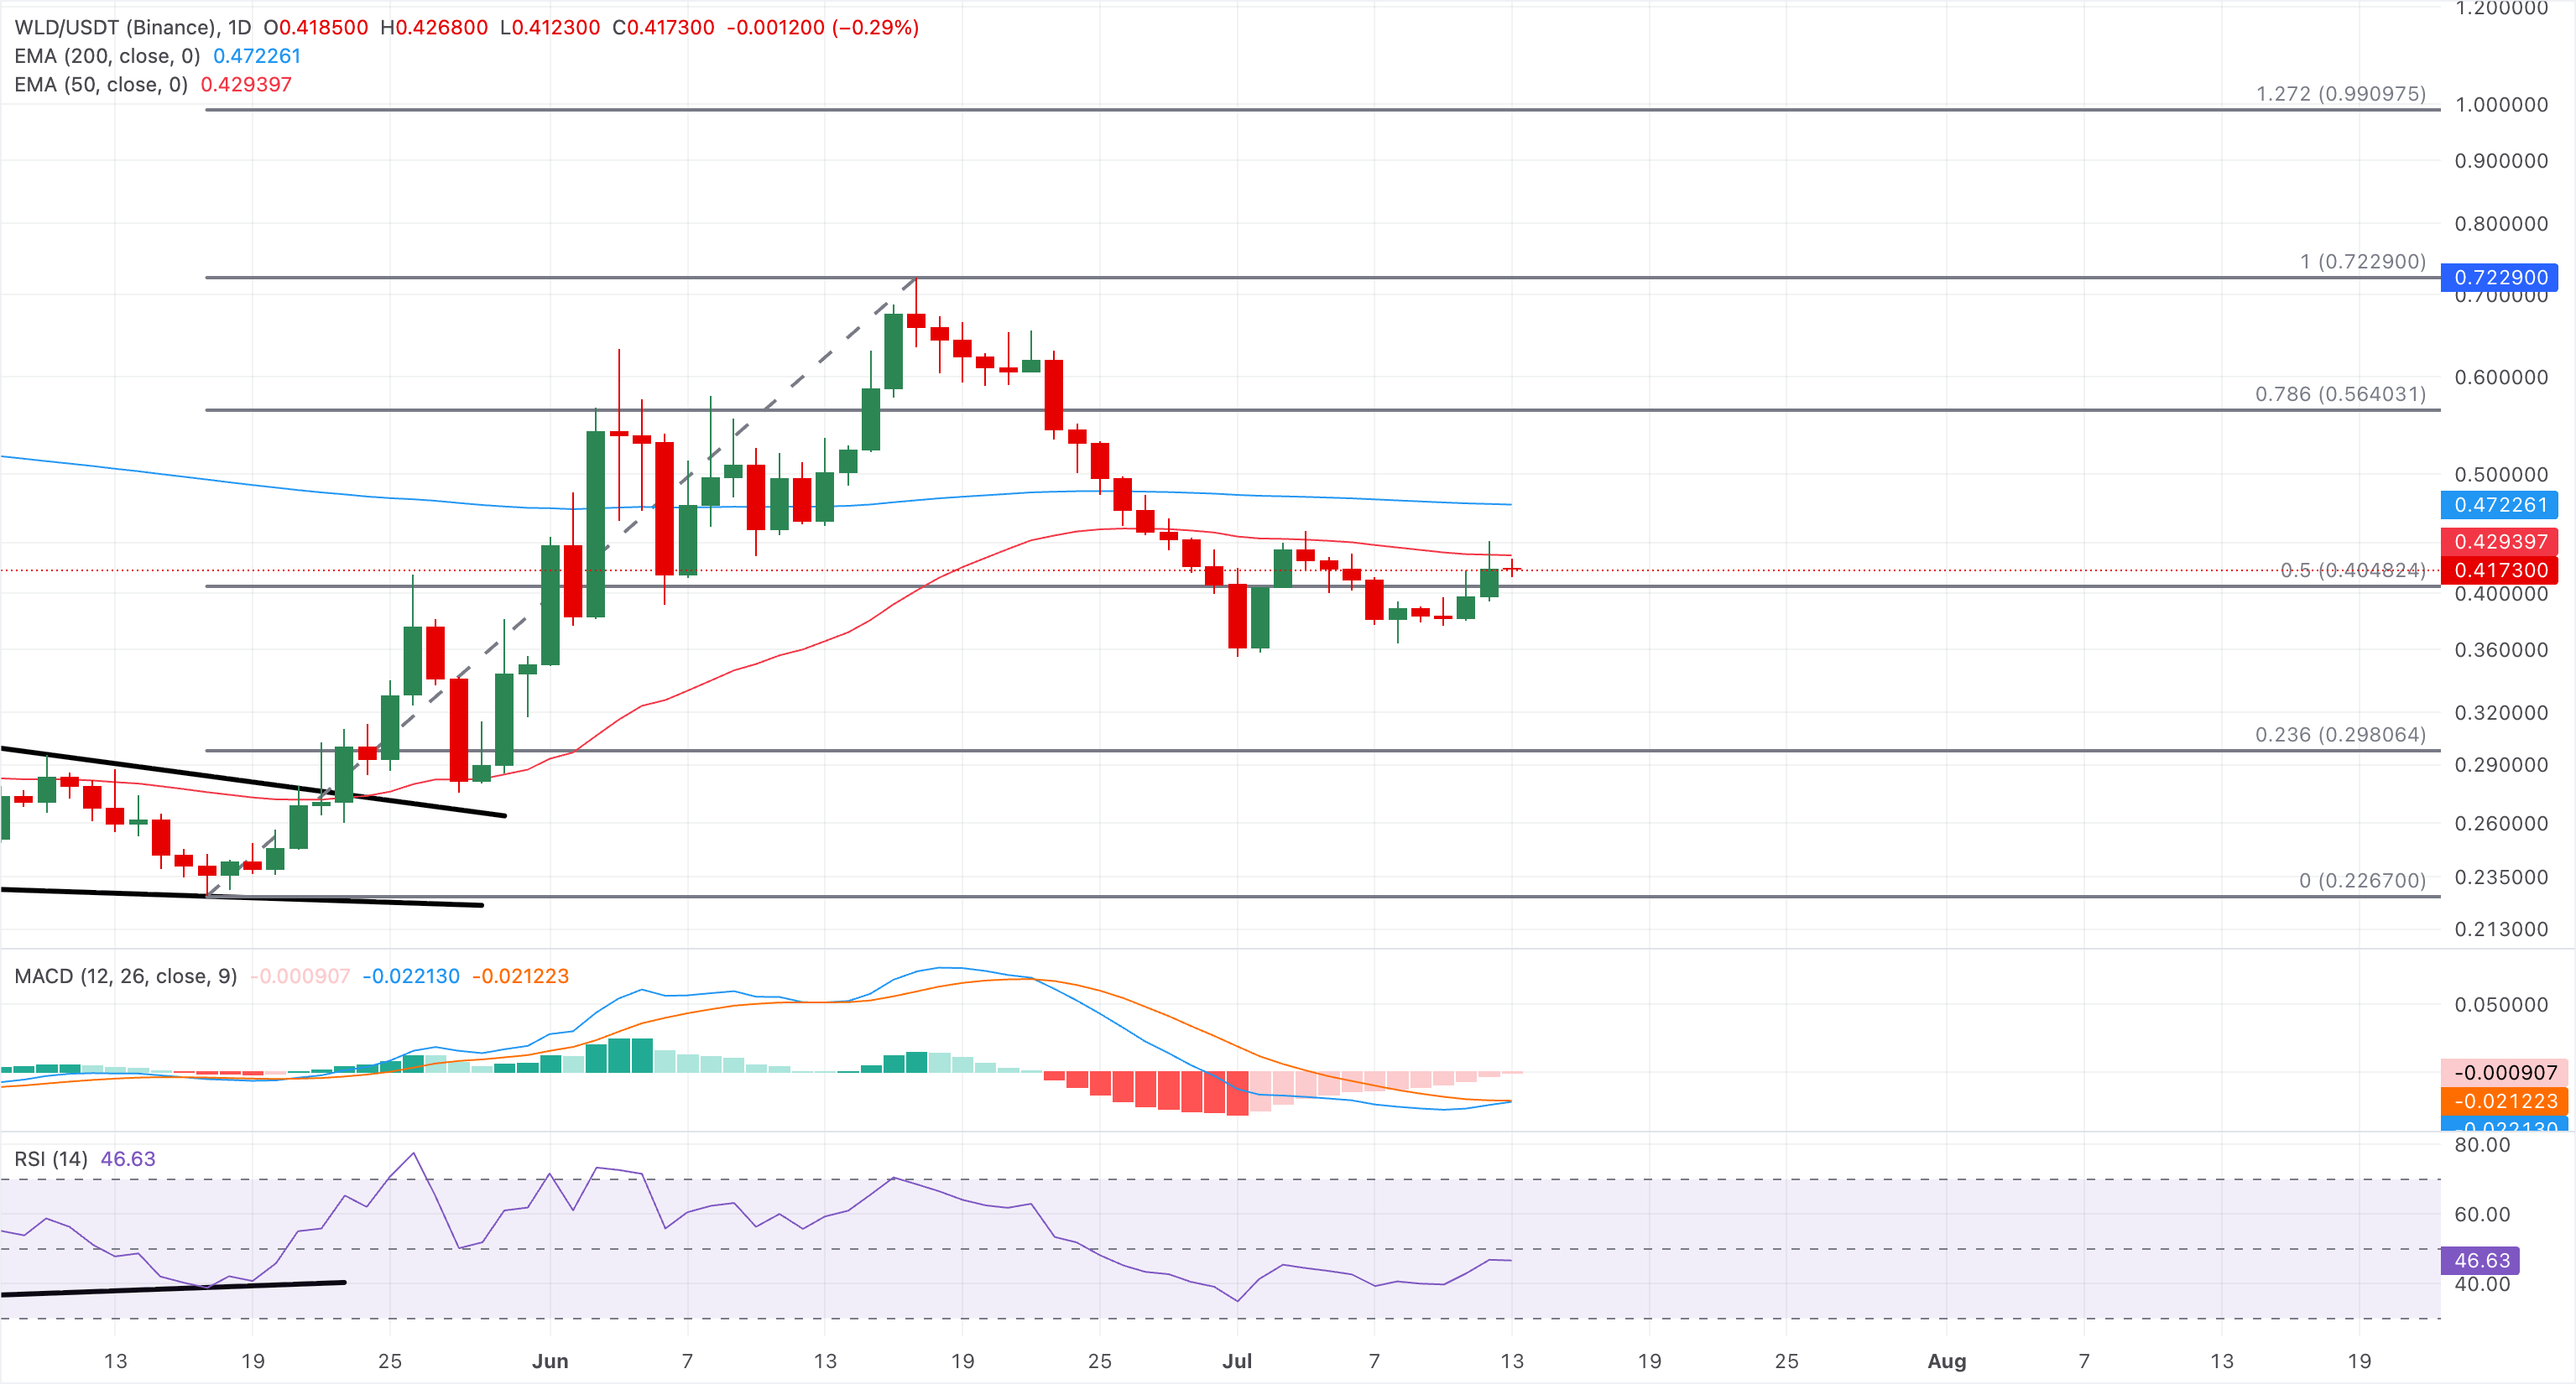
On the downside, immediate support is seen at the 50% Fibonacci retracement near $0.4048, where a sustained break would expose the deeper 23.6% retracement at roughly $0.2980.
(The technical analysis of this story was written with the help of an AI tool. Know more.)














