
Crypto Overview: Bitcoin extends decline amid US-Iran negotiations concerns – BCH, HYPE lead losses
Von Vishal Dixit
Aktualisiert: 19 Jun 2026


BELIEBTE ARTIKEL

The broader cryptocurrency market feels the weight of strained US-Iran negotiations, pushing Bitcoin (BTC) below $63,000 on Friday. Israeli missile strikes over Lebanon bend the first clause of the peace agreement, raising concerns over the renewed passage through the Strait of Hormuz.
- Bitcoin slips below $63,000 on Friday after three consecutive days of losses.
- Middle East tensions resurface as Israel continues missile strikes on Lebanon, while US and Iran cancel negotiation trip to Switzerland.
- Bitcoin Cash and Hyperliquid led losses over the last 24 hours.
The broader cryptocurrency market feels the weight of strained US-Iran negotiations, pushing Bitcoin (BTC) below $63,000 on Friday. Israeli missile strikes over Lebanon bend the first clause of the peace agreement, raising concerns over the renewed passage through the Strait of Hormuz. The bearish pressure in the crypto market extends to altcoins, with Bitcoin Cash (BCH) and Hyperliquid (HYPE) leading the losses over the last 24 hours.
Sellers hold control amid endless Middle East tensions
Bitcoin hovers below $63,000 at press time on Friday, after three consecutive days of losses so far this week, driven by Kevin Warsh’s hawkish speech on Wednesday and now the cancellation of the US and Iran trip to Switzerland for further discussions.
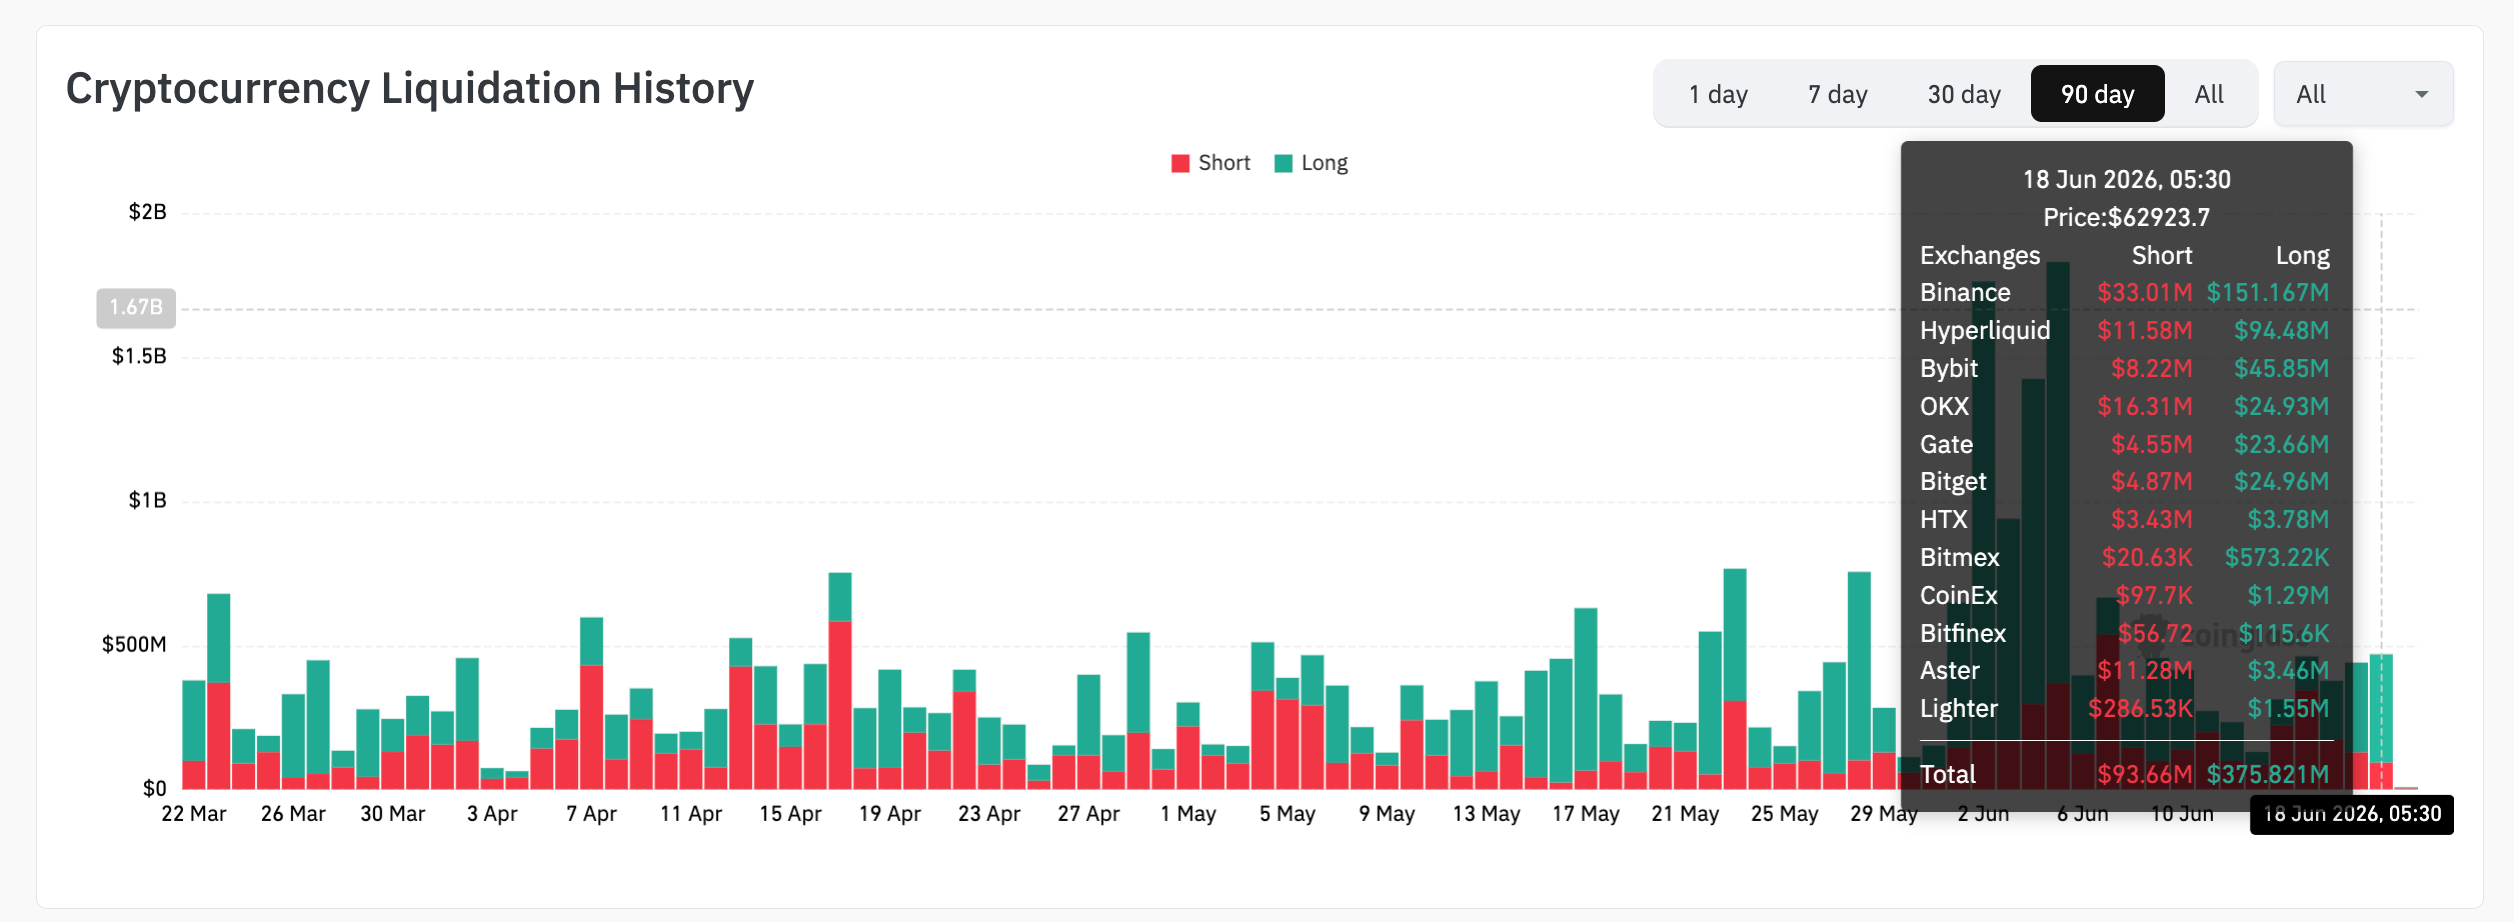
CoinGlass data shows that nearly $376 million in long liquidations on Thursday significantly outpaced around $94 million in short liquidations, clearly indicating bearish dominance and a larger wipeout of bullish positions.
Bitcoin falls off the edge of $63,000
Bitcoin maintains a bearish near-term bias as it extends the downside reversal from the 20-day Simple Moving Average (SMA) around $66,500 for the fourth straight day. Looking up, the 50-day Exponential Moving Average (EMA) is around $69,730, and the upper Bollinger band is near $70,810, reinforcing overhead supply. The formerly supportive rising trend line has now turned into resistance, sitting much higher near $73,050.
Momentum is mixed on the daily chart, with the Moving Average Convergence Divergence (MACD) histogram contracting, while the MACD line risks crossing below its signal amid fading bullish pressure. Meanwhile, the Relative Strength Index (RSI) around 35 stays in bearish territory, suggesting rallies are still vulnerable while price trades below these key averages.
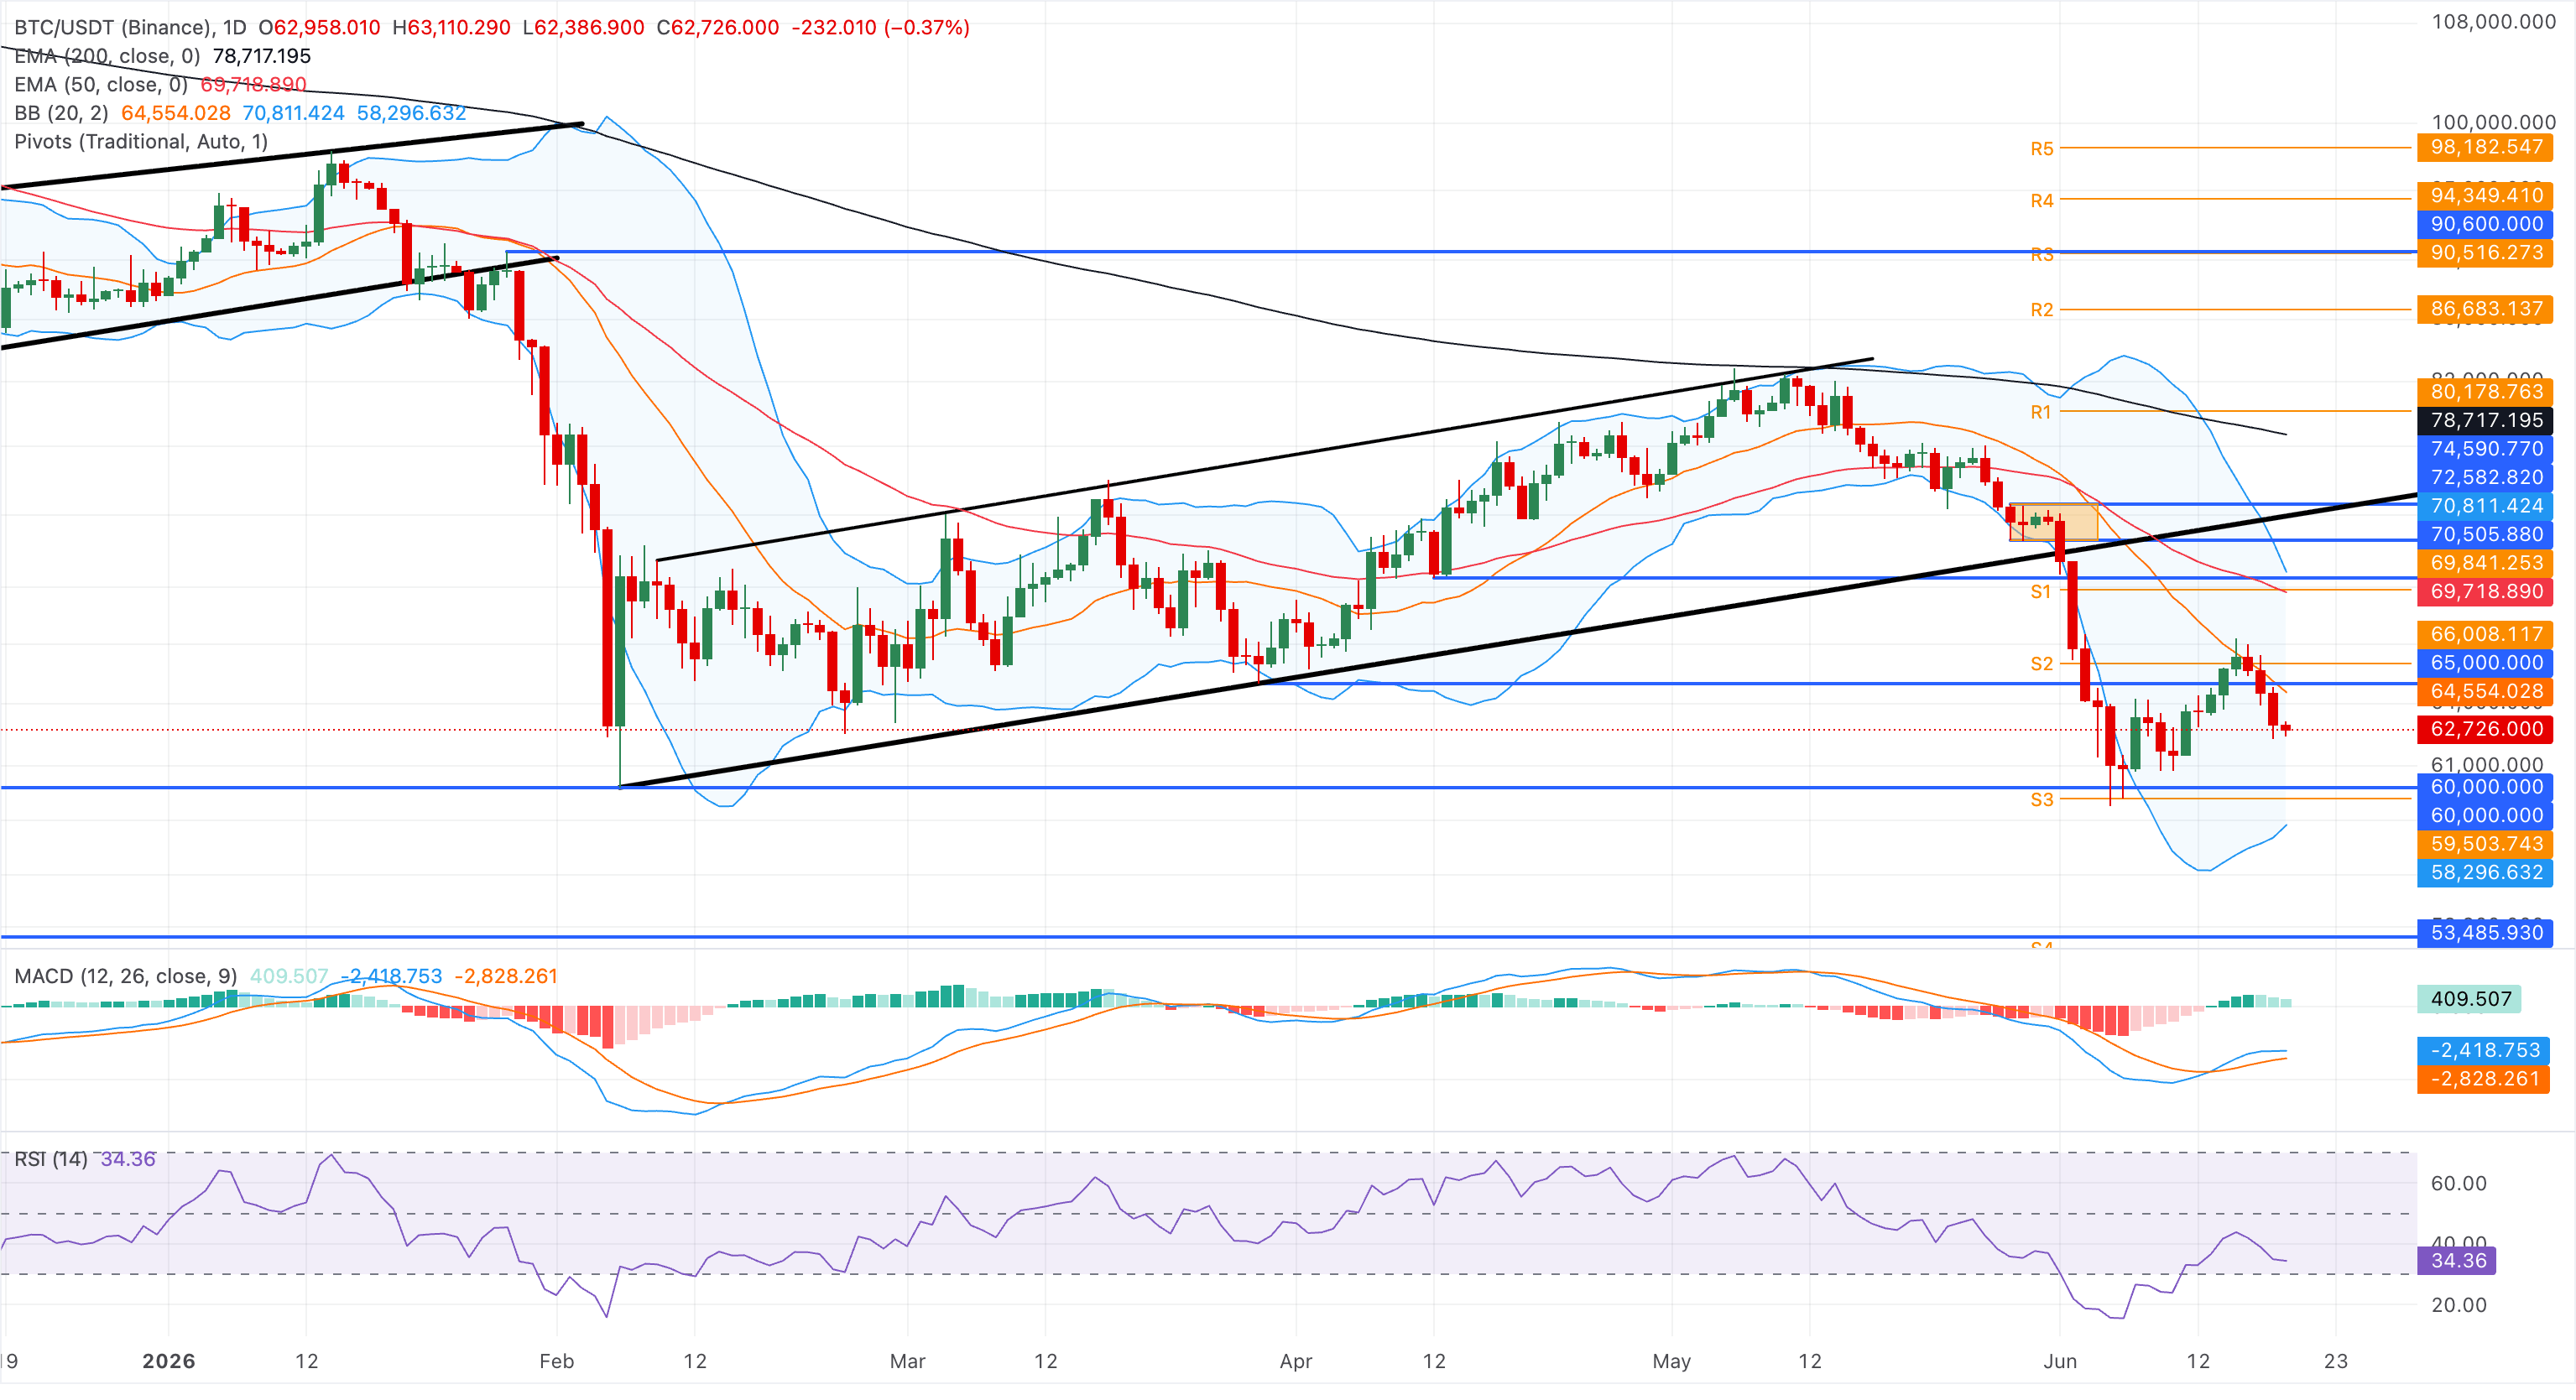
On the downside, initial support is seen at the psychological $60,000 horizontal level, with the lower Bollinger band near $58,330 offering a deeper cushion if sellers extend control.
Bitcoin Cash risks further decline
Bitcoin Cash trades below $200 at the time of writing on Friday, maintaining a bearish bias well beneath the 20-day SMA around $224 and the 50-day EMA near $303.60. The BCH price is compressing toward the lower Bollinger Band at roughly $163, while the RSI hovers in oversold territory near 27, suggesting that downside pressure persists but the sell-off is becoming stretched, even as the MACD histogram remains in the positive territory.
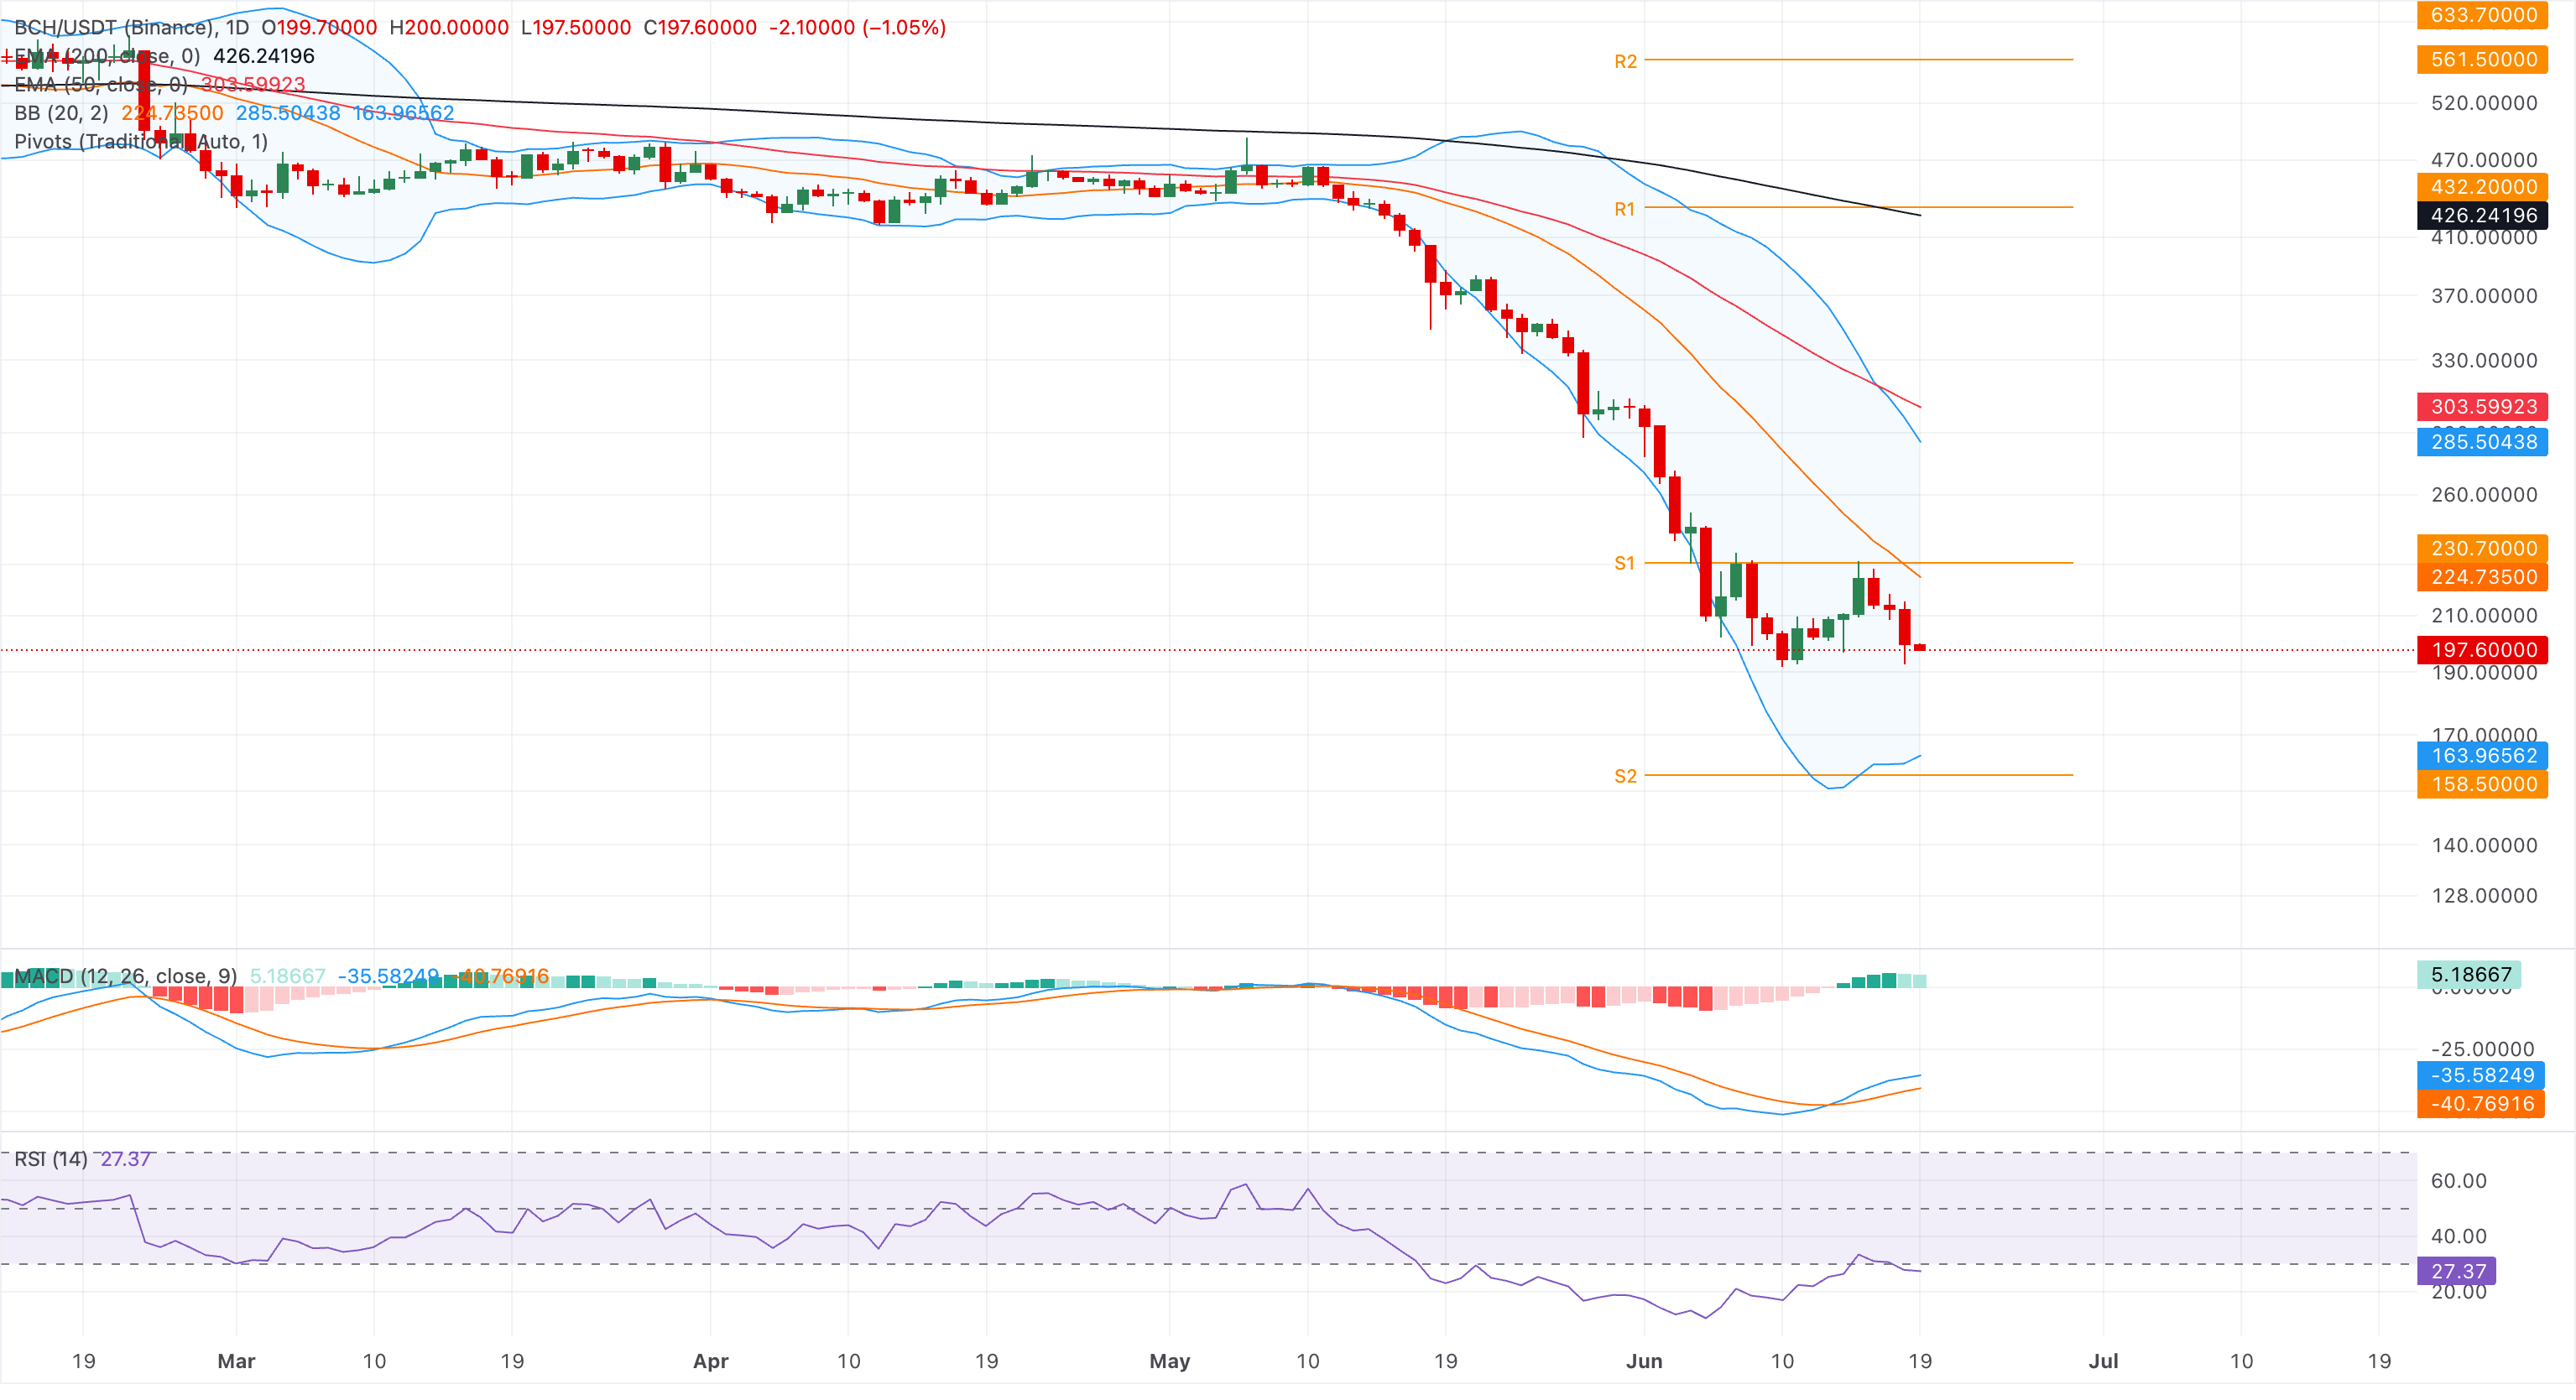
On the topside, initial resistance is at the Bollinger middle band around $224, with additional hurdles at the upper band near $285, before the more substantial dynamic caps from the 50-day EMA at $303 and the 200-day EMA at $426.
Hyperliquid nears key support
Hyperliquid edges lower for the third day after being capped by the upper Bollinger Band around $76.43 on Tuesday. HYPE maintains a mild bullish near-term bias as price holds comfortably above the 20-day SMA around $64.78 and the 50-day EMA near $57.34.
The broader uptrend structure remains supported by the 200-day EMA at roughly $43.66, while the MACD and signal line move sideways and the RSI at 55 shows a downtick toward the midline, together suggesting that upside momentum is waning.
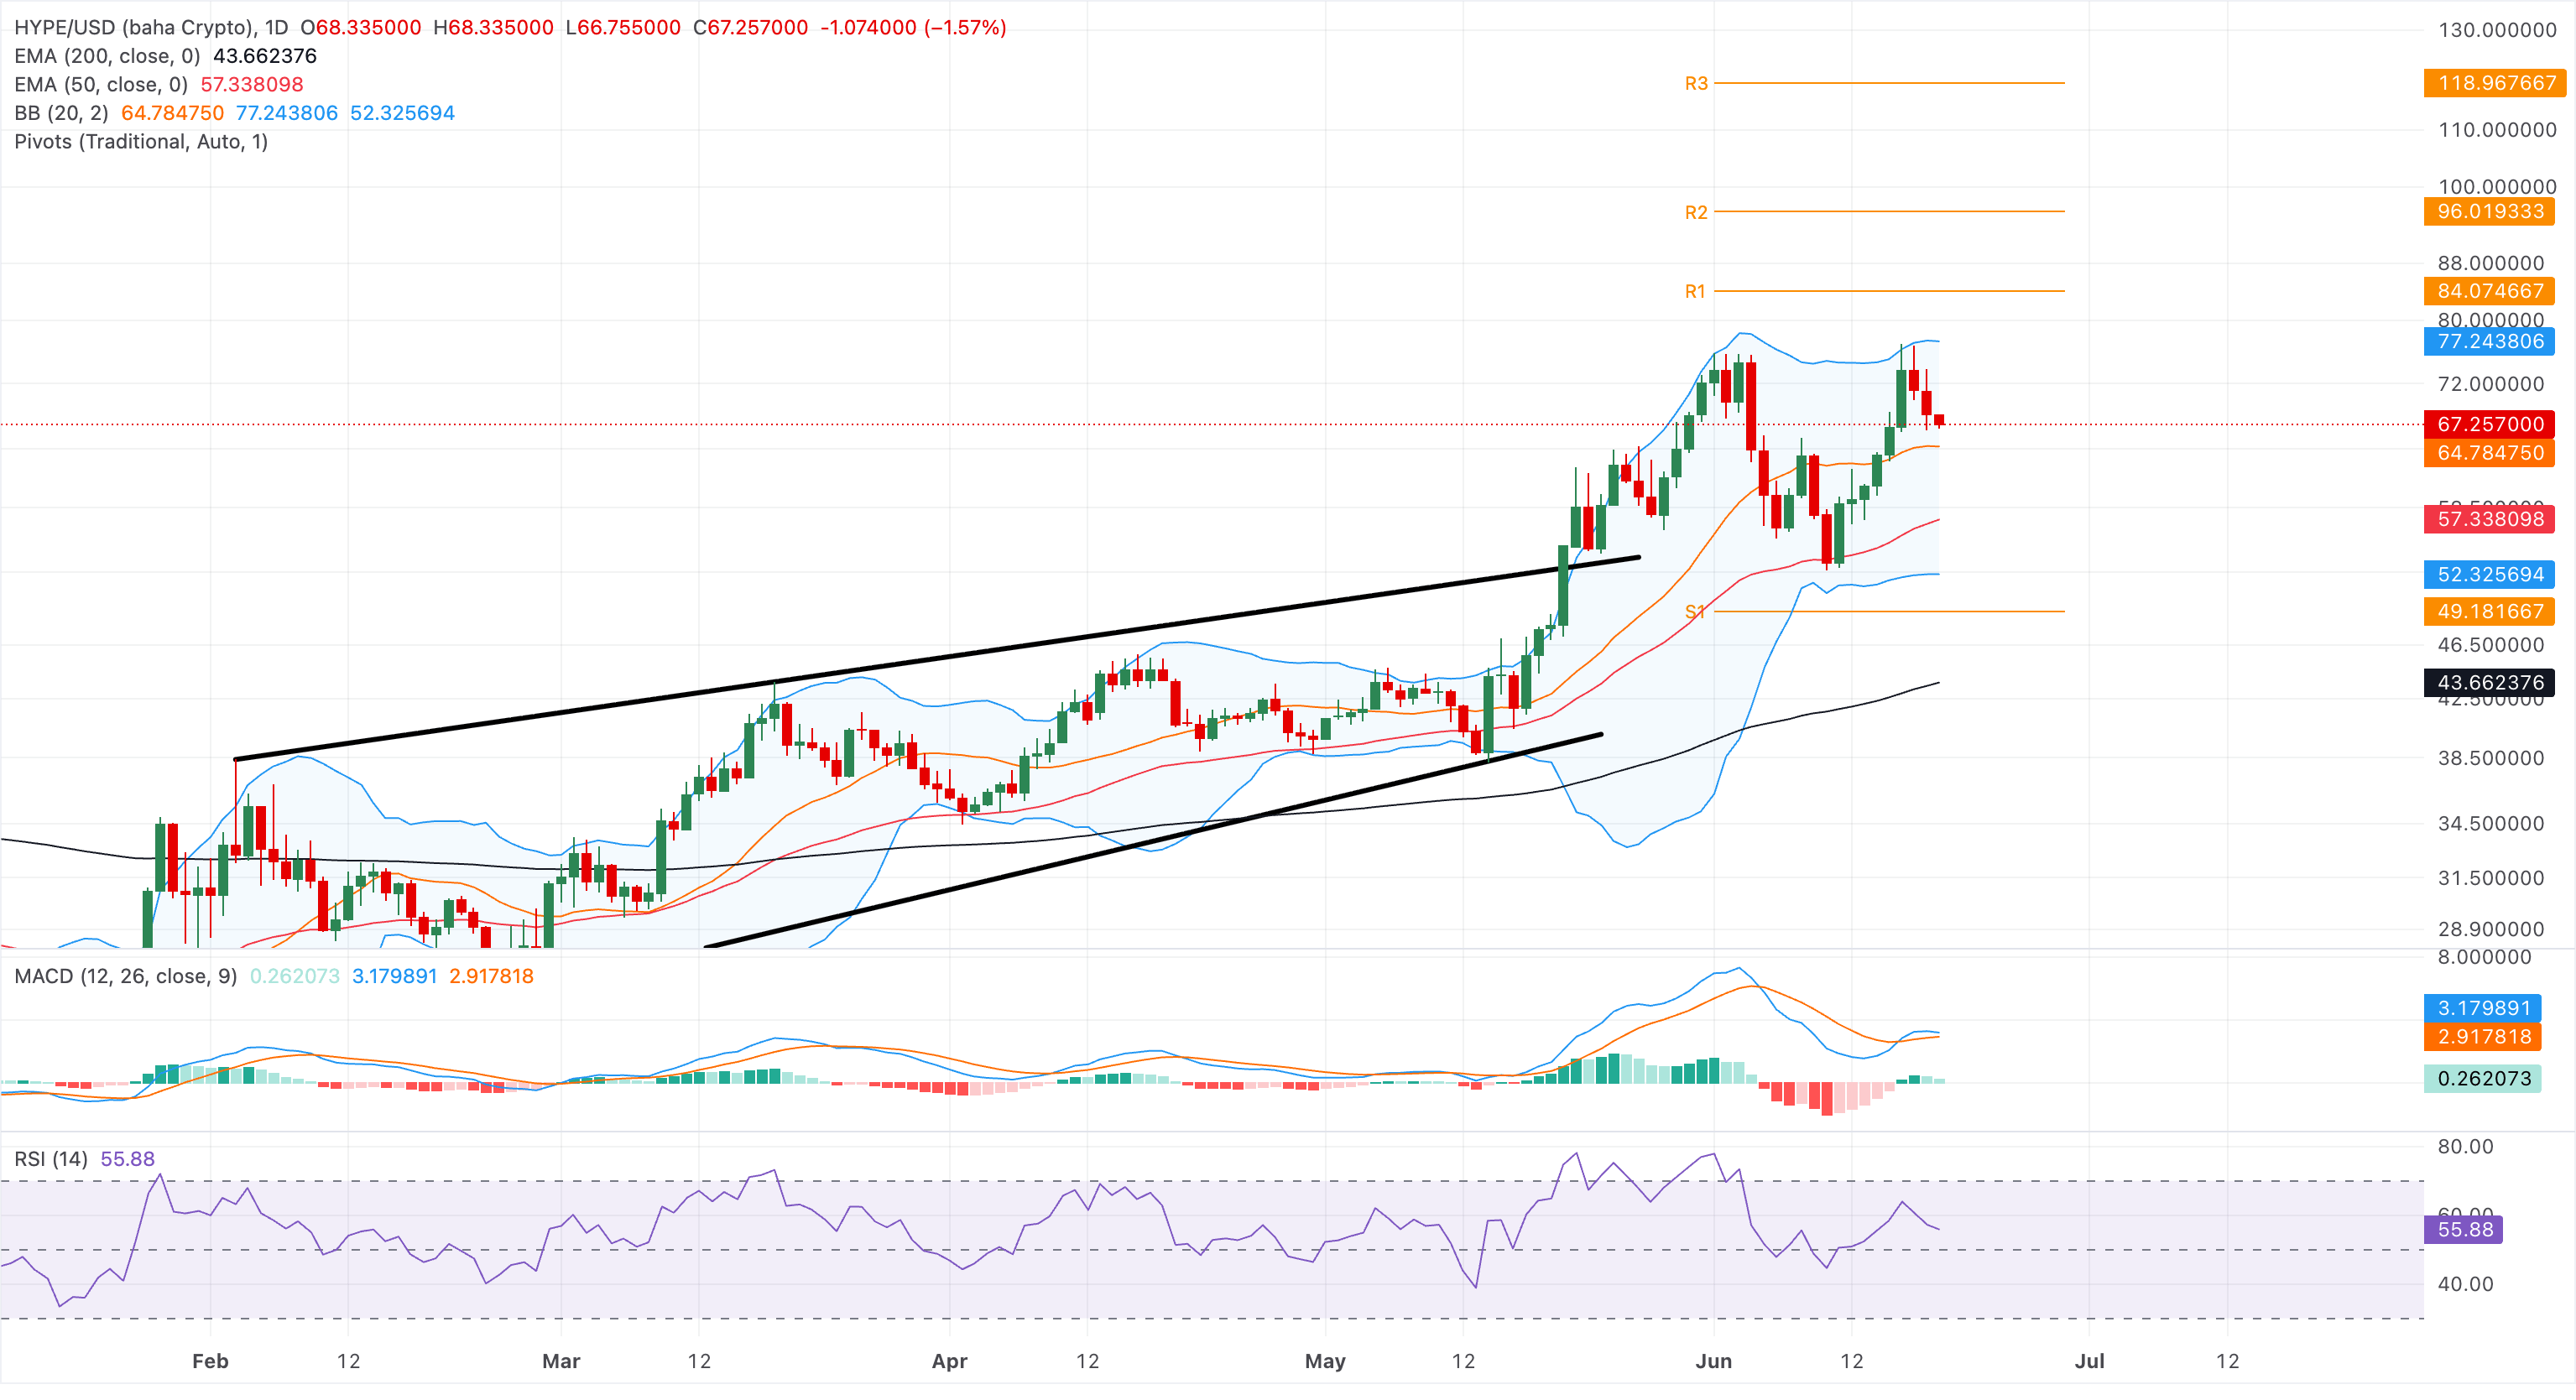
On the topside, the next notable resistance is near the upper Bollinger Band at $77.24, where volatility expansion could encourage profit‑taking.
(The technical analysis of this story was written with the help of an AI tool.)

Über eine Million Nutzer verlassen sich auf FXStreet für Echtzeit-Marktdaten, Charting-Tools, Experteneinblicke und Forex-News. Der umfassende Wirtschaftskalender und die Bildungs-Webinare helfen Tradern, informiert zu bleiben und fundierte Entscheidungen zu treffen. FXStreet wird von einem Team von rund 60 Fachleuten getragen, verteilt auf den Hauptsitz in Barcelona und verschiedene Regionen weltweit.
Weiterlesen


