
Ethereum Price Forecast: Derivatives sentiment remains weak after open interest and funding rates reset
Von Michael Ebiekutan
Aktualisiert: 17 Jun 2026


BELIEBTE ARTIKEL

Ethereum (ETH) derivatives have remained subdued following the price decline over the past few weeks.
Ethereum price today: $1,740
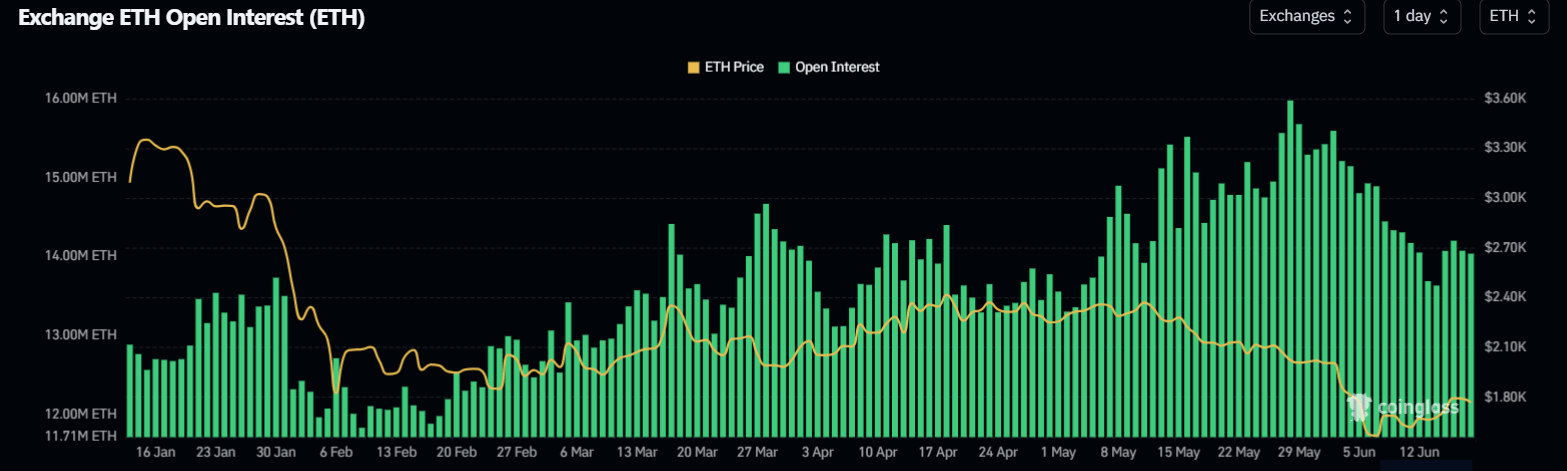
- Ethereum futures have seen a capital decline of roughly 2 million ETH since May 28.
- Funding rates indicate a lack of decisive directional action from both bulls and bears.
- ETH is facing pressure within the tight $1,741-$1,806 range, with the 20-day EMA acting as key resistance.
Ethereum (ETH) derivatives have remained subdued following the price decline over the past few weeks. Accelerated by ETH's drop below $1,600, open interest in the top altcoin fell to 13.64 million ETH on Sunday, its lowest level since early May, before seeing a slight recovery on Monday after the bounce above $1,700.
Open interest is the total worth of unsettled contracts in a derivatives market. Since May 28, ETH futures have seen a capital decline of roughly 2 million ETH, representing a strong risk-off sentiment among leveraged traders.
Funding rates also hint at a similar sentiment, hovering between negative and positive values over the past two weeks.
Funding rates are periodic payments between long and short traders in perpetual futures to keep a contract's price anchored to its underlying spot counterpart. When rates are positive, long traders pay shorts, indicating dominant bullish positioning and vice versa when rates are negative.
Bulls have struggled to regain dominance since the June 5 reset, which initially pushed funding rates into negative territory after nearly a month of positive values. This comes despite the recent slight recovery in prices. Considering the heavy liquidations several longs suffered after placing bets on a price recovery between late May and early June, such sentiment is expected to linger until a major market catalyst appears.
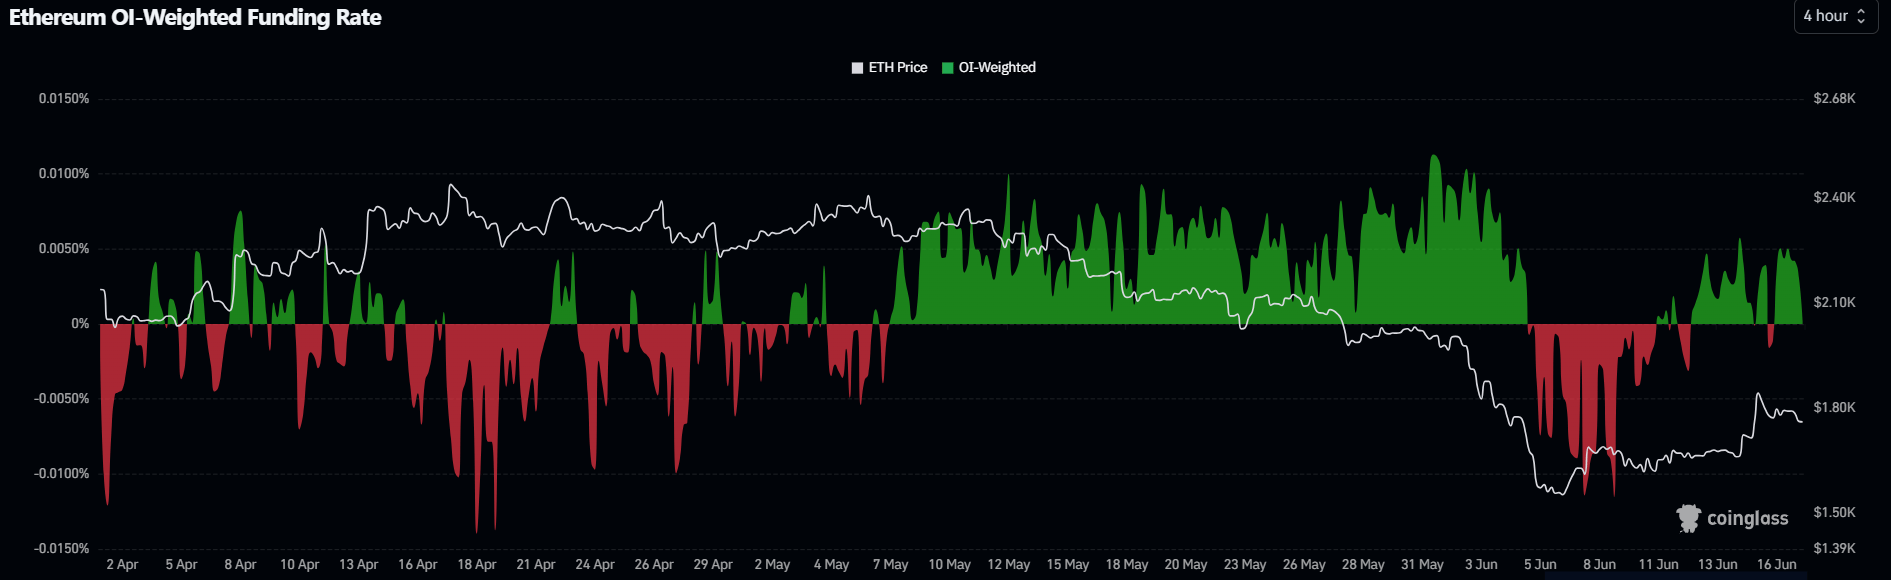
The funding rates data also indicates weakness in bearish pressure, as a majority of short traders appear to have moved to the sidelines after booking profits over the past two weeks.
On the spot side, ETH exchange reserves have dropped modestly over the past two days, offsetting its slight rise last week. Similarly, US spot ETH exchange-traded funds (ETFs) recorded a second consecutive day of net inflow worth $9.6 million on Tuesday, per SoSoValue data.
The weak values in both metrics reflect a lack of conviction among retail and institutional investors.
Ethereum Price Forecast: ETH struggles within tight $1,741-$1,806 range
On the daily chart, ETH is maintaining a bearish near-term bias as price holds below the 20-, 50- and 100-day Exponential Moving Averages (EMAs) clustered between roughly $1,794 and $2,109. This configuration suggests rallies remain capped for now, even as the Relative Strength Index (RSI) recovers toward the mid-40s and the Stochastic Oscillator (Stoch) pushes into overbought territory, hinting at fading downside momentum but not yet a decisive shift in trend.
On the topside, initial resistance emerges at the 20-day EMA near $1,794, followed closely by the horizontal barrier at $1,806, while a move above $1,909 would open the way toward the 50-day EMA around $1,955 and then $2,019. Further resistance is at $2,108, where a dense confluence with the 100-day EMA could cap advances.
On the downside, immediate support is seen at $1,741, with further cushions at $1,524 and $1,405. A break below these levels would expose the next major floor near $1,156.
(The technical analysis of this story was written with the help of an AI tool.)

Über eine Million Nutzer verlassen sich auf FXStreet für Echtzeit-Marktdaten, Charting-Tools, Experteneinblicke und Forex-News. Der umfassende Wirtschaftskalender und die Bildungs-Webinare helfen Tradern, informiert zu bleiben und fundierte Entscheidungen zu treffen. FXStreet wird von einem Team von rund 60 Fachleuten getragen, verteilt auf den Hauptsitz in Barcelona und verschiedene Regionen weltweit.
Weiterlesen


