
Ethereum Price Forecast: ETH faces distribution, falters at 50-day EMA
Von Michael Ebiekutan
Aktualisiert: 3 Apr 2026


BELIEBTE ARTIKEL

Ethereum is down roughly 3% as of writing on Thursday, reversing gains captured over the past two days.
Ethereum price today: $2,050
- Ethereum whale and retail wallets have been major sellers over the past week.
- Open interest has dropped to a one-week low of 13.52 million ETH.
- ETH saw a rejection at the 50-day EMA.
Ethereum is down roughly 3% as of writing on Thursday, reversing gains captured over the past two days.
Onchain data paint a mixed picture for the top altcoin, but with a bearish leaning. Over the past week, investors across different cohorts have cracked under pressure.
Whales or wallets with a balance of 10K-100K, which have been major buyers throughout the recent downtrend, offloaded 340K ETH between March 24-30. However, whales flipped back to buying on Tuesday, scooping 270K ETH across the past two days.
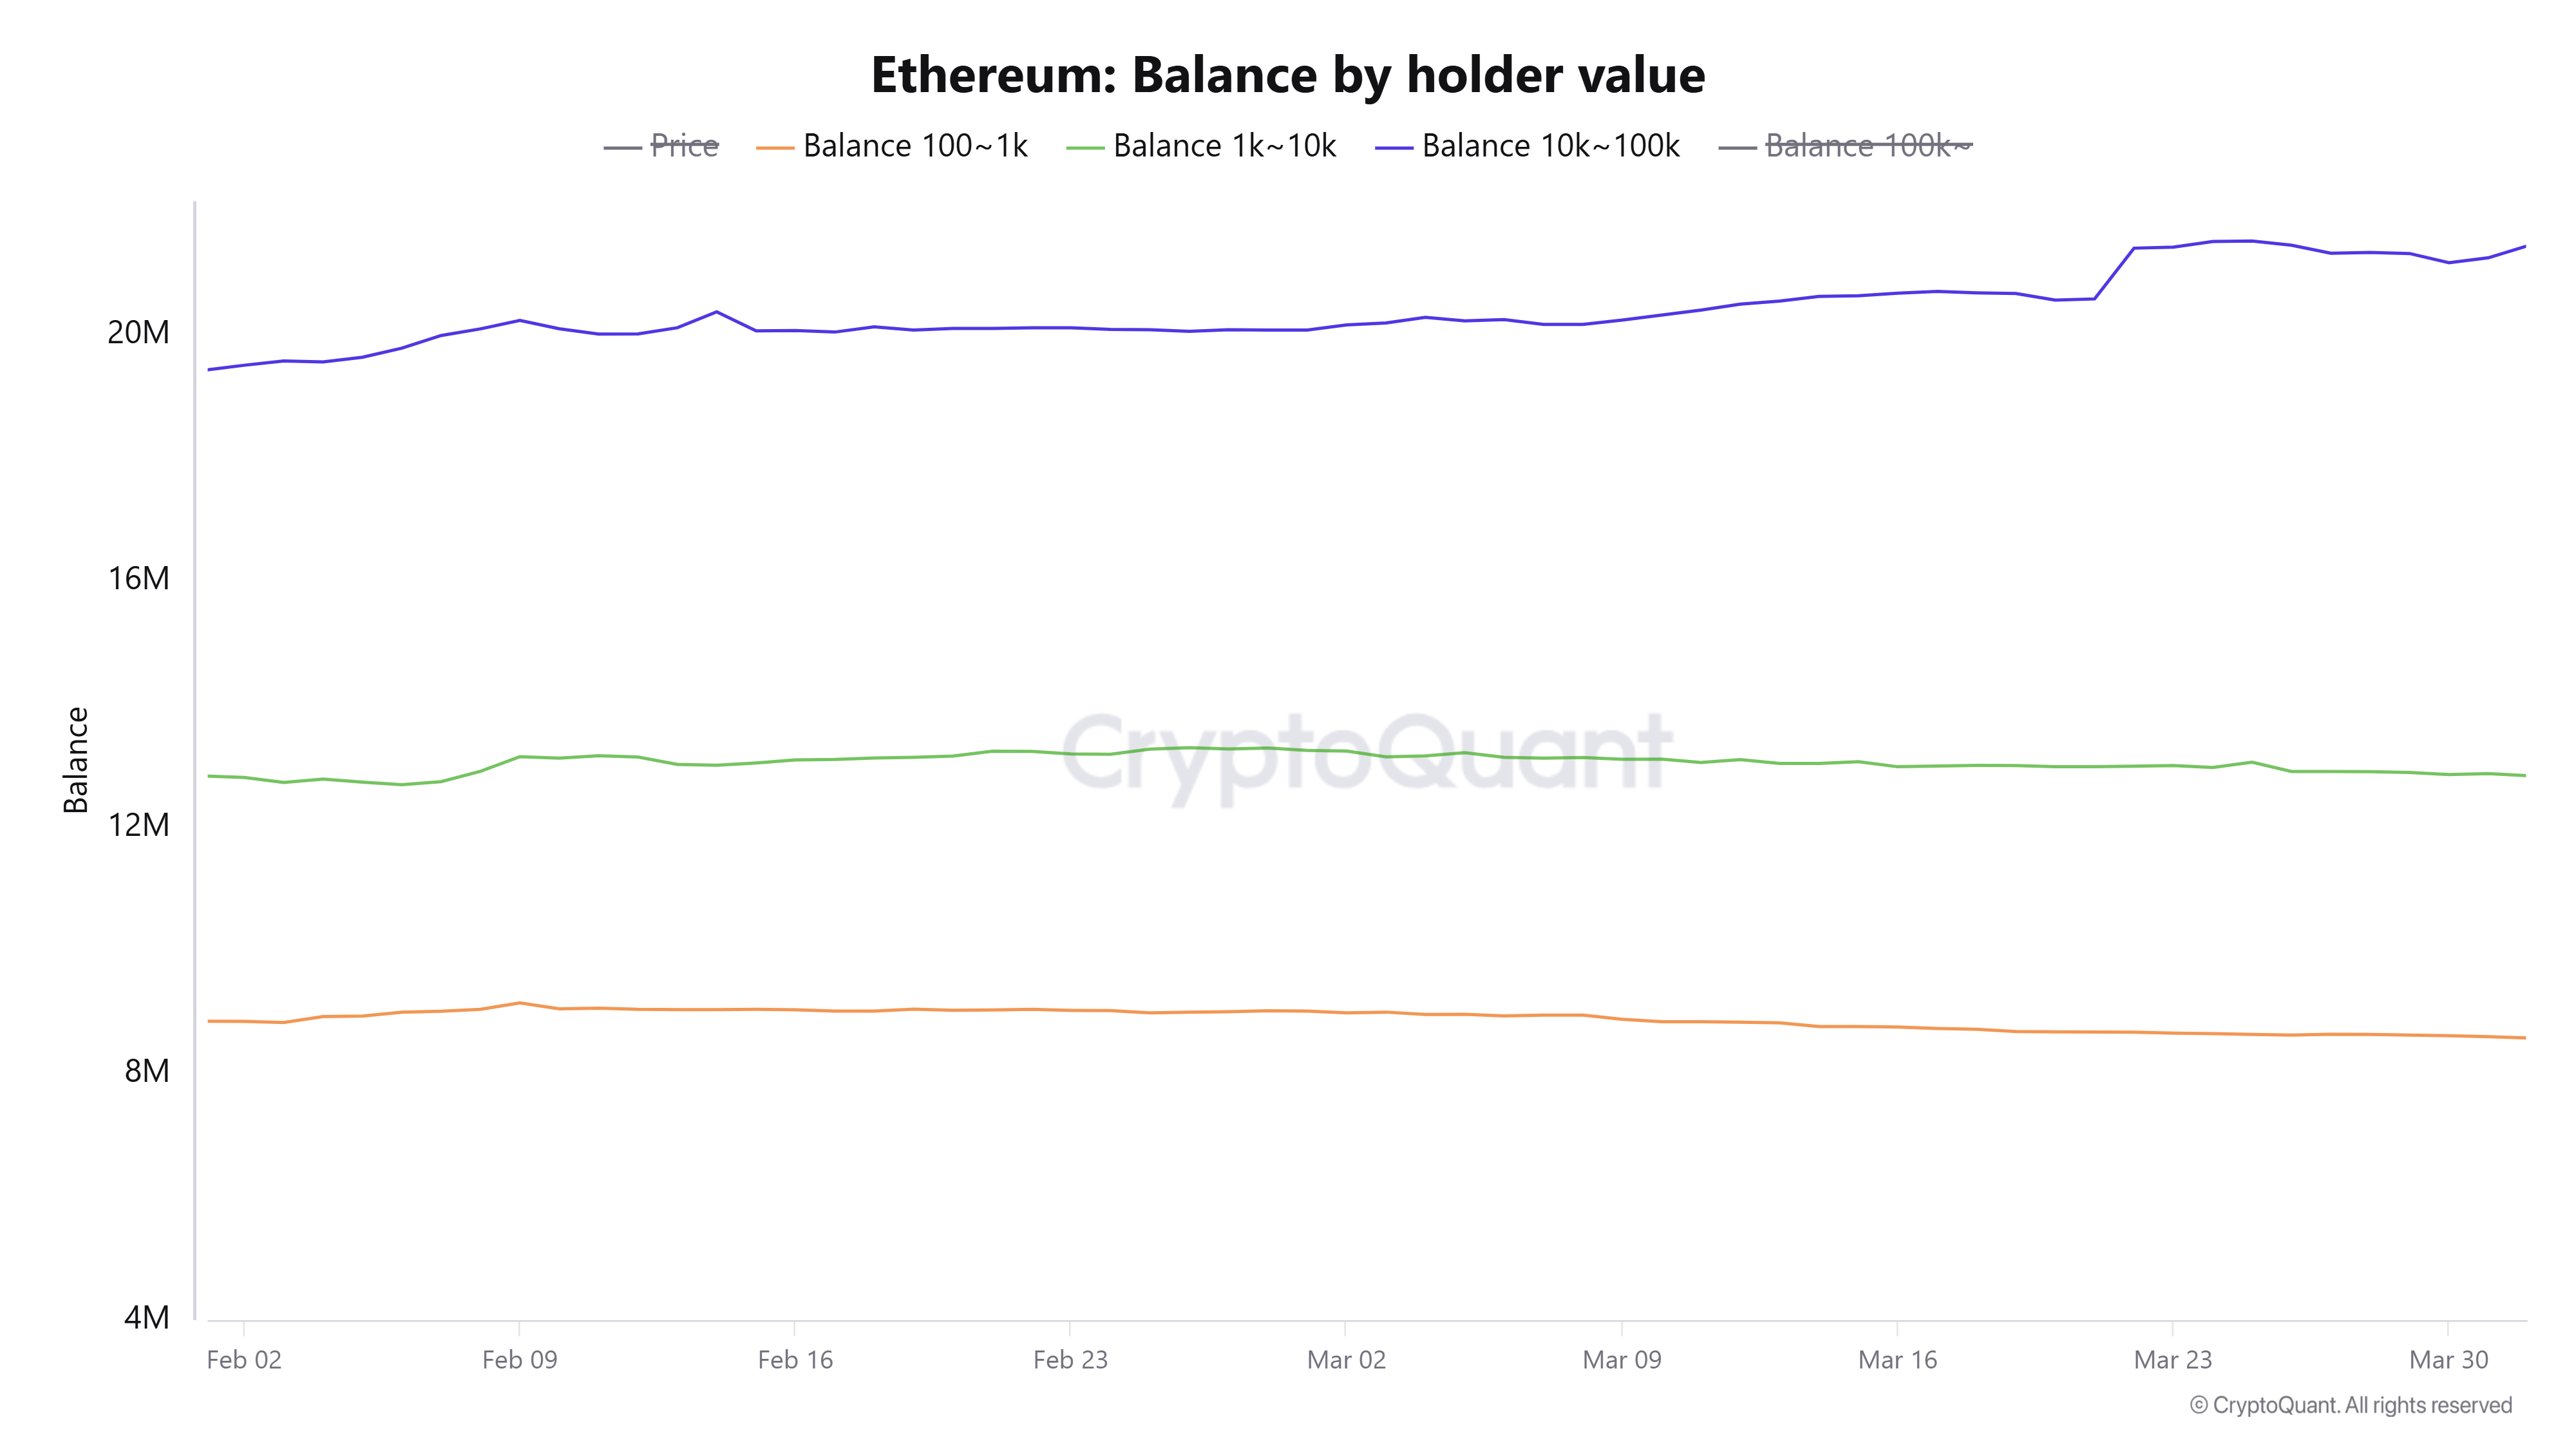
Meanwhile, retailers or wallets with 100-1K and 1K-10K ETH continued distribution, scaling down their holdings by roughly 200K ETH over the past week.
US spot ETH exchange-traded funds (ETFs) have also posted a similar trend. The products have recorded only two days of inflows over the past two weeks of trading, according to SoSoValue data.
On the derivatives side, Ethereum's open interest has been contracting, dropping from 14.6 million to 13.52 million ETH, its lowest level in a week. The drop comes amid consistent flashes of negative funding rates.
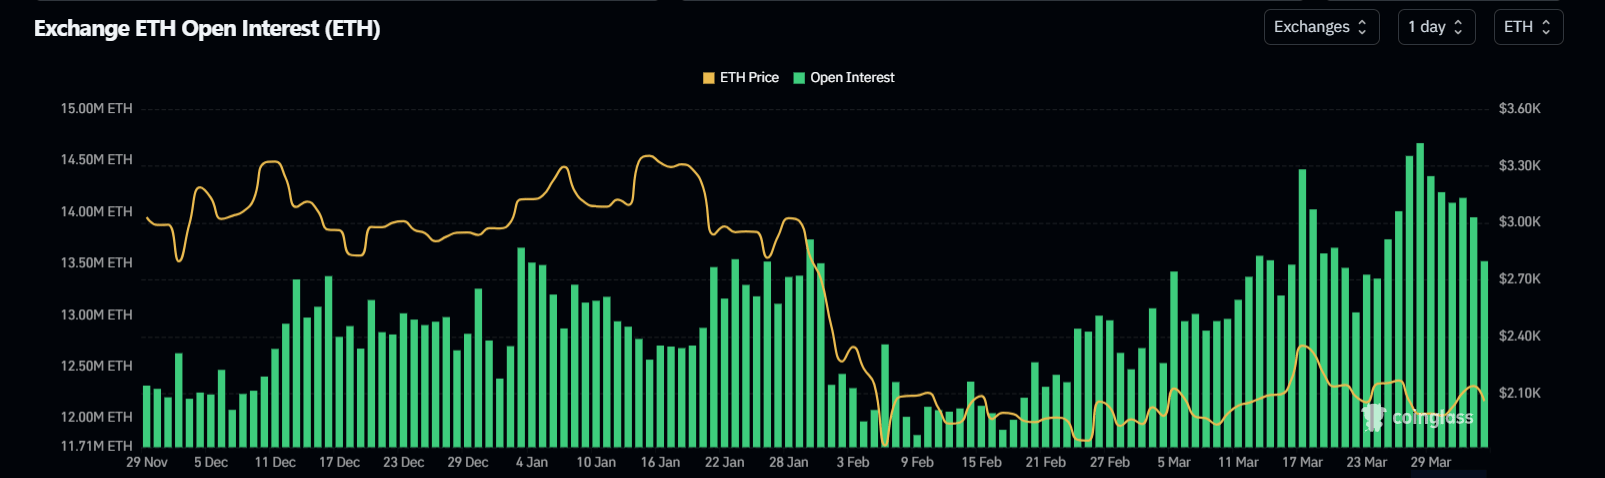
Open interest is the total value of outstanding contracts in a derivatives market, while funding rates are periodic payments between traders that keep a futures contract's price anchored to its spot counterpart.
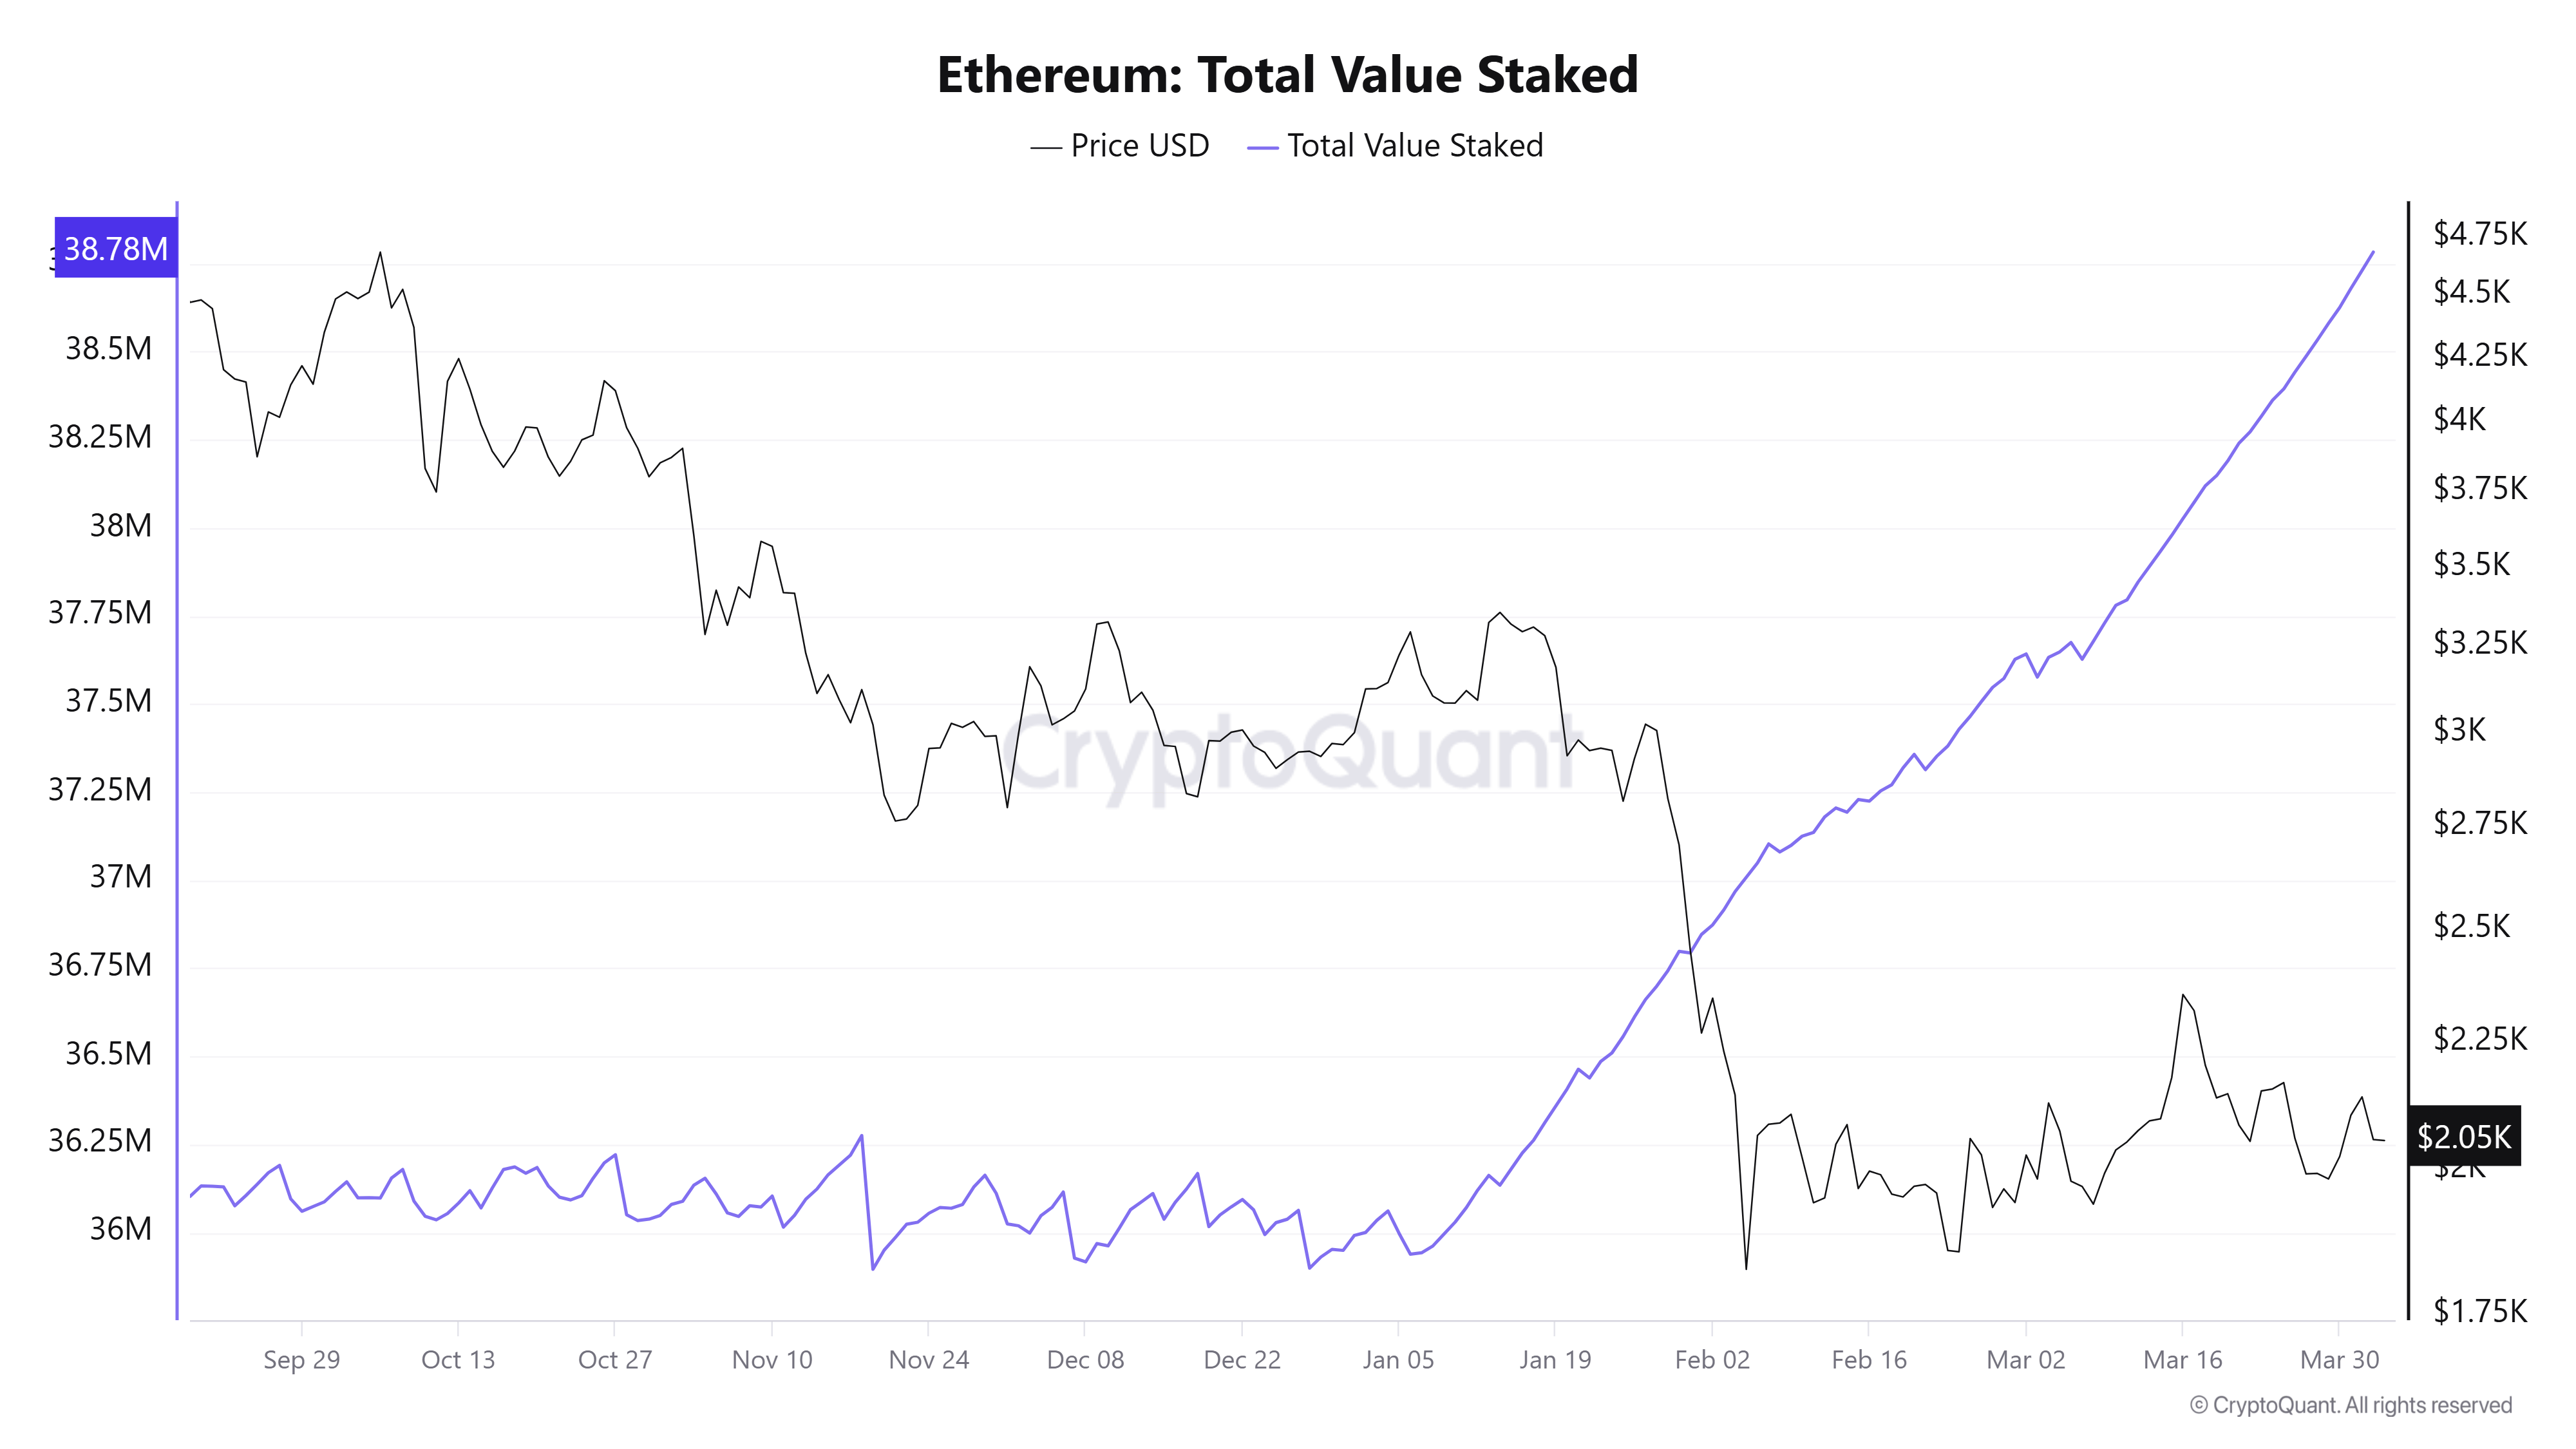
Despite clear indications of distribution, Ethereum has seen strong inflows into staking contracts, with the total amount of staked ETH rising by 1 million ETH over the past month.
Ethereum Price Forecast: ETH falters before 50-day EMA again
Ethereum saw $90.2 million in liquidations over the past 24 hours, driven by $70 million in long liquidations, per Coinglass data.
In the daily chart, ETH trades at $2,055. The near-term bias is neutral, with a slight downside tilt, as price holds below the 20- and 50-day Exponential Moving Averages (EMAs), which cap advances at around $2,080 and $2,160.
The Relative Strength Index (RSI) has slipped back toward the mid-40s, while the Stochastic Oscillator (Stoch) has retreated from near overbought territory, both indicating fading bullish momentum.
Immediate resistance is at the nearby horizontal cap at $2,108, followed by $2,389 and then $2,746. A daily close above $2,108 would be the first step to ease pressure and expose the higher resistance band toward the 100-day EMA and $2,389.
On the downside, initial support is at $1,911, followed by $1,741 and $1,524. As long as ETH remains trapped beneath $2,108 and the descending EMA cluster, the risk of a drift back toward the $1,700 area persists, while only a sustained break above that initial ceiling would stabilize the outlook.
(The technical analysis of this story was written with the help of an AI tool.)

Über eine Million Nutzer verlassen sich auf FXStreet für Echtzeit-Marktdaten, Charting-Tools, Experteneinblicke und Forex-News. Der umfassende Wirtschaftskalender und die Bildungs-Webinare helfen Tradern, informiert zu bleiben und fundierte Entscheidungen zu treffen. FXStreet wird von einem Team von rund 60 Fachleuten getragen, verteilt auf den Hauptsitz in Barcelona und verschiedene Regionen weltweit.
Weiterlesen


