
Ethereum Price Forecast: Increased derivatives demand spurred ETH's rise after US-Iran ceasefire
Von Michael Ebiekutan
Aktualisiert: 11 Apr 2026


BELIEBTE ARTIKEL

Ethereum (ETH) saw major improvements across key onchain metrics after the US-Iran ceasefire announcement on Tuesday, according to a CryptoQuant analysis. The top altcoin rose by 6% within 24 hours following the move, its largest single-day gain in more than a month.
Ethereum price today: $2,230
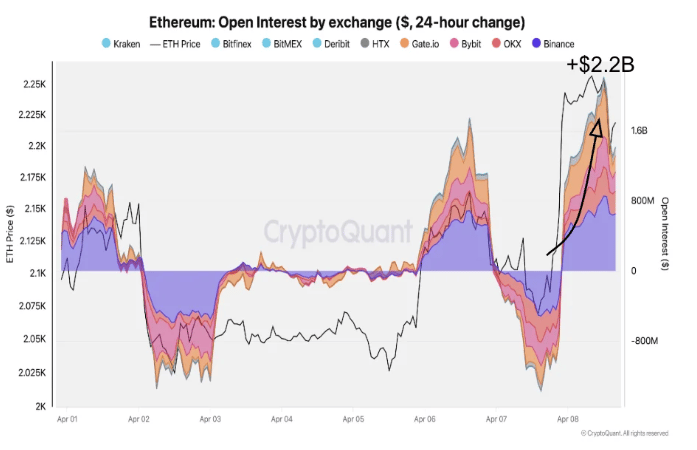
- Ethereum's open interest spiked by $2.2 billion following the US-Iran ceasefire.
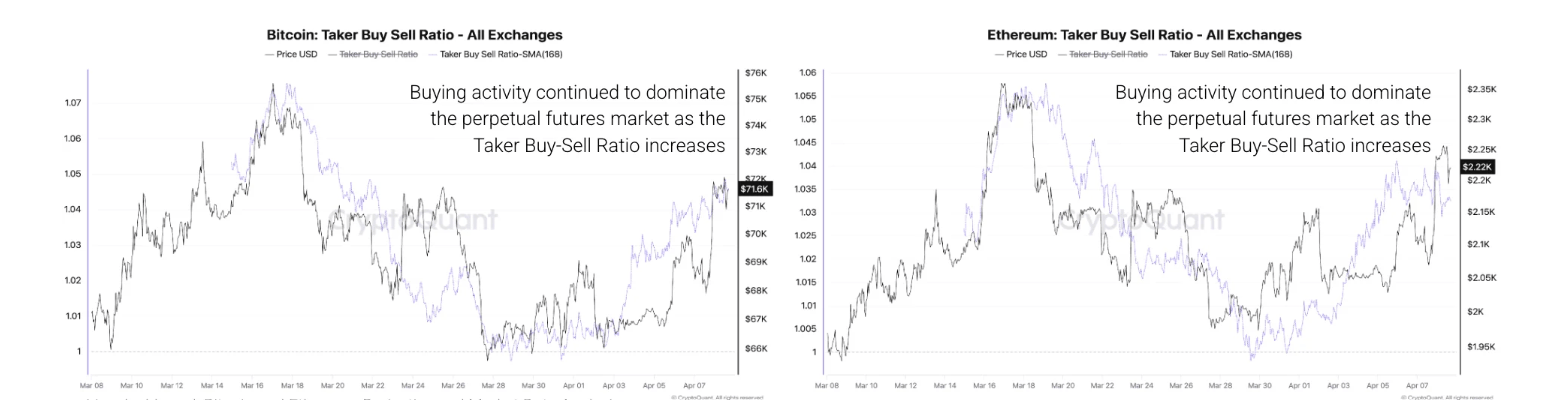
- Buyers are dominating the ETH futures market following a sustained upward tilt in the Taker Buy-Sell Ratio.
- ETH has recovered the $2,210 level after bouncing off the 50-day EMA.
Ethereum (ETH) saw major improvements across key onchain metrics after the US-Iran ceasefire announcement on Tuesday, according to a CryptoQuant analysis. The top altcoin rose by 6% within 24 hours following the move, its largest single-day gain in more than a month.
In a report late Thursday, the crypto analytics firm highlighted that USD-denominated open interest for ETH jumped by $2.2 billion, approaching levels last seen nearly a month ago.
"Crucially, coin-denominated open interest (OI) also increased significantly [...] ruling out short liquidations as the primary driver and confirming that traders are opening net new long positions," wrote CryptoQuant analysts.
The report also noted a sustained upward tilt in Ethereum's Taker Buy-Sell Ratio, indicating that buyers are dominating the top altcoin's perpetual futures market.
The Taker Buy-Sell Ratio measures the difference in trading volume between buyers and sellers in perpetual futures markets.
A similar positioning is observed among Bitcoin (BTC) traders, suggesting they expect a steady improvement in macro conditions, "at least from the short-term," the analysts wrote.
Meanwhile, the ETH Coinbase Premium Index also flipped positive, showing an increase in US demand. "If the ceasefire holds and no escalatory news emerges over the next two weeks, the Coinbase premium could sustain positive territory, reinforcing the bullish price trajectory," the report stated.
Ethereum Price Forecast: ETH holds above $2,210 after 50-day EMA bounce
Ethereum saw $54.4 million in liquidations over the past 24 hours, driven by $34.5 million in short liquidations, per Coinglass data.
On the daily chart, ETH trades at $2,234, maintaining a constructive bullish bias as price holds above the 20-day and 50-day Exponential Moving Averages (EMAs) at $2,128 and $2,156, respectively. This positioning suggests dip-buying interest on pullbacks, even as the pair approaches a dense resistance band defined first by the 100-day EMA at $2,386 and then by a horizontal barrier at $2,388.
Momentum remains supportive, with the Relative Strength Index (RSI) near 61 indicating a firm positive tone, though the Stochastic Oscillator (Stoch) hovering in overbought territory could spur a short-term pause in price growth.
On the downside, initial support is seen at the horizontal level of $2,210, ahead of the 50-day EMA at $2,156 and the 20-day EMA at $2,128, with a deeper cushion emerging at $2,108. A break below this cluster would expose $1,909 and then $1,741 as the next notable demand areas.
On the topside, immediate resistance is located at the convergence of the 100-day EMA and the horizontal cap at $2,388. A sustained move above this zone would open the way toward $2,746.
(The technical analysis of this story was written with the help of an AI tool.)

Über eine Million Nutzer verlassen sich auf FXStreet für Echtzeit-Marktdaten, Charting-Tools, Experteneinblicke und Forex-News. Der umfassende Wirtschaftskalender und die Bildungs-Webinare helfen Tradern, informiert zu bleiben und fundierte Entscheidungen zu treffen. FXStreet wird von einem Team von rund 60 Fachleuten getragen, verteilt auf den Hauptsitz in Barcelona und verschiedene Regionen weltweit.
Weiterlesen


