
Ethereum Price Forecast: Whales buy the dip, but institutional and US demand remain absent
Von Michael Ebiekutan
Aktualisiert: 16 Jun 2026


BELIEBTE ARTIKEL

Ethereum (ETH) large holders have leveraged the price dip from the past two weeks to expand their holdings.
Ethereum price today: $1,790
- Ethereum whales have accumulated 510K ETH since the top altcoin's dip below $1,600.
- Institutional demand from the US is non-evident, keeping market structure fragile despite the recent price recovery.
- ETH is struggling to reclaim the 20-day EMA.
Ethereum (ETH) large holders have leveraged the price dip from the past two weeks to expand their holdings.
Wallets with a balance of 10K-100K ETH have added roughly 510K ETH to their collective balance since June 5, when the top altcoin approached the $1,500 level. This dip-buying pressure has partly helped push ETH toward $1,800.
On the other hand, retail investors or wallets with a balance of 100-1K and 1K-10K ETH recorded minimal changes in their holdings during the same period, indicating that the cohort remains largely on the sidelines, neither contributing to buying nor selling pressure.
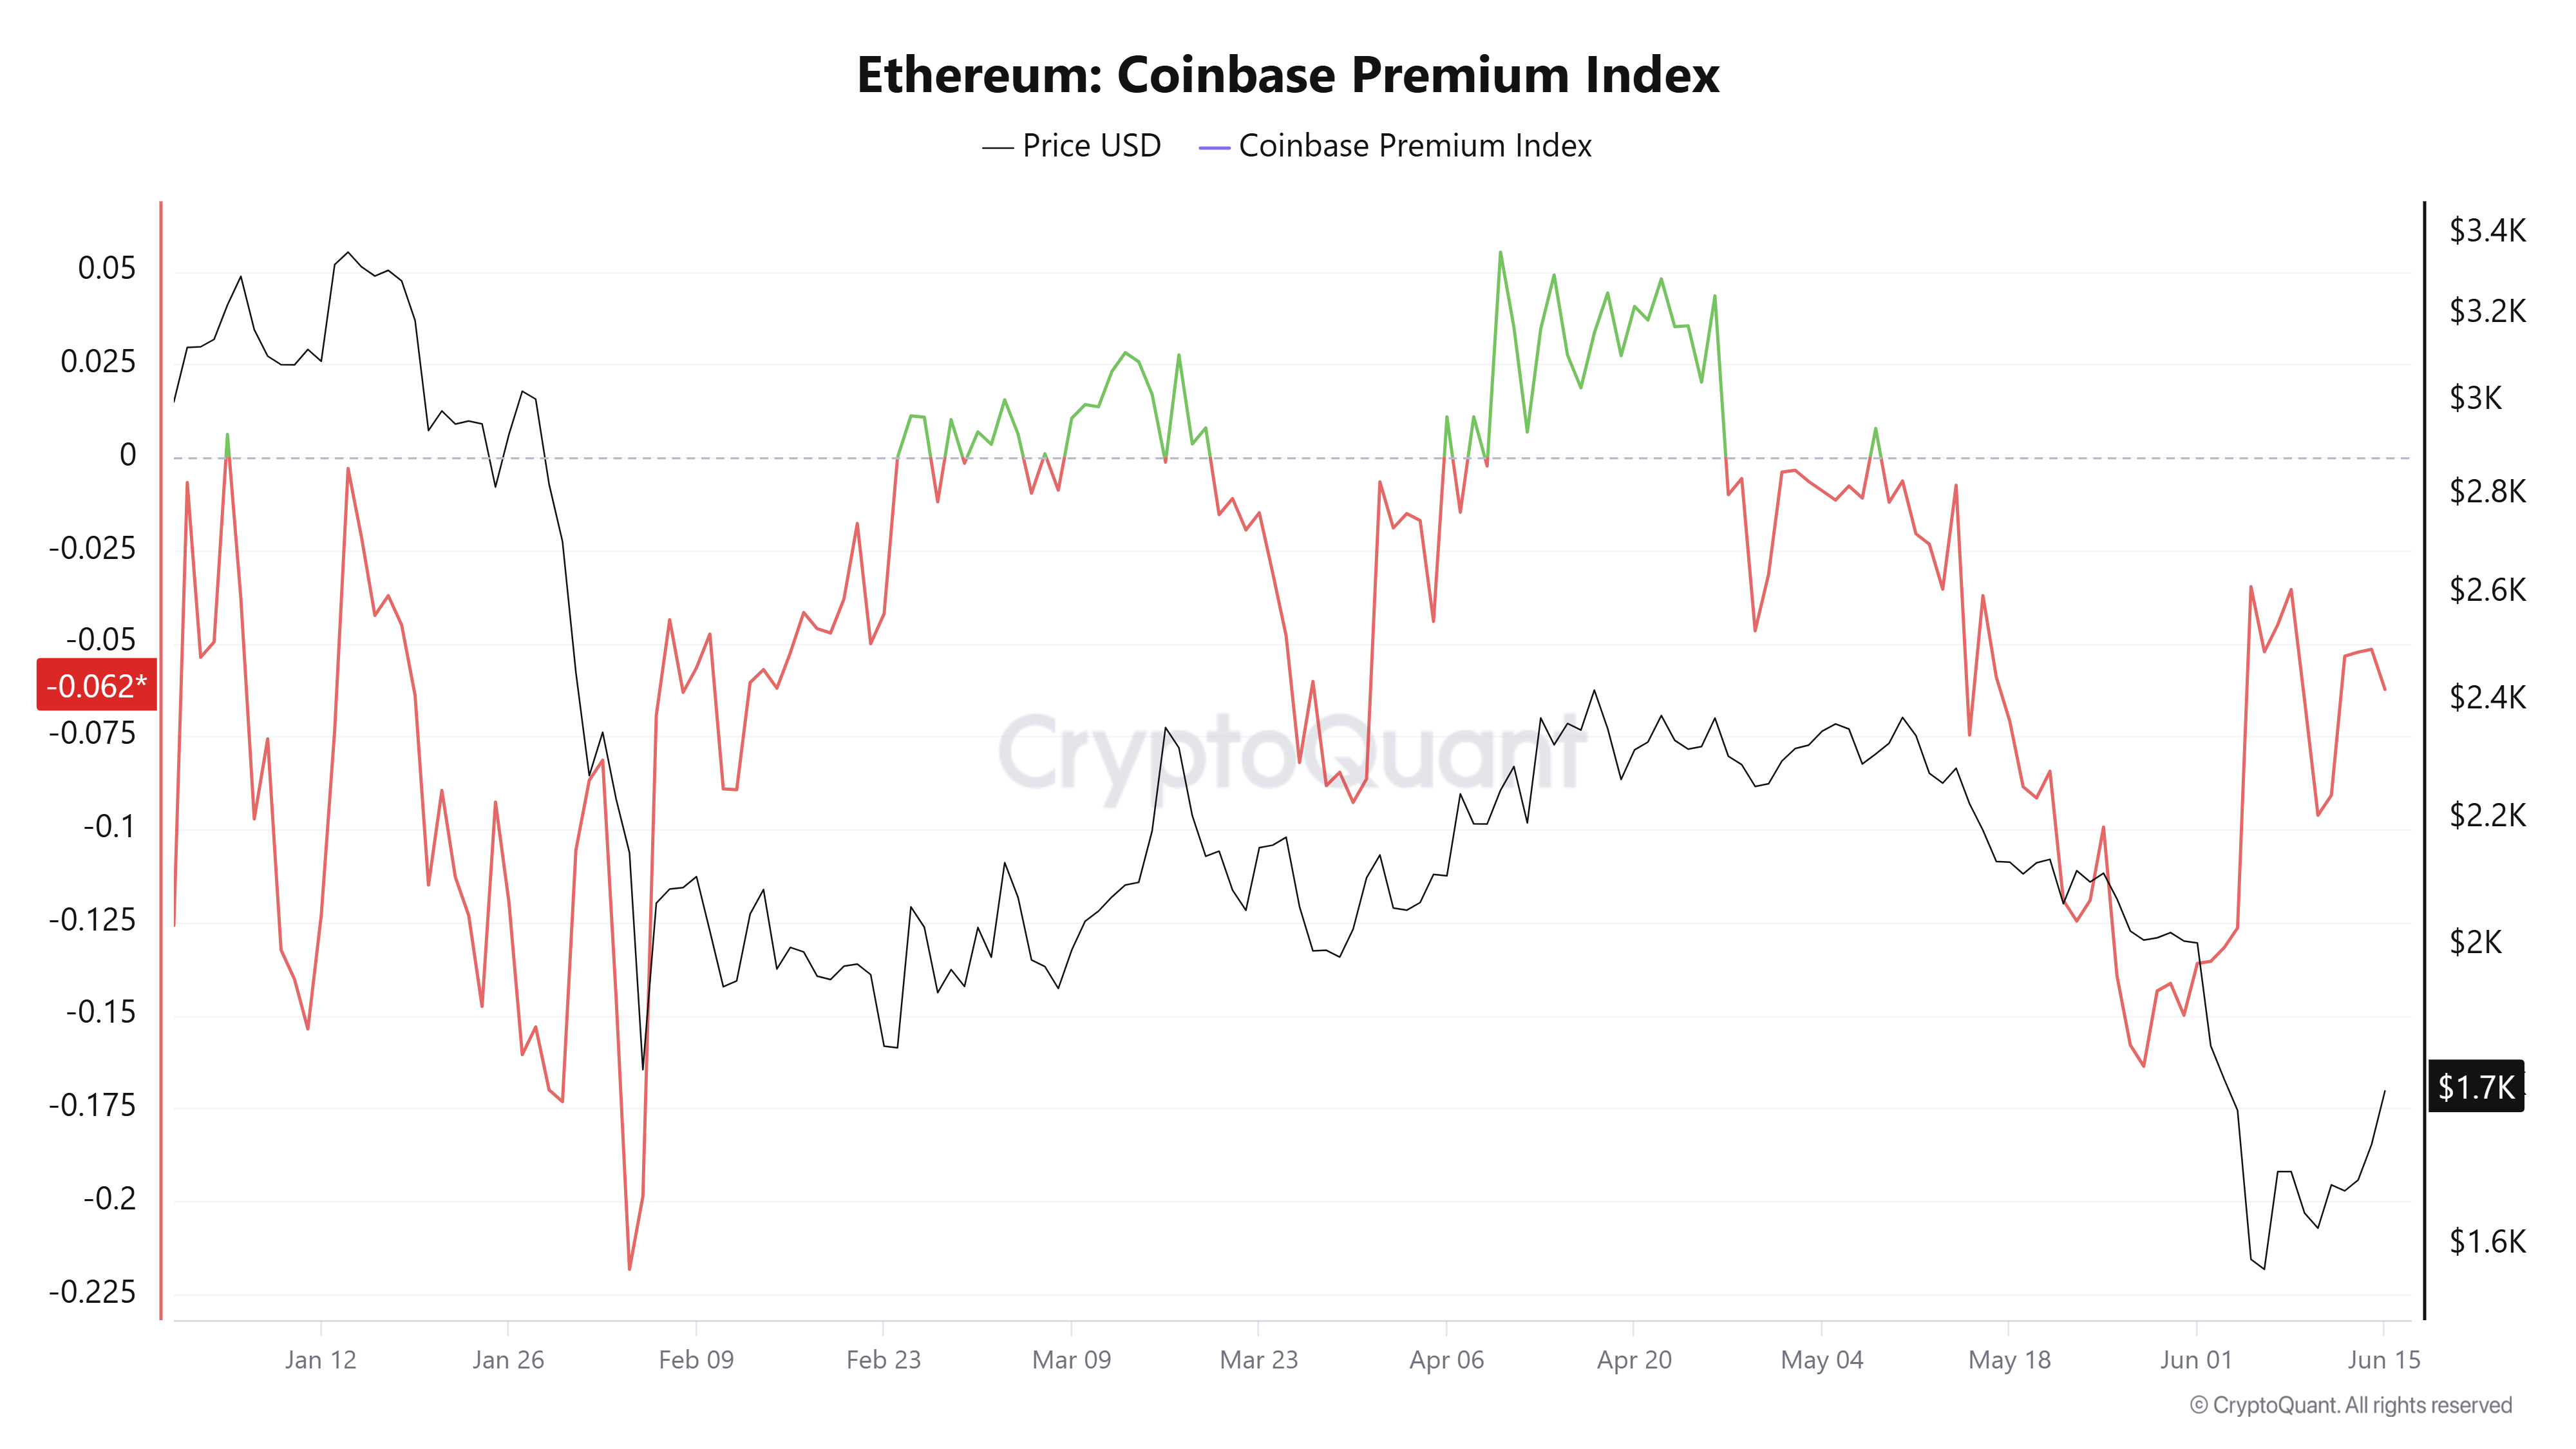
Regionally, the Coinbase Premium Index, an indicator of US sentiment, has improved slightly from levels observed in the past two weeks but remains below its neutral level.
Similarly, US spot ETH exchange-traded funds (ETFs) recorded $22.5 million in net inflows after four consecutive days of net outflows, according to SoSoValue data. The products have only recorded three inflow days since March 8. The underlying market structure could remain fragile until institutional demand from the US expands.
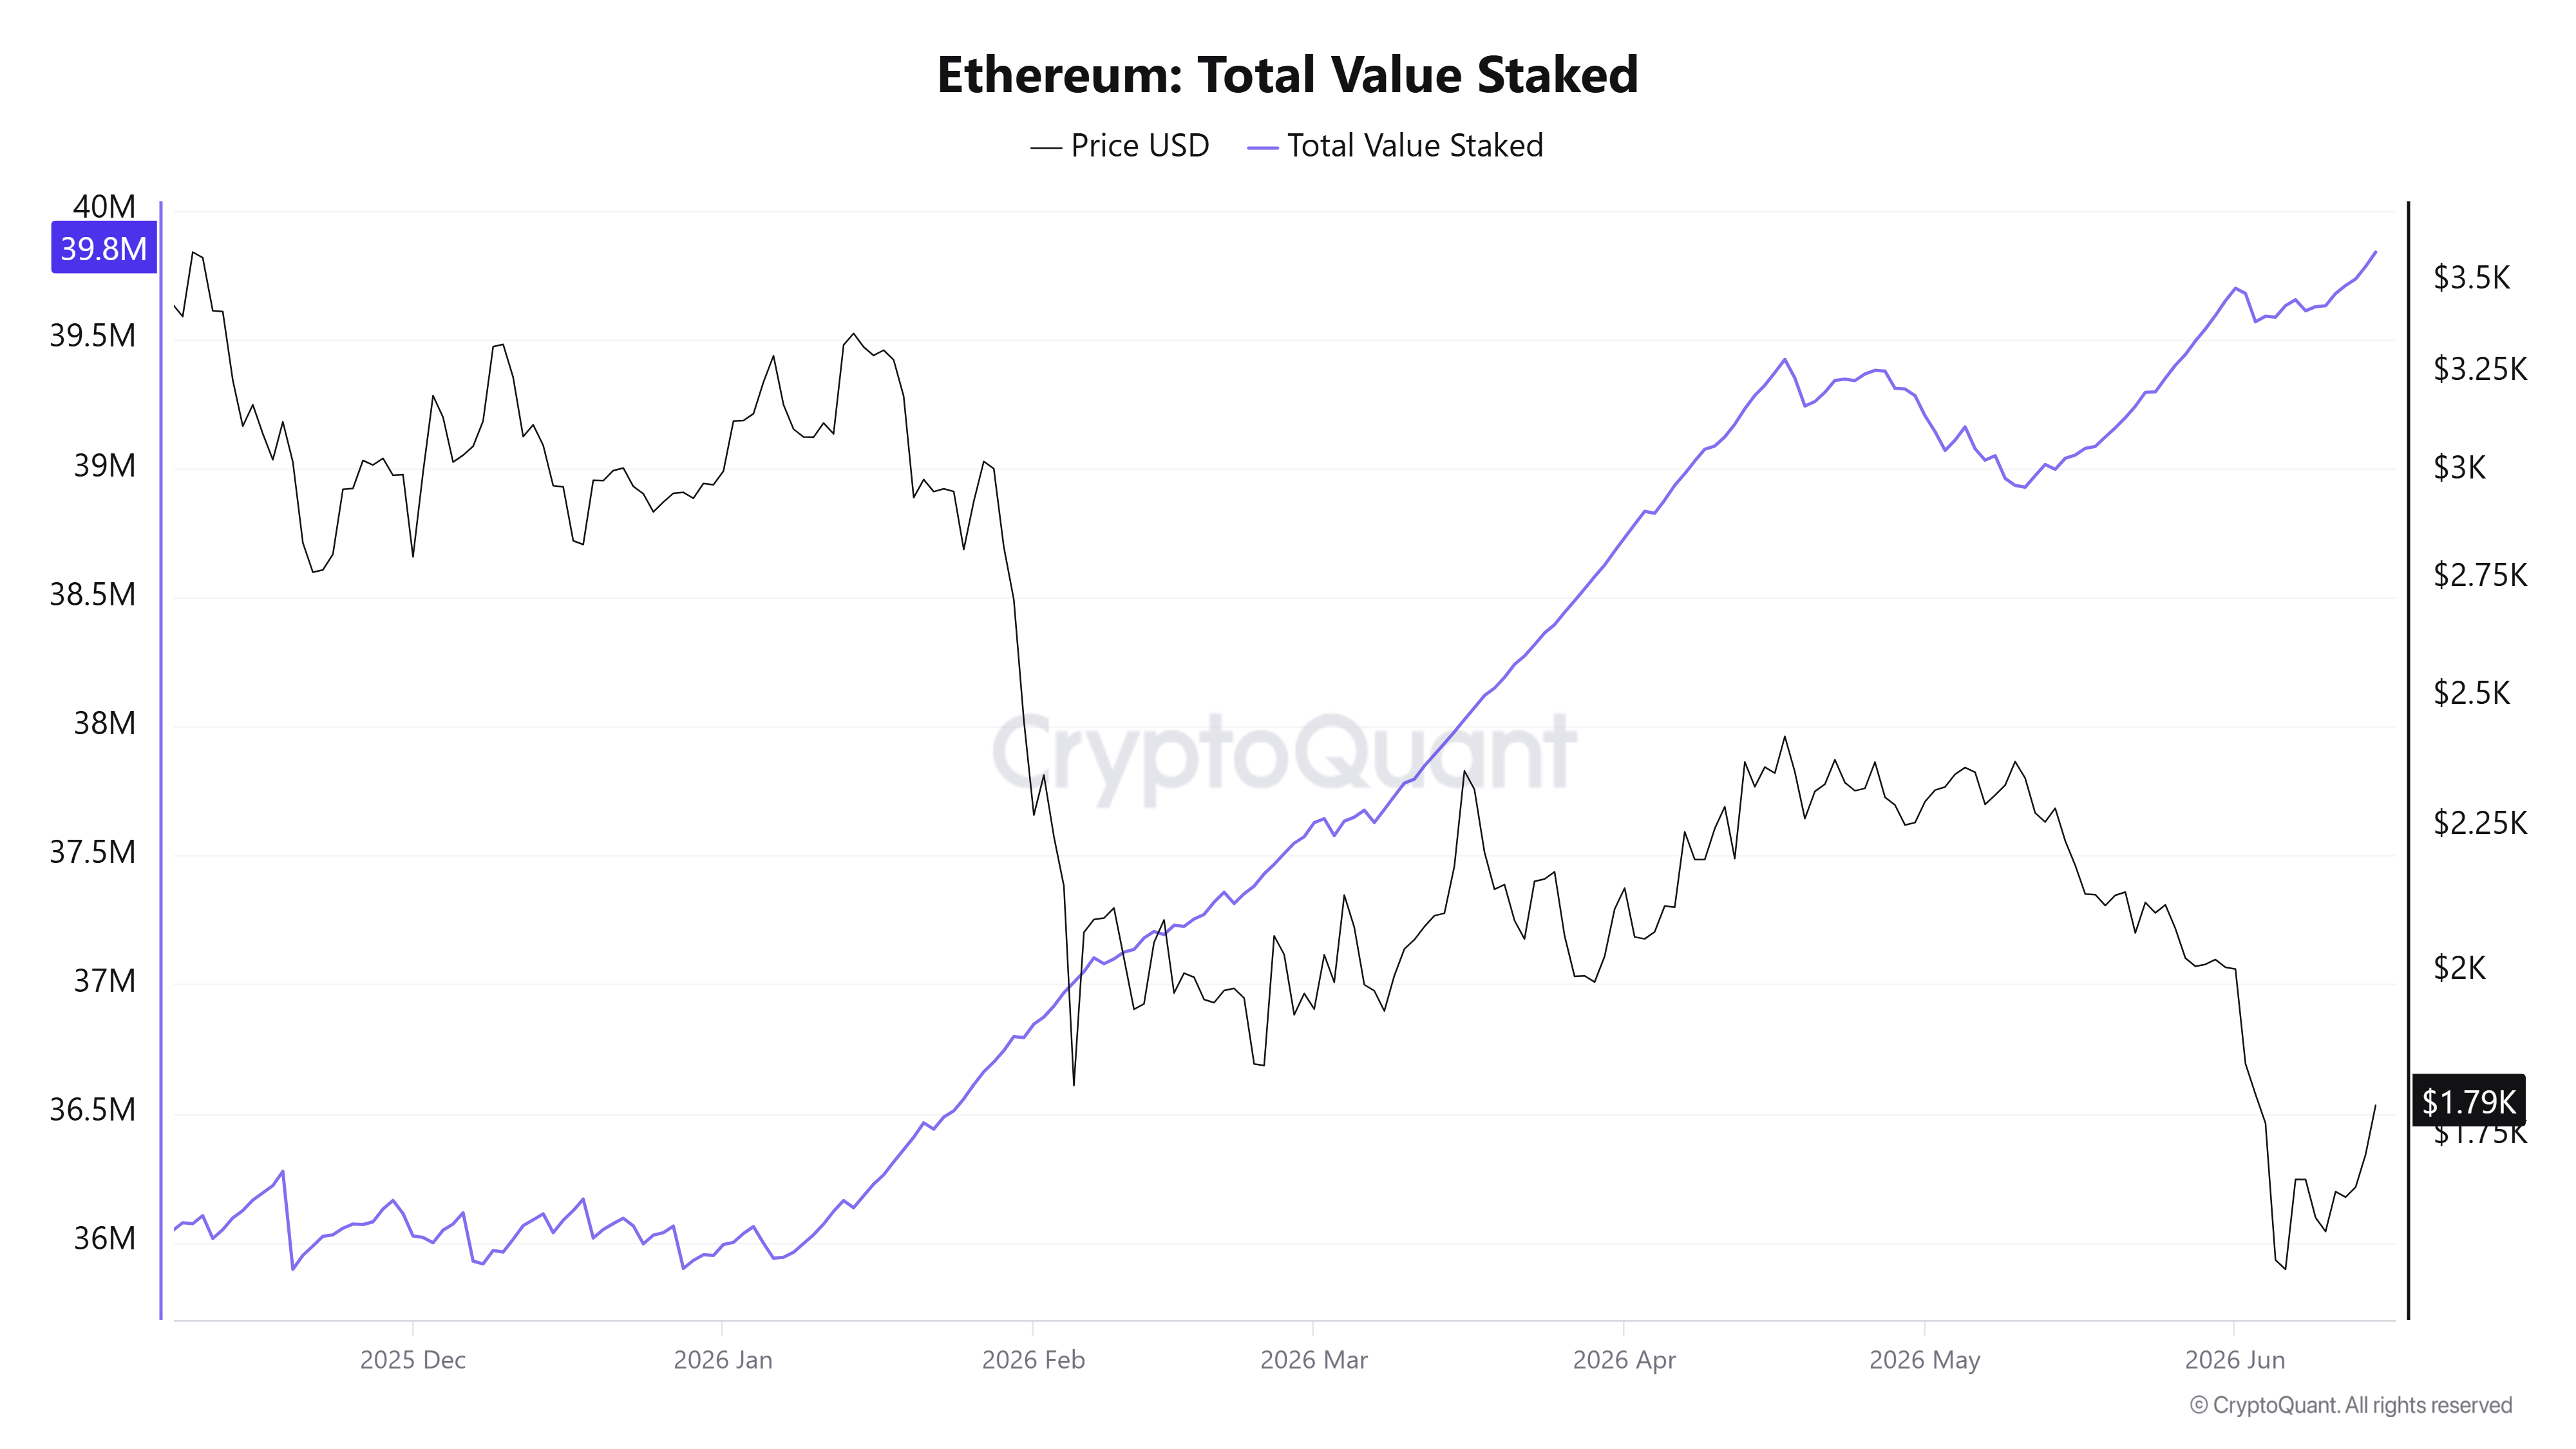
Meanwhile, the total amount of staked ETH continues to grow, reaching a record 39.83 million ETH despite the market weakness.
Ethereum Price Forecast: ETH struggles to reclaim 20-day EMA
On the daily chart, ETH is maintaining a capped bearish tone, with price remaining below the 20-, 50- and 100-day Exponential Moving Averages (EMAs), clustered between roughly $1,800 and $2,115. The immediate hurdle is the 20-day EMA at $1,796, sitting just above spot price and reinforcing near-term downside risk, while the mildly sub-neutral Relative Strength Index (RSI) around 45 hints at fading selling pressure even as the overbought Stochastic near 74 warns that the latest bounce may struggle to extend.
On the topside, initial resistance is aligned at $1,806, ahead of a broader supply band defined by the $1,909 horizontal level, the 50-day EMA near $1,962 and the $2,019 barrier. Additional hurdles are at $2,108, the 100-day EMA around $2,115 and $2,211 before a more distant cap at $2,389.
On the downside, immediate support emerges at $1,741, with further floors at $1,524 and $1,405, while a break below these would expose the deeper demand zone near $1,156.
(The technical analysis of this story was written with the help of an AI tool.)

Über eine Million Nutzer verlassen sich auf FXStreet für Echtzeit-Marktdaten, Charting-Tools, Experteneinblicke und Forex-News. Der umfassende Wirtschaftskalender und die Bildungs-Webinare helfen Tradern, informiert zu bleiben und fundierte Entscheidungen zu treffen. FXStreet wird von einem Team von rund 60 Fachleuten getragen, verteilt auf den Hauptsitz in Barcelona und verschiedene Regionen weltweit.
Weiterlesen


