
EUR/USD Price Forecast: Rises above 1.1650, moving averages amid bullish reversal
Von Akhtar Faruqui
Aktualisiert: 8 Apr 2026


BELIEBTE ARTIKEL

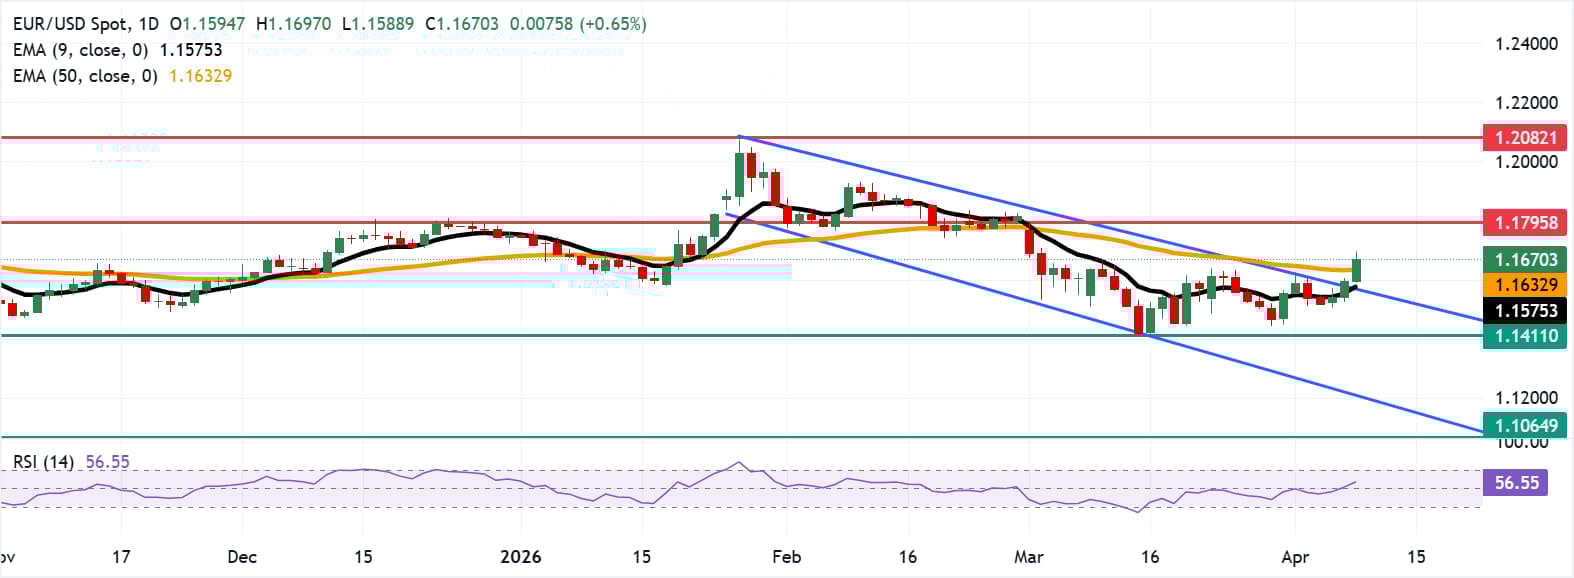
EUR/USD extends its winning streak for the third successive day, trading around 1.1670 during Asian hours on Wednesday. The daily chart technical analysis indicates a bullish reversal as the pair is rising above the descending channel pattern.
- EUR/USD may rise toward the six-week high of 1.1795.
- The 14-day Relative Strength Index at 56 indicates positive momentum above the midline.
- The immediate support lies at the 50-day EMA of 1.1632.
EUR/USD extends its winning streak for the third successive day, trading around 1.1670 during Asian hours on Wednesday. The daily chart technical analysis indicates a bullish reversal as the pair is rising above the descending channel pattern.
The EUR/USD pair has rebounded above the nine-day and 50-day Exponential Moving Averages (EMAs), framing a tentative bullish bias after an earlier downside phase.
The 14-day Relative Strength Index (RSI) momentum indicator at 56 shows positive momentum above the midline, backing the recovery and reducing immediate downside pressure. This configuration points to buyers regaining control as long as the EUR/USD pair holds above recent breakout levels, with scope for an extension higher if it can sustain above the shorter moving average cluster.
On the upside, the EUR/USD pair may target the six-week high of 1.1795, reached on March 2. Further advances would support the pair in exploring the region around 1.2082, the highest since June 2021, reached on January 27.
The EUR/USD pair may find the immediate support at the 50-day EMA of 1.1632, followed by the nine-day EMA of 1.1575. A return to the descending channel would put downward pressure on the pair to test the eight-month low of 1.1411, recorded on March 13. Further declines would put downward pressure on the pair to test the descending channel around 1.1220.
(The technical analysis of this story was written with the help of an AI tool.)
Euro Price Today
The table below shows the percentage change of Euro (EUR) against listed major currencies today. Euro was the strongest against the US Dollar.
| USD | EUR | GBP | JPY | CAD | AUD | NZD | CHF | |
|---|---|---|---|---|---|---|---|---|
| USD | -0.64% | -0.77% | -0.74% | -0.32% | -1.04% | -1.49% | -0.93% | |
| EUR | 0.64% | -0.14% | -0.13% | 0.32% | -0.40% | -0.89% | -0.30% | |
| GBP | 0.77% | 0.14% | 0.00% | 0.46% | -0.24% | -0.72% | -0.16% | |
| JPY | 0.74% | 0.13% | 0.00% | 0.44% | -0.26% | -0.74% | -0.17% | |
| CAD | 0.32% | -0.32% | -0.46% | -0.44% | -0.70% | -1.16% | -0.61% | |
| AUD | 1.04% | 0.40% | 0.24% | 0.26% | 0.70% | -0.48% | 0.08% | |
| NZD | 1.49% | 0.89% | 0.72% | 0.74% | 1.16% | 0.48% | 0.57% | |
| CHF | 0.93% | 0.30% | 0.16% | 0.17% | 0.61% | -0.08% | -0.57% |
The heat map shows percentage changes of major currencies against each other. The base currency is picked from the left column, while the quote currency is picked from the top row. For example, if you pick the Euro from the left column and move along the horizontal line to the US Dollar, the percentage change displayed in the box will represent EUR (base)/USD (quote).

Über eine Million Nutzer verlassen sich auf FXStreet für Echtzeit-Marktdaten, Charting-Tools, Experteneinblicke und Forex-News. Der umfassende Wirtschaftskalender und die Bildungs-Webinare helfen Tradern, informiert zu bleiben und fundierte Entscheidungen zu treffen. FXStreet wird von einem Team von rund 60 Fachleuten getragen, verteilt auf den Hauptsitz in Barcelona und verschiedene Regionen weltweit.
Weiterlesen


