
EUR/USD Price Forecast: Rises towards 1.1600 but RSI remains bearish
Von Christian Borjon Valencia
Aktualisiert: 11 Jun 2026


BELIEBTE ARTIKEL

The EUR/USD surges over 0.36% as the Greenback turns negative on the day, as US President Donald Trump cancelled strikes on Iran, saying that the US and Iran are ironing out the final points of a peace agreement. At the time of writing, the pair trades at 1.1579.
- EUR/USD consolidates below 1.1600 as RSI shows improving momentum.
- Break above 1.1600 exposes key SMA confluence resistance zone.
- Failure below 1.1600 risks retest of 1.1500 support.
The EUR/USD surges over 0.36% as the Greenback turns negative on the day, as US President Donald Trump cancelled strikes on Iran, saying that the US and Iran are ironing out the final points of a peace agreement. At the time of writing, the pair trades at 1.1579.
EUR/USD Price Forecast: Technical outlook
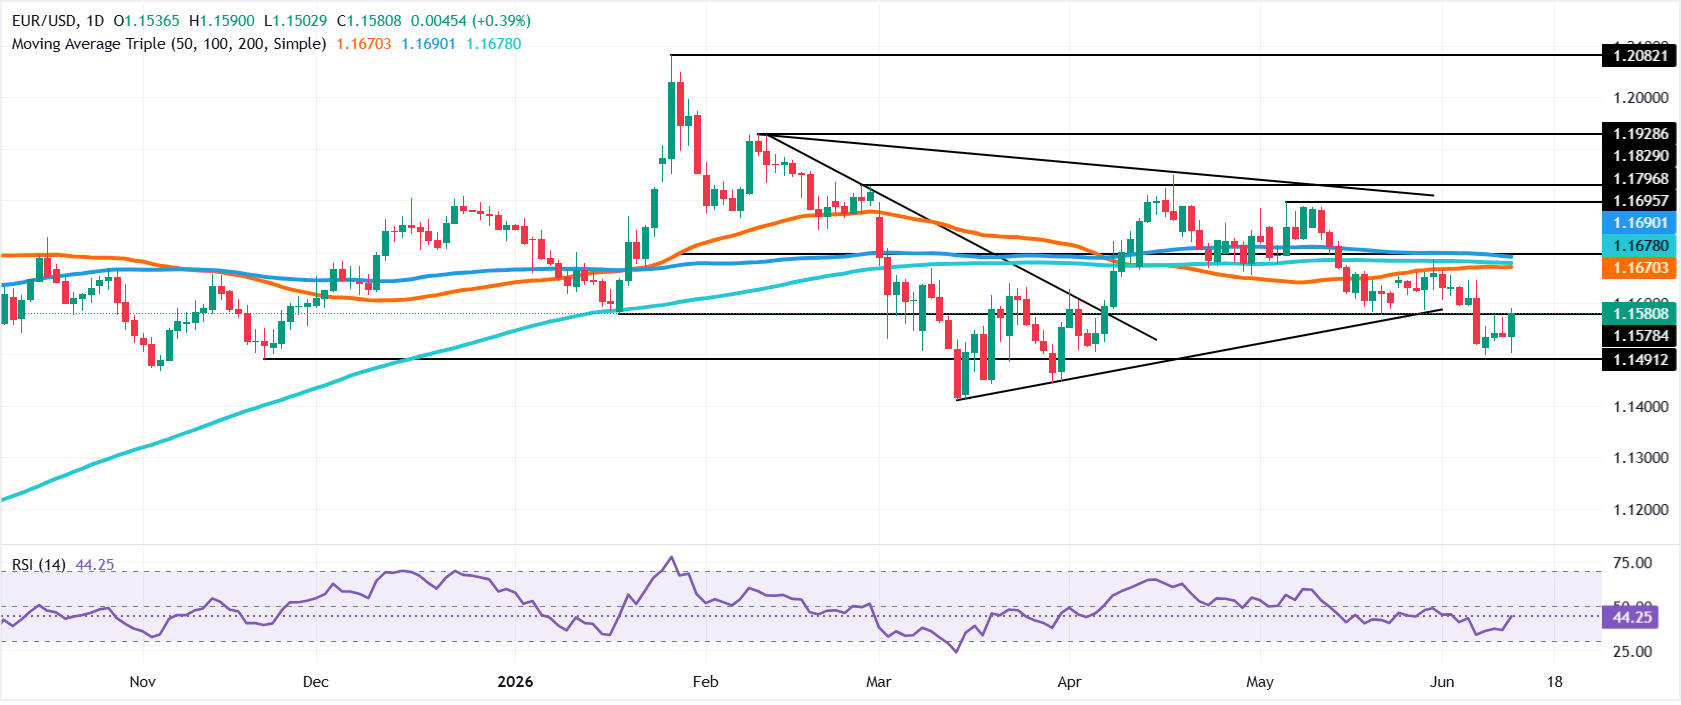
Even though the EUR/USD bounced off the lows of the week at around 1.1589, it seems to be consolidating below 1.1600.
Momentum, as measured by the Relative Strength Index (RSI), shows that buyers are gaining strength, though the index is below the 50-neutral level, suggesting caution is warranted.
For a bullish resumption, the EUR/USD must clear 1.1600. Once hurdled, the next resistance is the confluence of the 50- and 200-day SMAs at around the 1.1655-1.1676 area, followed by the 100-day SMA at 1.1689 ahead of 1.1700.
Conversely, if sellers keep EUR/USD below 1.1600, it opens the door to a retest of 1.1500. Below this level, the next stop would be the March 30 daily low of 1.1443. Below this level, the next area of interest would be 1.1400.
EUR/USD Price Chart – Daily
Euro Price Today
The table below shows the percentage change of Euro (EUR) against listed major currencies today. Euro was the strongest against the Canadian Dollar.
| USD | EUR | GBP | JPY | CAD | AUD | NZD | CHF | |
|---|---|---|---|---|---|---|---|---|
| USD | -0.40% | -0.39% | -0.46% | 0.11% | -0.67% | -0.80% | -0.69% | |
| EUR | 0.40% | 0.00% | -0.07% | 0.50% | -0.38% | -0.36% | -0.29% | |
| GBP | 0.39% | -0.01% | -0.09% | 0.50% | -0.37% | -0.37% | -0.30% | |
| JPY | 0.46% | 0.07% | 0.09% | 0.57% | -0.32% | -0.33% | -0.21% | |
| CAD | -0.11% | -0.50% | -0.50% | -0.57% | -0.87% | -0.87% | -0.79% | |
| AUD | 0.67% | 0.38% | 0.37% | 0.32% | 0.87% | -0.01% | 0.07% | |
| NZD | 0.80% | 0.36% | 0.37% | 0.33% | 0.87% | 0.01% | 0.10% | |
| CHF | 0.69% | 0.29% | 0.30% | 0.21% | 0.79% | -0.07% | -0.10% |
The heat map shows percentage changes of major currencies against each other. The base currency is picked from the left column, while the quote currency is picked from the top row. For example, if you pick the Euro from the left column and move along the horizontal line to the US Dollar, the percentage change displayed in the box will represent EUR (base)/USD (quote).

Über eine Million Nutzer verlassen sich auf FXStreet für Echtzeit-Marktdaten, Charting-Tools, Experteneinblicke und Forex-News. Der umfassende Wirtschaftskalender und die Bildungs-Webinare helfen Tradern, informiert zu bleiben und fundierte Entscheidungen zu treffen. FXStreet wird von einem Team von rund 60 Fachleuten getragen, verteilt auf den Hauptsitz in Barcelona und verschiedene Regionen weltweit.
Weiterlesen


