
GBP/JPY Price Forecast: Slumps as Yen gains on risk aversion
Von Christian Borjon Valencia
Veröffentlichungsdatum: 18 Mar 2026 | Änderungsdatum: 18 Mar 2026


BELIEBTE ARTIKEL

The GBP/JPY register losses of 0.20& on Wednesday as investors wait for the Bank of Japan monetary policy decision on Thursday.
- GBP/JPY dips 0.20% to 211.82 as traders await Bank of Japan decision.
- Bearish ‘dark-cloud cover’ signals downside risk below 211.63 support level.
- Break above 212.73 could reignite rally toward 213.00 and 215.00 highs.
The GBP/JPY register losses of 0.20& on Wednesday as investors wait for the Bank of Japan monetary policy decision on Thursday. Risk aversion due to an escalation of the Middle East conflict boosted the haven appeal of the Japanese Yen, trimming earlier losses that had driven the pair to a daily high of 212.73. At the time of writing, the cross-pair trades at 211.82.
GBP/JPY Price Forecast: Technical Outlook
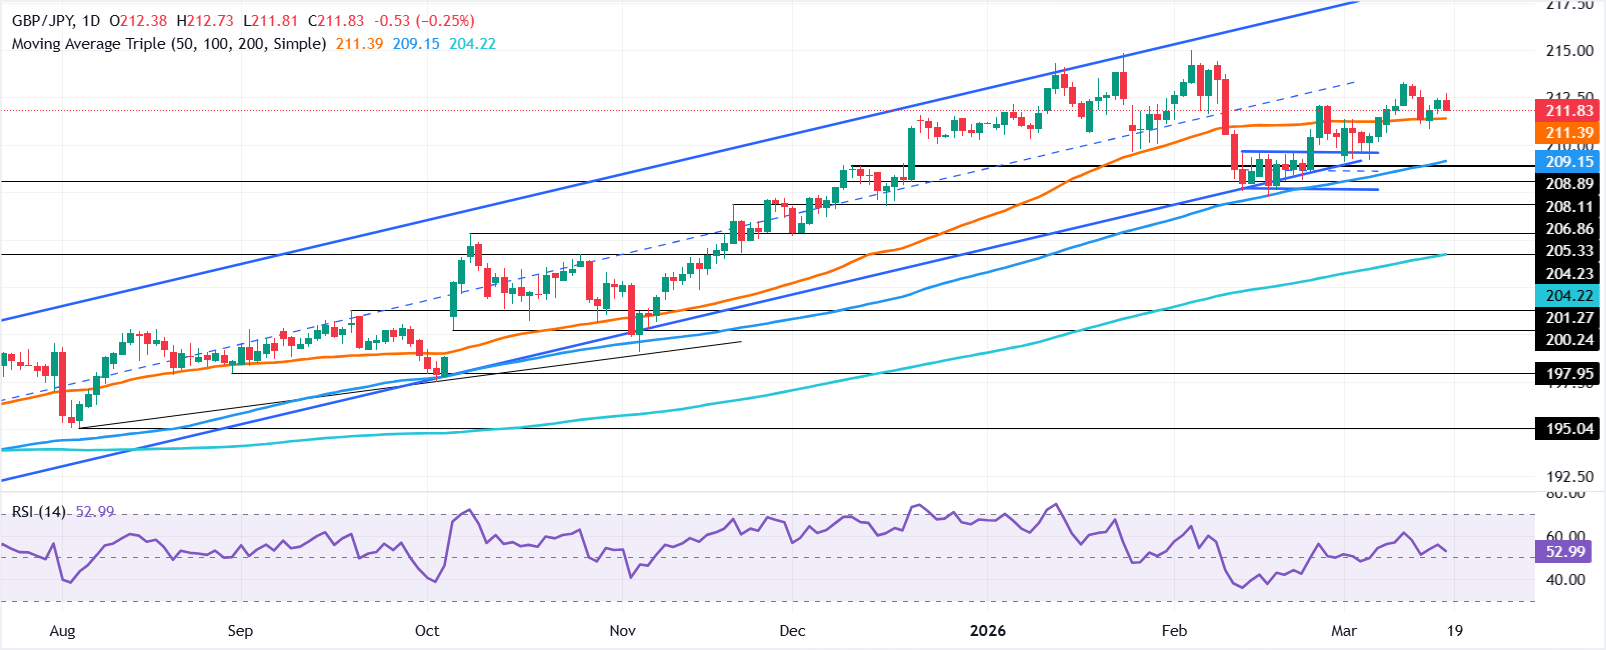
After testing yearly highs of 215.00, the GBP/JPY dipped to a yearly low near 207.00 before consolidating around the 210.00-214.00 area over the last four days. As of writing, the cross sits above the 50- and 20-day Simple Moving Averages (SMAs), indicating bullish momentum, as shown by the Relative Strength Index (RSI) standing above its 50-neutral level.
However, Wednesday’s price action left a ‘dark-cloud cover’ looming, which opens the door for some downward pressure, but sellers must decisively clear the March 17 daily low of 211.63 to aim lower. In that outcome, the next area of interest would be the 50-day SMA At 211.42, followed by the 20-day SMA at 211.19. Once surpassed, the next stop would be the March 16 daily low of 210.81.
On the other hand, if the GBP/JPY edges higher, breaching the day’s high of 212.73, the next resistance would be 213.00. Up next lies the year-to-date (YTD) high of 215.00.
GBP/JPY Price Chart – Daily
Pound Sterling Price This week
The table below shows the percentage change of British Pound (GBP) against listed major currencies this week. British Pound was the strongest against the Swiss Franc.
| USD | EUR | GBP | JPY | CAD | AUD | NZD | CHF | |
|---|---|---|---|---|---|---|---|---|
| USD | -0.26% | -0.08% | 0.18% | 0.08% | -0.41% | 0.10% | 0.37% | |
| EUR | 0.26% | 0.19% | 0.33% | 0.33% | -0.15% | 0.35% | 0.62% | |
| GBP | 0.08% | -0.19% | 0.30% | 0.14% | -0.33% | 0.15% | 0.49% | |
| JPY | -0.18% | -0.33% | -0.30% | -0.07% | -0.57% | -0.05% | 0.20% | |
| CAD | -0.08% | -0.33% | -0.14% | 0.07% | -0.53% | 0.03% | 0.30% | |
| AUD | 0.41% | 0.15% | 0.33% | 0.57% | 0.53% | 0.49% | 0.78% | |
| NZD | -0.10% | -0.35% | -0.15% | 0.05% | -0.03% | -0.49% | 0.24% | |
| CHF | -0.37% | -0.62% | -0.49% | -0.20% | -0.30% | -0.78% | -0.24% |
The heat map shows percentage changes of major currencies against each other. The base currency is picked from the left column, while the quote currency is picked from the top row. For example, if you pick the British Pound from the left column and move along the horizontal line to the US Dollar, the percentage change displayed in the box will represent GBP (base)/USD (quote).

Über eine Million Nutzer verlassen sich auf FXStreet für Echtzeit-Marktdaten, Charting-Tools, Experteneinblicke und Forex-News. Der umfassende Wirtschaftskalender und die Bildungs-Webinare helfen Tradern, informiert zu bleiben und fundierte Entscheidungen zu treffen. FXStreet wird von einem Team von rund 60 Fachleuten getragen, verteilt auf den Hauptsitz in Barcelona und verschiedene Regionen weltweit.
Weiterlesen


