
GBP/JPY Price Forecast: Stalls as bulls eye breakout above 212.73
Von Christian Borjon Valencia
Veröffentlichungsdatum: 19 Mar 2026 | Änderungsdatum: 19 Mar 2026


BELIEBTE ARTIKEL

GBP/JPY posted minimal gains of 0.02%, seesawing between gains and losses amid a trading session that saw monetary policy decisions from the Bank of Japan and the Bank of England, with both institutions holding rates unchanged. At the time of writing, the cross trades at 212.00, virtually unchanged.
- GBP/JPY flatlines as BoE and BoJ keep policy unchanged.
- Ascending channel and key SMAs support broader bullish bias.
- Break above 212.73 exposes 213.30 and 215.00 levels.
GBP/JPY posted minimal gains of 0.02%, seesawing between gains and losses amid a trading session that saw monetary policy decisions from the Bank of Japan and the Bank of England, with both institutions holding rates unchanged. At the time of writing, the cross trades at 212.00, virtually unchanged.
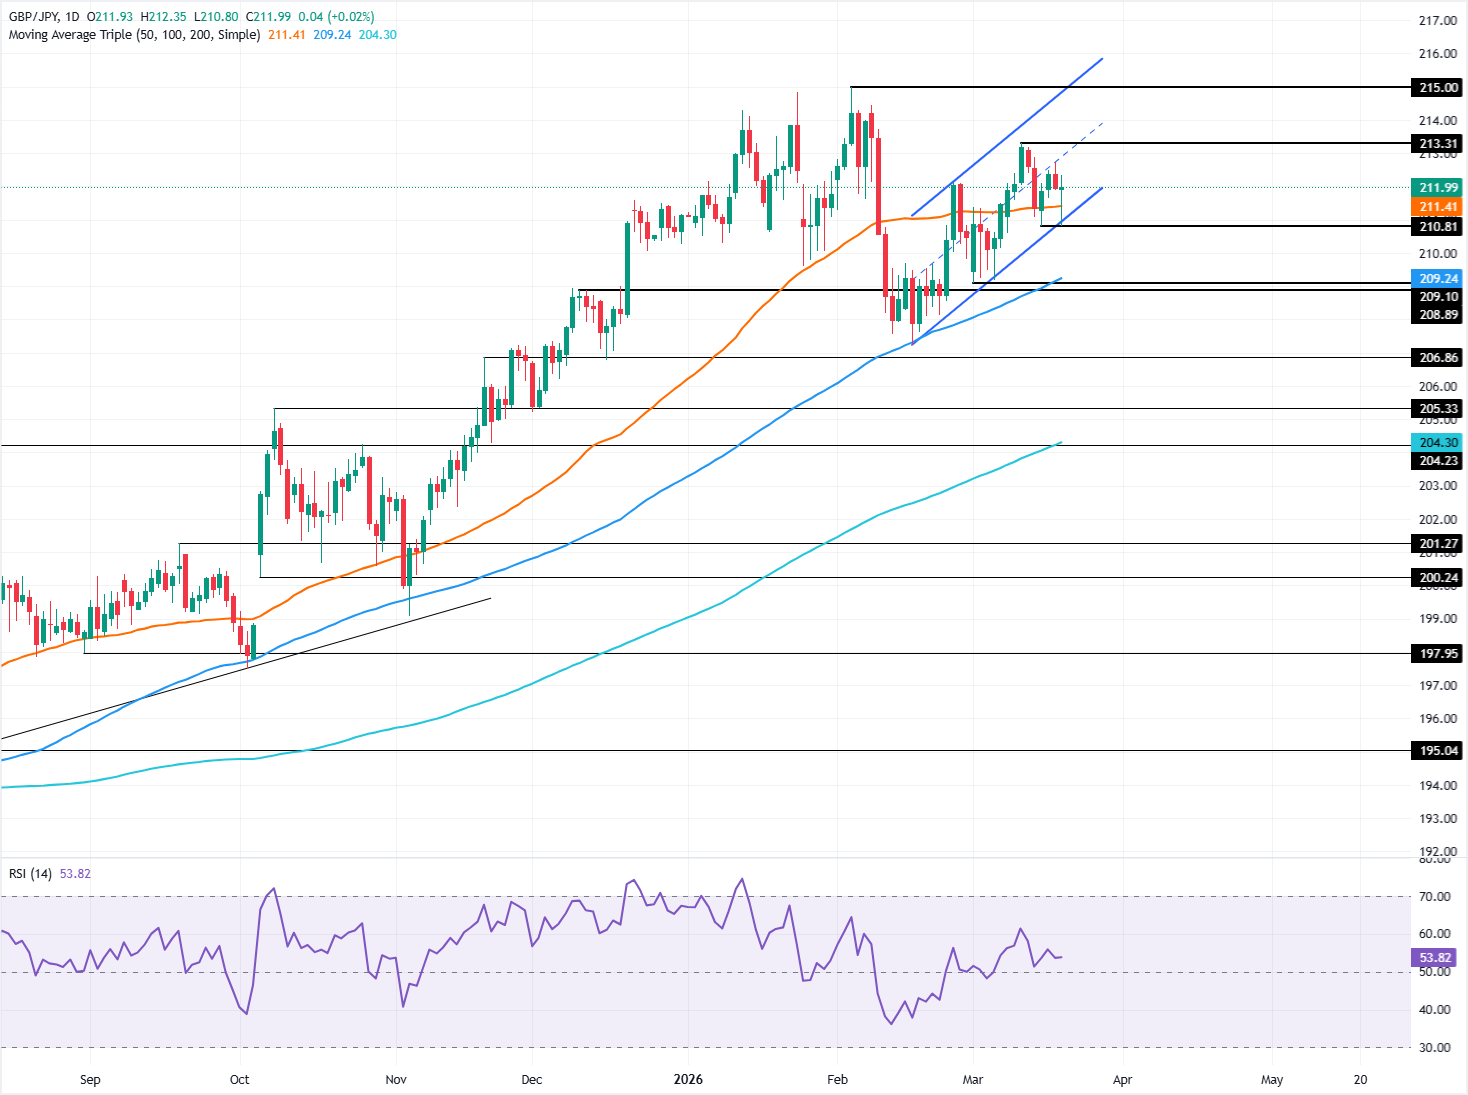
GBP/JPY Price Forecast: Technical Outlook
The GBP/JPY technical picture is bullish-biased, with price action trading within an ascending channel and the 20-, 50-, 100-, and 200-day Simple Moving Averages (SMAs) providing support.
Although momentum is bullish, as depicted by the Relative Strength Index (RSI), it remains close to the neutral level, an indication of choppy trading ahead.
For a bullish continuation, the cross-pair would need to clear the March 18 daily high at 212.73. Once breached, the next stop would be the March 11 high at 213.30, followed by the yearly peak at 215.00.
On the other hand, a break to the downside of the ascending channel, it would target 207.00 before testing the 200-day Simple Moving Average (SMA) at 204.24.
GBP/JPY Price Chart – Daily
Japanese Yen Price This week
The table below shows the percentage change of Japanese Yen (JPY) against listed major currencies this week. Japanese Yen was the strongest against the Canadian Dollar.
| USD | EUR | GBP | JPY | CAD | AUD | NZD | CHF | |
|---|---|---|---|---|---|---|---|---|
| USD | -1.35% | -1.38% | -1.06% | 0.08% | -1.29% | -1.33% | -0.19% | |
| EUR | 1.35% | -0.02% | 0.20% | 1.43% | 0.07% | 0.01% | 1.16% | |
| GBP | 1.38% | 0.02% | 0.36% | 1.45% | 0.10% | 0.04% | 1.25% | |
| JPY | 1.06% | -0.20% | -0.36% | 1.18% | -0.22% | -0.24% | 0.90% | |
| CAD | -0.08% | -1.43% | -1.45% | -1.18% | -1.40% | -1.39% | -0.26% | |
| AUD | 1.29% | -0.07% | -0.10% | 0.22% | 1.40% | -0.06% | 1.10% | |
| NZD | 1.33% | -0.01% | -0.04% | 0.24% | 1.39% | 0.06% | 1.12% | |
| CHF | 0.19% | -1.16% | -1.25% | -0.90% | 0.26% | -1.10% | -1.12% |
The heat map shows percentage changes of major currencies against each other. The base currency is picked from the left column, while the quote currency is picked from the top row. For example, if you pick the Japanese Yen from the left column and move along the horizontal line to the US Dollar, the percentage change displayed in the box will represent JPY (base)/USD (quote).

Über eine Million Nutzer verlassen sich auf FXStreet für Echtzeit-Marktdaten, Charting-Tools, Experteneinblicke und Forex-News. Der umfassende Wirtschaftskalender und die Bildungs-Webinare helfen Tradern, informiert zu bleiben und fundierte Entscheidungen zu treffen. FXStreet wird von einem Team von rund 60 Fachleuten getragen, verteilt auf den Hauptsitz in Barcelona und verschiedene Regionen weltweit.
Weiterlesen


