
GBP/USD Price Forecast: Bullish-engulfing pattern looms, traders eye 1.36
Von Christian Borjon Valencia
Aktualisiert: 30 Apr 2026


BELIEBTE ARTIKEL

The GBP/USD advanced by some 0.78% on Thursday as market participants continued to price in further tightening by the Bank of England, even though it kept rates steady earlier. At the time of writing, trades at 1.3581, as a technical ‘bullish engulfing’ chart pattern, looms.
- GBP/USD clears trendline resistance, shifting bias toward bullish continuation.
- RSI above 60 confirms strong upside momentum and buyer control.
- Break above 1.3600 exposes 1.3711 and 1.3800 resistance levels.
The GBP/USD advanced by some 0.78% on Thursday as market participants continued to price in further tightening by the Bank of England, even though it kept rates steady earlier. At the time of writing, trades at 1.3581, as a technical ‘bullish engulfing’ chart pattern, looms.
GBP/USD Price Forecast: Technical outlook
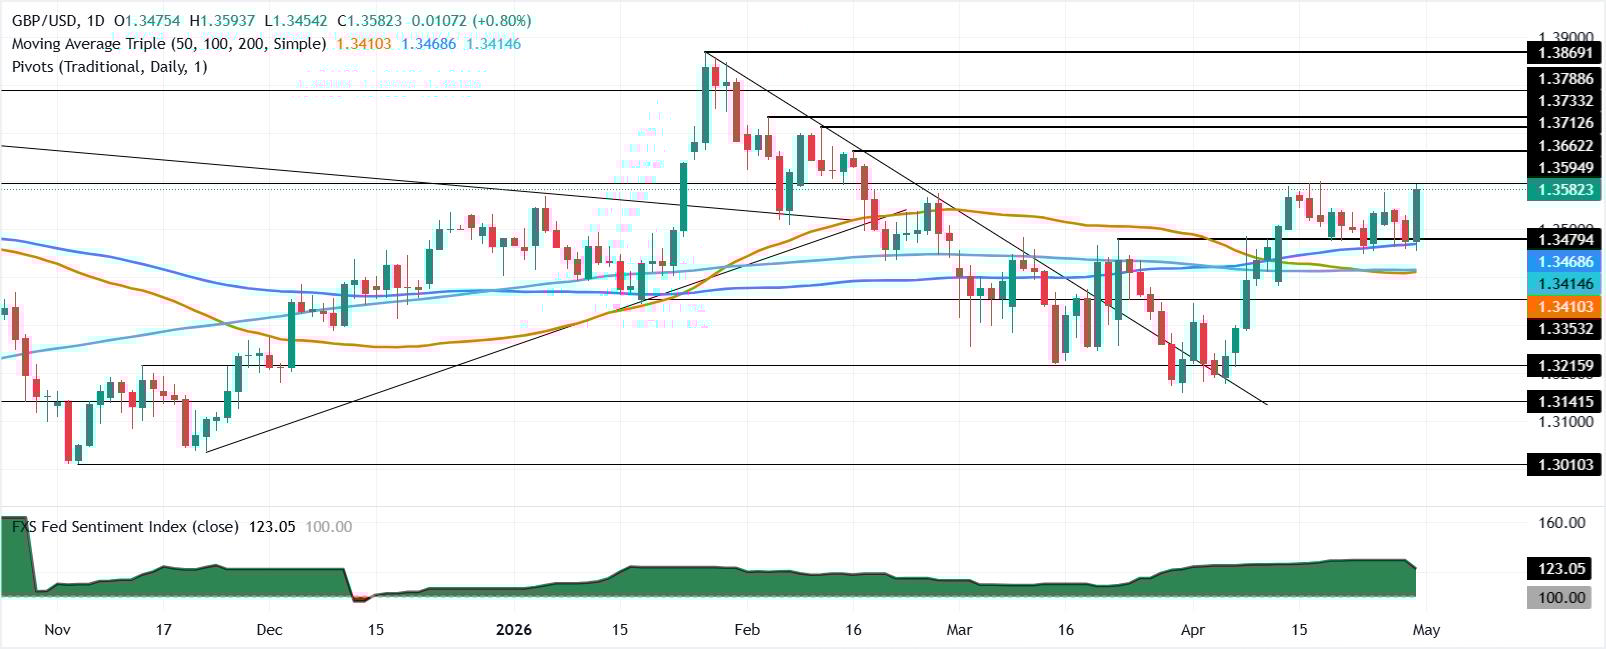
From a technical perspective, the GBP/USD is neutral but tilted to the upside as the pair clears a key resistance trendline around 1.3560/65, clearing the way towards 1.3600. Momentum, as depicted by the Relative Strength Index (RSI), jumped sharply past the 60 reading, an indication that bulls are in charge.
If GBP/USD clears the 1.36 handle and confirms a ‘bullish engulfing’ chart pattern, it opens the door for challenging the February 11 daily high at 1.3711. Once breached, the next area of interest would be the psychological 1.3800 figure.
Conversely, a sudden reversal near the April 29 daily high of 1.3528 opens the door for a drop to 1.3500. A decisive break will expose the confluence of the 100- and 20-day SMAs at 1.3468/67, followed by the April 23 low of 1.3448.
GBP/USD Price Chart – Daily
Pound Sterling Price This week
The table below shows the percentage change of British Pound (GBP) against listed major currencies this week. British Pound was the strongest against the US Dollar.
| USD | EUR | GBP | JPY | CAD | AUD | NZD | CHF | |
|---|---|---|---|---|---|---|---|---|
| USD | -0.26% | -0.54% | -1.91% | -0.53% | -0.74% | -0.45% | -0.60% | |
| EUR | 0.26% | -0.25% | -1.74% | -0.24% | -0.45% | -0.16% | -0.32% | |
| GBP | 0.54% | 0.25% | -1.44% | 0.01% | -0.21% | 0.09% | -0.07% | |
| JPY | 1.91% | 1.74% | 1.44% | 1.47% | 1.24% | 1.62% | 1.44% | |
| CAD | 0.53% | 0.24% | -0.01% | -1.47% | -0.17% | 0.15% | -0.08% | |
| AUD | 0.74% | 0.45% | 0.21% | -1.24% | 0.17% | 0.30% | 0.14% | |
| NZD | 0.45% | 0.16% | -0.09% | -1.62% | -0.15% | -0.30% | -0.16% | |
| CHF | 0.60% | 0.32% | 0.07% | -1.44% | 0.08% | -0.14% | 0.16% |
The heat map shows percentage changes of major currencies against each other. The base currency is picked from the left column, while the quote currency is picked from the top row. For example, if you pick the British Pound from the left column and move along the horizontal line to the US Dollar, the percentage change displayed in the box will represent GBP (base)/USD (quote).

Über eine Million Nutzer verlassen sich auf FXStreet für Echtzeit-Marktdaten, Charting-Tools, Experteneinblicke und Forex-News. Der umfassende Wirtschaftskalender und die Bildungs-Webinare helfen Tradern, informiert zu bleiben und fundierte Entscheidungen zu treffen. FXStreet wird von einem Team von rund 60 Fachleuten getragen, verteilt auf den Hauptsitz in Barcelona und verschiedene Regionen weltweit.
Weiterlesen


