
GBP/USD Price Forecast: Extends decline below 20-day EMA
Von Sagar Dua
Aktualisiert: 13 May 2026


BELIEBTE ARTIKEL

The GBP/USD pair is down 0.25% to near 1.3500 during the European trading session on Wednesday. The Cable faces selling pressure as the US Dollar (USD) trades firmly due to growing expectations that the Federal Reserve (Fed) will deliver at least one interest rate hike this year.
- GBP/USD slides to near 1.3500 amid strength in the US Dollar.
- The odds of the Fed delivering at least one interest rate hike this year have increased.
- Investors await the UK Q1 GDP data, which will be released on Thursday.
The GBP/USD pair is down 0.25% to near 1.3500 during the European trading session on Wednesday. The Cable faces selling pressure as the US Dollar (USD) trades firmly due to growing expectations that the Federal Reserve (Fed) will deliver at least one interest rate hike this year.
US Dollar Price Today
The table below shows the percentage change of US Dollar (USD) against listed major currencies today. US Dollar was the strongest against the New Zealand Dollar.
| USD | EUR | GBP | JPY | CAD | AUD | NZD | CHF | |
|---|---|---|---|---|---|---|---|---|
| USD | 0.19% | 0.25% | 0.11% | -0.02% | -0.16% | 0.37% | 0.12% | |
| EUR | -0.19% | 0.04% | -0.09% | -0.24% | -0.37% | 0.16% | -0.10% | |
| GBP | -0.25% | -0.04% | -0.15% | -0.27% | -0.39% | 0.14% | -0.15% | |
| JPY | -0.11% | 0.09% | 0.15% | -0.12% | -0.26% | 0.24% | 0.01% | |
| CAD | 0.02% | 0.24% | 0.27% | 0.12% | -0.14% | 0.39% | 0.14% | |
| AUD | 0.16% | 0.37% | 0.39% | 0.26% | 0.14% | 0.53% | 0.26% | |
| NZD | -0.37% | -0.16% | -0.14% | -0.24% | -0.39% | -0.53% | -0.27% | |
| CHF | -0.12% | 0.10% | 0.15% | -0.01% | -0.14% | -0.26% | 0.27% |
The heat map shows percentage changes of major currencies against each other. The base currency is picked from the left column, while the quote currency is picked from the top row. For example, if you pick the US Dollar from the left column and move along the horizontal line to the Japanese Yen, the percentage change displayed in the box will represent USD (base)/JPY (quote).
As of writing, the US Dollar Index (DXY), which tracks the Greenback’s value against six major currencies, trades 0.2% higher to near 98.50.
According to the CME FedWatch tool, the odds of the Fed delivering at least one interest rate hike this year have increased to 35.6% from 23.5% seen before the United States (US) Consumer Price Index (CPI) data release.
The data showed on Tuesday that the US headline CPI grew at a stronger pace of 3.8% Year-on-Year (YoY) compared to 3.7% estimates and the previous reading of 3.3%.
In the United Kingdom (UK), investors await the Q1 Gross Domestic Product (GDP) data, which will be released on Thursday. According to estimates, the UK economy expanded strongly by 0.6% against a 0.1% growth seen in the last quarter of 2025.
GBP/USD technical analysis
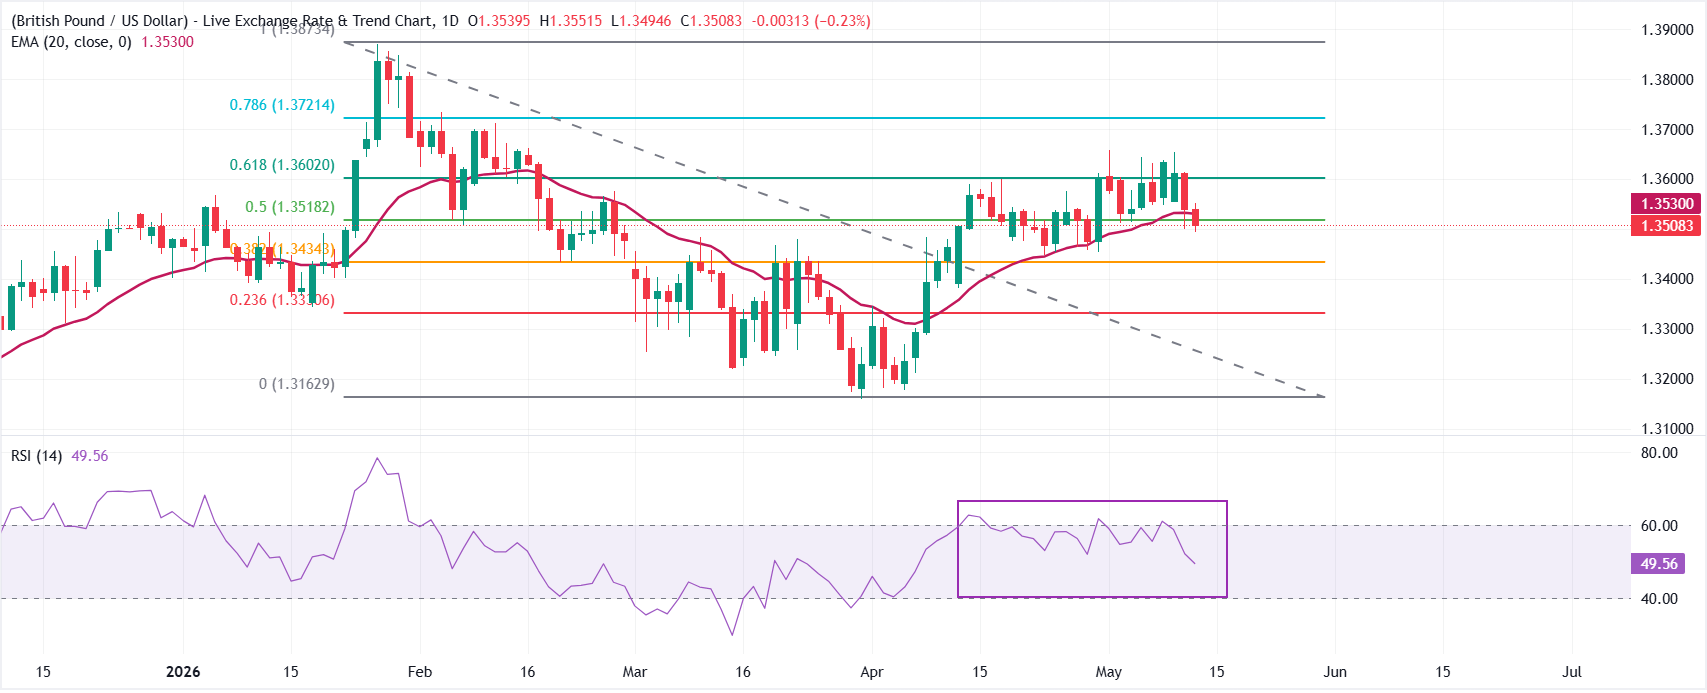
GBP/USD trades lower at around 1.3500, keeping a mildly bearish near-term bias as it holds below the 20-day Exponential Moving Average (EMA) at 1.3530 after failing to break above the 61.8% Fibonacci retracement of the latest swing at 1.3602.
The Relative Strength Index (RSI) at 49.6 hovers around the neutral line, hinting at waning upside momentum and suggesting rallies could remain capped while price stays under this immediate confluence of dynamic and Fibonacci resistance.
On the topside, initial resistance emerges at the 50.0% retracement level around 1.3518, closely followed by the 20-day EMA at 1.3530, with further hurdles at the 61.8% retracement near 1.3602 and then 1.3721 and 1.3873, corresponding to the 78.6% and 100% retracement levels. On the downside, first support is seen at the 38.2% Fibonacci retracement around 1.3434, ahead of a deeper floor at the 23.6% level near 1.3331, while a break below there would expose the structural anchor around 1.3163.
(The technical analysis of this story was written with the help of an AI tool.)
Economic Indicator
Gross Domestic Product (QoQ)
The Gross Domestic Product (GDP), released by the Office for National Statistics on a monthly and quarterly basis, is a measure of the total value of all goods and services produced in the UK during a given period. The GDP is considered as the main measure of UK economic activity. The QoQ reading compares economic activity in the reference quarter to the previous quarter. Generally, a rise in this indicator is bullish for the Pound Sterling (GBP), while a low reading is seen as bearish.
Read more.Next release: Thu May 14, 2026 06:00 (Prel)
Frequency: Quarterly
Consensus: 0.6%
Previous: 0.1%
Source: Office for National Statistics

Über eine Million Nutzer verlassen sich auf FXStreet für Echtzeit-Marktdaten, Charting-Tools, Experteneinblicke und Forex-News. Der umfassende Wirtschaftskalender und die Bildungs-Webinare helfen Tradern, informiert zu bleiben und fundierte Entscheidungen zu treffen. FXStreet wird von einem Team von rund 60 Fachleuten getragen, verteilt auf den Hauptsitz in Barcelona und verschiedene Regionen weltweit.
Weiterlesen


