
GBP/USD Price Forecast: Holds gains near 1.3600 as bullish bias prevails
Von Akhtar Faruqui
Aktualisiert: 7 May 2026


BELIEBTE ARTIKEL

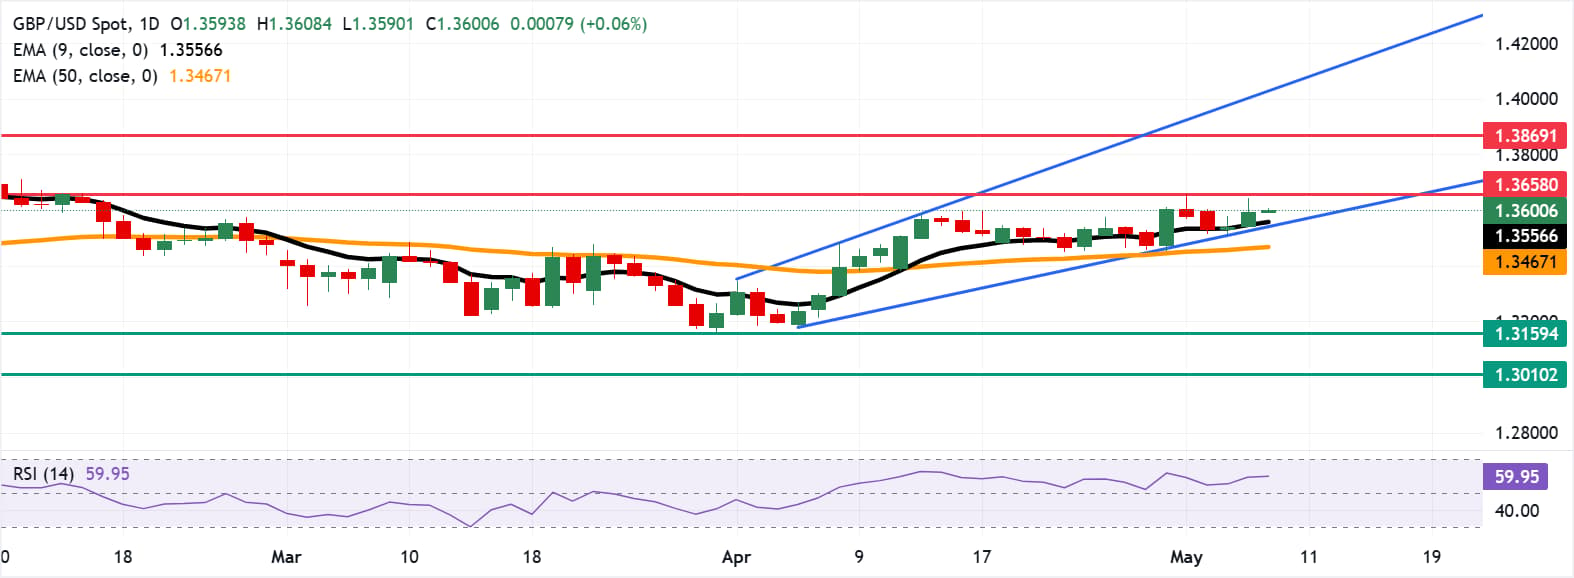
GBP/USD remains stronger for the third consecutive day, trading around 1.3600 during the Asian hours on Thursday. The technical analysis of the daily chart indicates an improving bullish trend as the pair rebounds from the lower boundary of the ascending channel.
- GBP/USD may face initial resistance at the 11-week high of 1.3758.
- The 14-day Relative Strength Index near 60 suggests solid bullish momentum.
- The immediate support lies at the nine-day EMA of 1.3556.
GBP/USD remains stronger for the third consecutive day, trading around 1.3600 during the Asian hours on Thursday. The technical analysis of the daily chart indicates an improving bullish trend as the pair rebounds from the lower boundary of the ascending channel.
GBP/USD keeps a constructive bullish bias as it holds just above the 1.3600 horizontal pivot. The pair also trades over the nine-period Exponential Moving Average (EMA) and the 50-period EMA, suggesting the broader uptrend remains supported.
The 14-day Relative Strength Index (RSI) is near 60 points to firm but not overextended bullish momentum.
The GBP/USD pair may find the primary barrier at the 11-week high of 1.3758, reached on May 1. Further advances would support the pair to explore the region around 1.3869, the highest level since September 2021, reached on January 27, followed by the upper boundary of 1.4040.
On the downside, the GBP/USD pair may find its immediate support at the nine-day EMA of 1.3556, followed by the lower boundary of the lower boundary of the ascending channel around 1.3540. Further support lies at the 50-day EMA at 1.3467.
A successful break below the medium-term average would expose the five-month low of 1.3159, recorded on March 31, followed by the 1.3010, the lowest since April 2025, which was recorded in November 2025.
(The technical analysis of this story was written with the help of an AI tool.)
Pound Sterling Price Today
The table below shows the percentage change of British Pound (GBP) against listed major currencies today. British Pound was the strongest against the Swiss Franc.
| USD | EUR | GBP | JPY | CAD | AUD | NZD | CHF | |
|---|---|---|---|---|---|---|---|---|
| USD | -0.02% | -0.02% | 0.00% | 0.02% | -0.08% | -0.07% | 0.04% | |
| EUR | 0.02% | -0.00% | 0.02% | 0.05% | -0.06% | -0.06% | 0.06% | |
| GBP | 0.02% | 0.00% | 0.00% | 0.03% | -0.06% | -0.05% | 0.06% | |
| JPY | 0.00% | -0.02% | 0.00% | 0.01% | -0.08% | -0.12% | 0.06% | |
| CAD | -0.02% | -0.05% | -0.03% | -0.01% | -0.10% | -0.09% | 0.02% | |
| AUD | 0.08% | 0.06% | 0.06% | 0.08% | 0.10% | 0.00% | 0.12% | |
| NZD | 0.07% | 0.06% | 0.05% | 0.12% | 0.09% | -0.01% | 0.12% | |
| CHF | -0.04% | -0.06% | -0.06% | -0.06% | -0.02% | -0.12% | -0.12% |
The heat map shows percentage changes of major currencies against each other. The base currency is picked from the left column, while the quote currency is picked from the top row. For example, if you pick the British Pound from the left column and move along the horizontal line to the US Dollar, the percentage change displayed in the box will represent GBP (base)/USD (quote).

Über eine Million Nutzer verlassen sich auf FXStreet für Echtzeit-Marktdaten, Charting-Tools, Experteneinblicke und Forex-News. Der umfassende Wirtschaftskalender und die Bildungs-Webinare helfen Tradern, informiert zu bleiben und fundierte Entscheidungen zu treffen. FXStreet wird von einem Team von rund 60 Fachleuten getragen, verteilt auf den Hauptsitz in Barcelona und verschiedene Regionen weltweit.
Weiterlesen


