
GBP/USD steadies as Iran deadlock keeps Dollar bid in check
Von Christian Borjon Valencia
Aktualisiert: 22 Apr 2026


BELIEBTE ARTIKEL

GBP/USD holds steady on Wednesday as geopolitical tensions remain high amid the lack of progress toward resuming negotiations between the US and Iran. An absent economic schedule in the US, keeps traders leaning on the latest UK inflation figures, which showed the effects of the energy shock.
- GBP/USD traded flat as traders balanced geopolitics against UK inflation data.
- UK CPI stayed elevated, keeping Bank of England hike bets alive.
- Markets now await Flash PMIs and jobless claims for fresh direction.
GBP/USD holds steady on Wednesday as geopolitical tensions remain high amid the lack of progress toward resuming negotiations between the US and Iran. An absent economic schedule in the US, keeps traders leaning on the latest UK inflation figures, which showed the effects of the energy shock. The pair trades at 1.3514, mostly unchanged.
Sterling holds firm as UK inflation offsets broader war concerns
US equities are trading in the green, yet an escalation of the conflict could weigh on stocks, prompting a flow towards safe-haven assets such as the US Dollar. The Greenback so far trimmed some of its earlier losses, according to the US Dollar Index (DXY).
The DXY, which measures the buck’s performance versus six currencies, is at 98.44, up 0.03%.
Reports revealed that Iran has no plans to negotiate with the US on Friday, Tasnim reported. Reuters, citing sources, said Trump is reportedly willing to give Iran 3 to 5 days, though it later corrected its headline to say there’s no timeline, and Trump revealed he will wait for Iran’s proposal.
Data in the UK revealed that the Consumer Price Index (CPI) in March rose by 3.3% YoY as expected, while excluding volatile items, the so-called Core CPI dipped from 3.2% to 3.1% YoY for the same period. Digging into the data, the Office for National Statistics (ONS) found that prices paid by factories exceeded estimates.
The Bank of England (BoE) projected that inflation would get closer to its 2% goal in April, before the Iran war. Since then, the BoE revised up its projection to 3.5%, while the IMF expected inflation to rise by 4%.
Even though the data suggests the BoE might need to raise rates, fears that the economy might slow sharply loom, with some analysts speculating on a stagflation scenario.
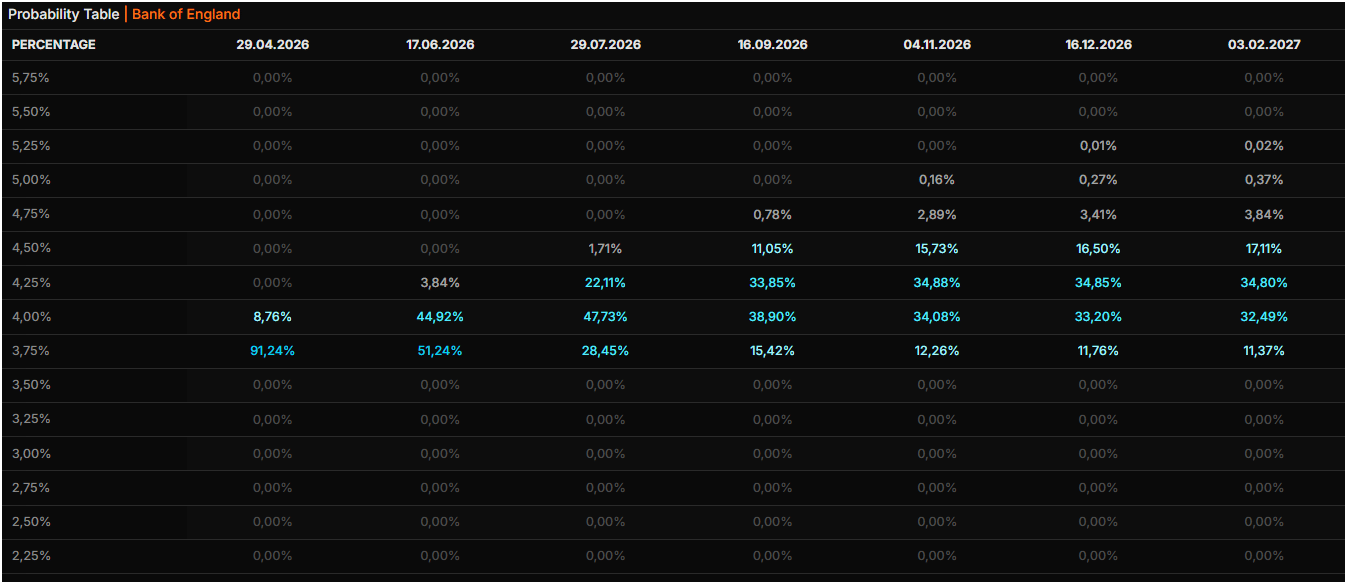
Money markets expect the BoE to hold rates unchanged for two meetings. However, for the July 29 meeting, odds for a 25 bps rate hike are near 48%, according to Prime Terminal data.
BoE Interest rates table
Ahead, the UK economic schedule will be light with the release of S&P Global Flash PMIs. Across the Atlantic, the US docket will also feature Flash PMIs and jobless claims data.
GBP/USD Price Forecast: Technical outlook
In the daily chart, GBP/USD trades at 1.3495, holding a bullish near-term bias as it remains above the clustered 50-, 100- and 200-day simple moving averages (SMAs) around 1.3417. The pair is still trading below the former uptrend’s break level at 1.3855 and the origin of the prevailing descending resistance line near 1.3869, suggesting that while the broader structure remains capped, the underlying trend tone stays constructive while price holds over the multi-day SMA floor.
On the topside, initial resistance appears at the broken uptrend reference around 1.3855, followed closely by the descending resistance line projected from 1.3869, where a sustained break would be needed to re-open a more aggressive bullish phase. On the downside, the first notable support is provided by the dense 50/100/200-day SMA cluster near 1.3417, with a daily close below that zone likely to weaken the current positive bias and expose deeper corrective pressure.
(The technical analysis of this story was written with the help of an AI tool.)
Pound Sterling Price This week
The table below shows the percentage change of British Pound (GBP) against listed major currencies this week. British Pound was the strongest against the Japanese Yen.
| USD | EUR | GBP | JPY | CAD | AUD | NZD | CHF | |
|---|---|---|---|---|---|---|---|---|
| USD | 0.20% | -0.08% | 0.38% | -0.15% | -0.48% | -0.80% | 0.24% | |
| EUR | -0.20% | -0.27% | 0.17% | -0.32% | -0.64% | -1.03% | 0.05% | |
| GBP | 0.08% | 0.27% | 0.45% | -0.04% | -0.37% | -0.76% | 0.32% | |
| JPY | -0.38% | -0.17% | -0.45% | -0.53% | -0.80% | -1.20% | -0.12% | |
| CAD | 0.15% | 0.32% | 0.04% | 0.53% | -0.23% | -0.68% | 0.37% | |
| AUD | 0.48% | 0.64% | 0.37% | 0.80% | 0.23% | -0.32% | 0.71% | |
| NZD | 0.80% | 1.03% | 0.76% | 1.20% | 0.68% | 0.32% | 1.04% | |
| CHF | -0.24% | -0.05% | -0.32% | 0.12% | -0.37% | -0.71% | -1.04% |
The heat map shows percentage changes of major currencies against each other. The base currency is picked from the left column, while the quote currency is picked from the top row. For example, if you pick the British Pound from the left column and move along the horizontal line to the US Dollar, the percentage change displayed in the box will represent GBP (base)/USD (quote).

Über eine Million Nutzer verlassen sich auf FXStreet für Echtzeit-Marktdaten, Charting-Tools, Experteneinblicke und Forex-News. Der umfassende Wirtschaftskalender und die Bildungs-Webinare helfen Tradern, informiert zu bleiben und fundierte Entscheidungen zu treffen. FXStreet wird von einem Team von rund 60 Fachleuten getragen, verteilt auf den Hauptsitz in Barcelona und verschiedene Regionen weltweit.
Weiterlesen


