
GBP/USD surges as Iran truce dents US Dollar broadly
Von Christian Borjon Valencia
Aktualisiert: 8 Apr 2026


BELIEBTE ARTIKEL

The Pound Sterling rallies on Wednesday, advancing for the third straight day this week, up more than 1.10% due to broad US Dollar weakness, sparked by an improvement in risk appetite following a two-week ceasefire between the US and Iran.
- Sterling extends gains as truce hopes spark broad-based US Dollar selling.
- Falling oil prices and improving sentiment supported the Pound’s rally.
- Fragile ceasefire risks and regional attacks could still cap upside.
The Pound Sterling rallies on Wednesday, advancing for the third straight day this week, up more than 1.10% due to broad US Dollar weakness, sparked by an improvement in risk appetite following a two-week ceasefire between the US and Iran. At the time of writing, the GBP/USD trades at 1.3431, after bouncing off daily lows of 1.3280.
Sterling jumps as ceasefire hopes lift risk and crush haven bids
On Wednesday, US President Donald Trump agreed to a two-week truce, subject to Iran reopening the Strait of Hormuz, adding that the US had achieved its military objectives. Trump wrote that he received a 10-point proposal from Iran and believes “it is a workable basis on which to negotiate.”
A Senior Iranian official said that the Strait of Hormuz could reopen on Thursday or Friday ahead of the meeting in Pakistan, if a ceasefire framework is reached. Meanwhile, US President Trump warned to impose 50% tariffs effective IMMEDIATELY on countries supplying military weapons to Iran with no exception.
Nevertheless, the truce seems fragile, as Saudi Arabia’s east-west oil pipeline was hit by a drone attack. Kuwait reported that fires broke out at several energy sites following attacks, including power stations, resulting in "severe material damage to infrastructure facilities, generation units and fuel tanks."
Market participants cheered Trump’s decision as global equities recovered, Gold reached a daily high past $4,800, the Greenback retreated, and Oil prices sank. The US Dollar Index (DXY), which tracks the buck’s value against six currencies, plunges 0.70% down to 98.79.
Major central banks were relieved of the risk of a second round of inflation sparked by the ongoing energy shock blamed on the conflict. Traders expected the US Federal Reserve to hold rates unchanged throughout the year, but as of writing, have priced in nearly 10 basis points of easing toward year-end, according to Prime Market Terminal.
Fed interest rate probabilities
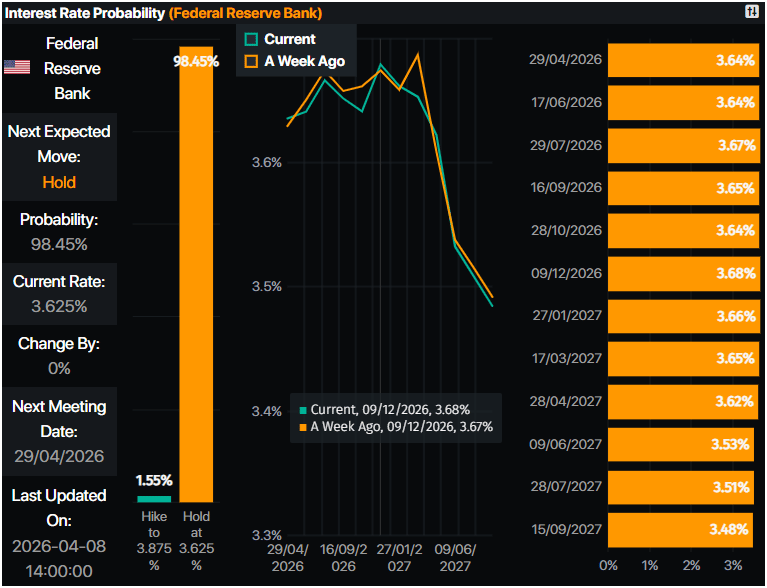
Later, the Fed will release its last meeting minutes, in which the central bank decided to hold rates unchanged, amid speculation that Iran’s war could push prices higher, potentially spreading to core goods and services.
In the UK, the swaps market trimmed hawkish bets on the Bank of England. Prior to Trump’s post, markets had priced in at least 2 BoE rate hikes. That changed since the headline, with traders expecting just one rate increase towards the end of the year.
GBP/USD Price Forecast: Technical Outlook
In the daily chart, GBP/USD trades at 1.3440, holding just underneath a dense cluster of the 50-day, 100-day and 200-day simple moving averages (SMAs) near 1.3448, which collectively cap the topside and keep the near-term bias bearish. The pair is trading above the downwards resistance trend line’s break area around 1.3147, suggesting that while broader downside pressure persists, the recent move is more of a consolidation below key moving-average resistance, with the elevated FXS Fed Sentiment Index hinting at lingering sensitivity to US policy expectations.
On the topside, immediate resistance is located at the confluent 50-day, 100-day and 200-day SMAs clustered around 1.3448; a daily close above this band would be needed to ease the current bearish tone and open the way toward the former uptrend-line break region near 1.3780. On the downside, the main structural support emerges at the prior downtrend-line break zone around 1.3147, and a drop back toward that area would reinforce the view that the pair has failed to clear its moving-average ceiling.
(The technical analysis of this story was written with the help of an AI tool.)
Pound Sterling Price Today
The table below shows the percentage change of British Pound (GBP) against listed major currencies today. British Pound was the strongest against the US Dollar.
| USD | EUR | GBP | JPY | CAD | AUD | NZD | CHF | |
|---|---|---|---|---|---|---|---|---|
| USD | -0.84% | -1.10% | -0.78% | -0.26% | -1.18% | -1.79% | -1.06% | |
| EUR | 0.84% | -0.29% | 0.06% | 0.57% | -0.34% | -1.00% | -0.25% | |
| GBP | 1.10% | 0.29% | 0.32% | 0.86% | -0.04% | -0.69% | 0.04% | |
| JPY | 0.78% | -0.06% | -0.32% | 0.51% | -0.38% | -1.01% | -0.29% | |
| CAD | 0.26% | -0.57% | -0.86% | -0.51% | -0.89% | -1.51% | -0.81% | |
| AUD | 1.18% | 0.34% | 0.04% | 0.38% | 0.89% | -0.65% | 0.10% | |
| NZD | 1.79% | 1.00% | 0.69% | 1.01% | 1.51% | 0.65% | 0.73% | |
| CHF | 1.06% | 0.25% | -0.04% | 0.29% | 0.81% | -0.10% | -0.73% |
The heat map shows percentage changes of major currencies against each other. The base currency is picked from the left column, while the quote currency is picked from the top row. For example, if you pick the British Pound from the left column and move along the horizontal line to the US Dollar, the percentage change displayed in the box will represent GBP (base)/USD (quote).

Über eine Million Nutzer verlassen sich auf FXStreet für Echtzeit-Marktdaten, Charting-Tools, Experteneinblicke und Forex-News. Der umfassende Wirtschaftskalender und die Bildungs-Webinare helfen Tradern, informiert zu bleiben und fundierte Entscheidungen zu treffen. FXStreet wird von einem Team von rund 60 Fachleuten getragen, verteilt auf den Hauptsitz in Barcelona und verschiedene Regionen weltweit.
Weiterlesen


