
Gold Price Forecast: XAU/USD hovers above $4,100 amid growing bearish pressure
Von Guillermo Alcala
Aktualisiert: 23 Jun 2026


BELIEBTE ARTIKEL

Gold (XAU/USD) reversed Monday’s gains and resumed the broader bearish trend on Tuesday, testing support at the $4,100 level after failing to extend gains beyond $4,220 on Monday.
- XAU/USD retreated to $4,100 on Tuesday after rejection at the $4,220 area on Monday.
- Higher US Treasury yields and uncertainty about the US-Iran peace process are weighing on precious metals.
- Gold remains under pressure, with bears eyeing 2026 lows at the $4,025 area.
Gold (XAU/USD) reversed Monday’s gains and resumed the broader bearish trend on Tuesday, testing support at the $4,100 level after failing to extend gains beyond $4,220 on Monday. Higher US Treasury yields amid rising bets on Federal Reserve (Fed) rate hikes and uncertainty surrounding the US-Iran peace deal continue to weigh on the precious metal, which has depreciated by nearly $250 since the Iran conflict began.
The US Dollar (USD) is one of the stronger performers this week, buoyed by higher Treasury yields, as markets brace for Federal Reserve (Fed) rate hikes later in the year. The CME Group’s Fed Watch Tool shows a 70% chance of a hike in September, up from less than 30% a year ago, and is almost fully pricing at least a quarter-point hike before the end of the year.
Beyond that, investors remain wary of risk due to scepticism about progress in the US-Iran talks. Iranian negotiators said earlier on Tuesday that the technical talks have been completed, with no clear plan to reopen the key Strait of Hormuz and with the critical nuclear issue still in the air. A tense calm in Lebanon is keeping hopes alive, but the risk of derailment is still on the cards.
Technical Analysis: Bears focus on the 2026 low, at $4,023
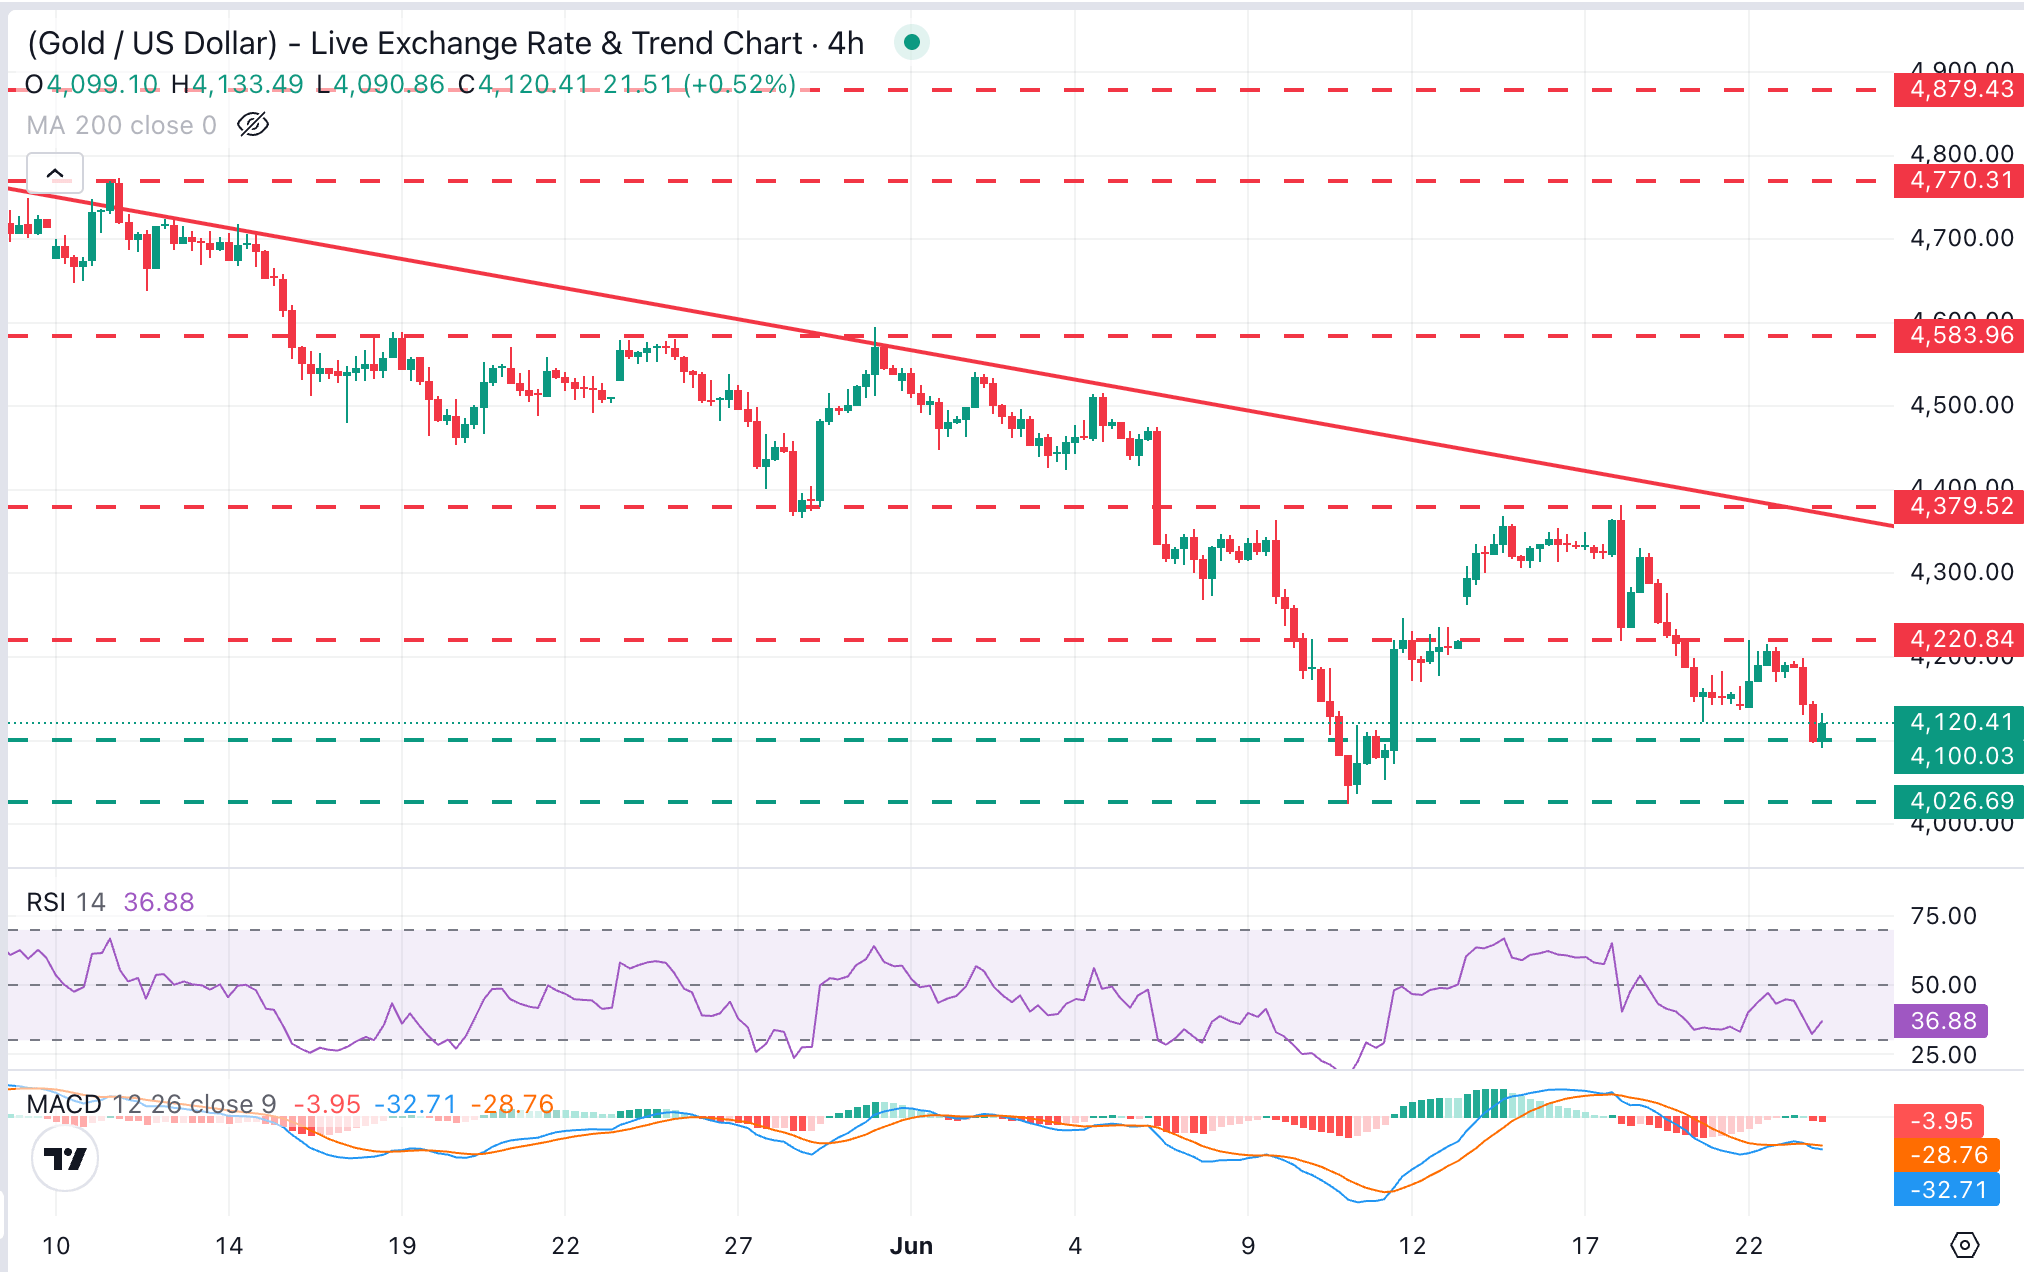
XAU/USD trades at $4,120, holding a bearish near-term bias, with downside attempts contained above $4,100 so far. Momentum studies in the four-hour chart align with this softer tone, as the Relative Strength Index (14) retreats towards the low-40s while the Moving Average Convergence Divergence (MACD) indicator stays below zero, suggesting rallies are likely to meet selling interest into resistance.
Immediate support is at the mentioned $4,100 area, so far closing the path towards the year-to-date lows, at $4,023, and the $4,000 psychological level. Further down, the late October 2025 low, at the $3,885 area, would come into focus.
On the topside, initial resistance is seen at Monday's high, just above $4,220. Above that level, bulls are likely to be challenged at the confluence of the descending trendline resistance and the June 17 high, at the $4,370-$4,380 area.
(The technical analysis of this story was written with the help of an AI tool.)
Gold FAQs
Gold has played a key role in human’s history as it has been widely used as a store of value and medium of exchange. Currently, apart from its shine and usage for jewelry, the precious metal is widely seen as a safe-haven asset, meaning that it is considered a good investment during turbulent times. Gold is also widely seen as a hedge against inflation and against depreciating currencies as it doesn’t rely on any specific issuer or government.
Central banks are the biggest Gold holders. In their aim to support their currencies in turbulent times, central banks tend to diversify their reserves and buy Gold to improve the perceived strength of the economy and the currency. High Gold reserves can be a source of trust for a country’s solvency. Central banks added 1,136 tonnes of Gold worth around $70 billion to their reserves in 2022, according to data from the World Gold Council. This is the highest yearly purchase since records began. Central banks from emerging economies such as China, India and Turkey are quickly increasing their Gold reserves.
Gold has an inverse correlation with the US Dollar and US Treasuries, which are both major reserve and safe-haven assets. When the Dollar depreciates, Gold tends to rise, enabling investors and central banks to diversify their assets in turbulent times. Gold is also inversely correlated with risk assets. A rally in the stock market tends to weaken Gold price, while sell-offs in riskier markets tend to favor the precious metal.
The price can move due to a wide range of factors. Geopolitical instability or fears of a deep recession can quickly make Gold price escalate due to its safe-haven status. As a yield-less asset, Gold tends to rise with lower interest rates, while higher cost of money usually weighs down on the yellow metal. Still, most moves depend on how the US Dollar (USD) behaves as the asset is priced in dollars (XAU/USD). A strong Dollar tends to keep the price of Gold controlled, whereas a weaker Dollar is likely to push Gold prices up.

Über eine Million Nutzer verlassen sich auf FXStreet für Echtzeit-Marktdaten, Charting-Tools, Experteneinblicke und Forex-News. Der umfassende Wirtschaftskalender und die Bildungs-Webinare helfen Tradern, informiert zu bleiben und fundierte Entscheidungen zu treffen. FXStreet wird von einem Team von rund 60 Fachleuten getragen, verteilt auf den Hauptsitz in Barcelona und verschiedene Regionen weltweit.
Weiterlesen


