
Hyperliquid Price Forecast: HYPE rebounds as retail interest offsets first-ever ETF outflows
Von Vishal Dixit
Aktualisiert: 8 Jun 2026


BELIEBTE ARTIKEL

Hyperliquid (HYPE) price is up 6% at press time on Monday, extending the 5% rebound from the previous day. The rebound aligns with HYPE's regaining retail strength in the derivatives market, offsetting the first-ever daily outflows from Exchange-Traded Funds (ETFs).
- Hyperliquid is up around 6% on Monday, extending the rebound from the previous day.
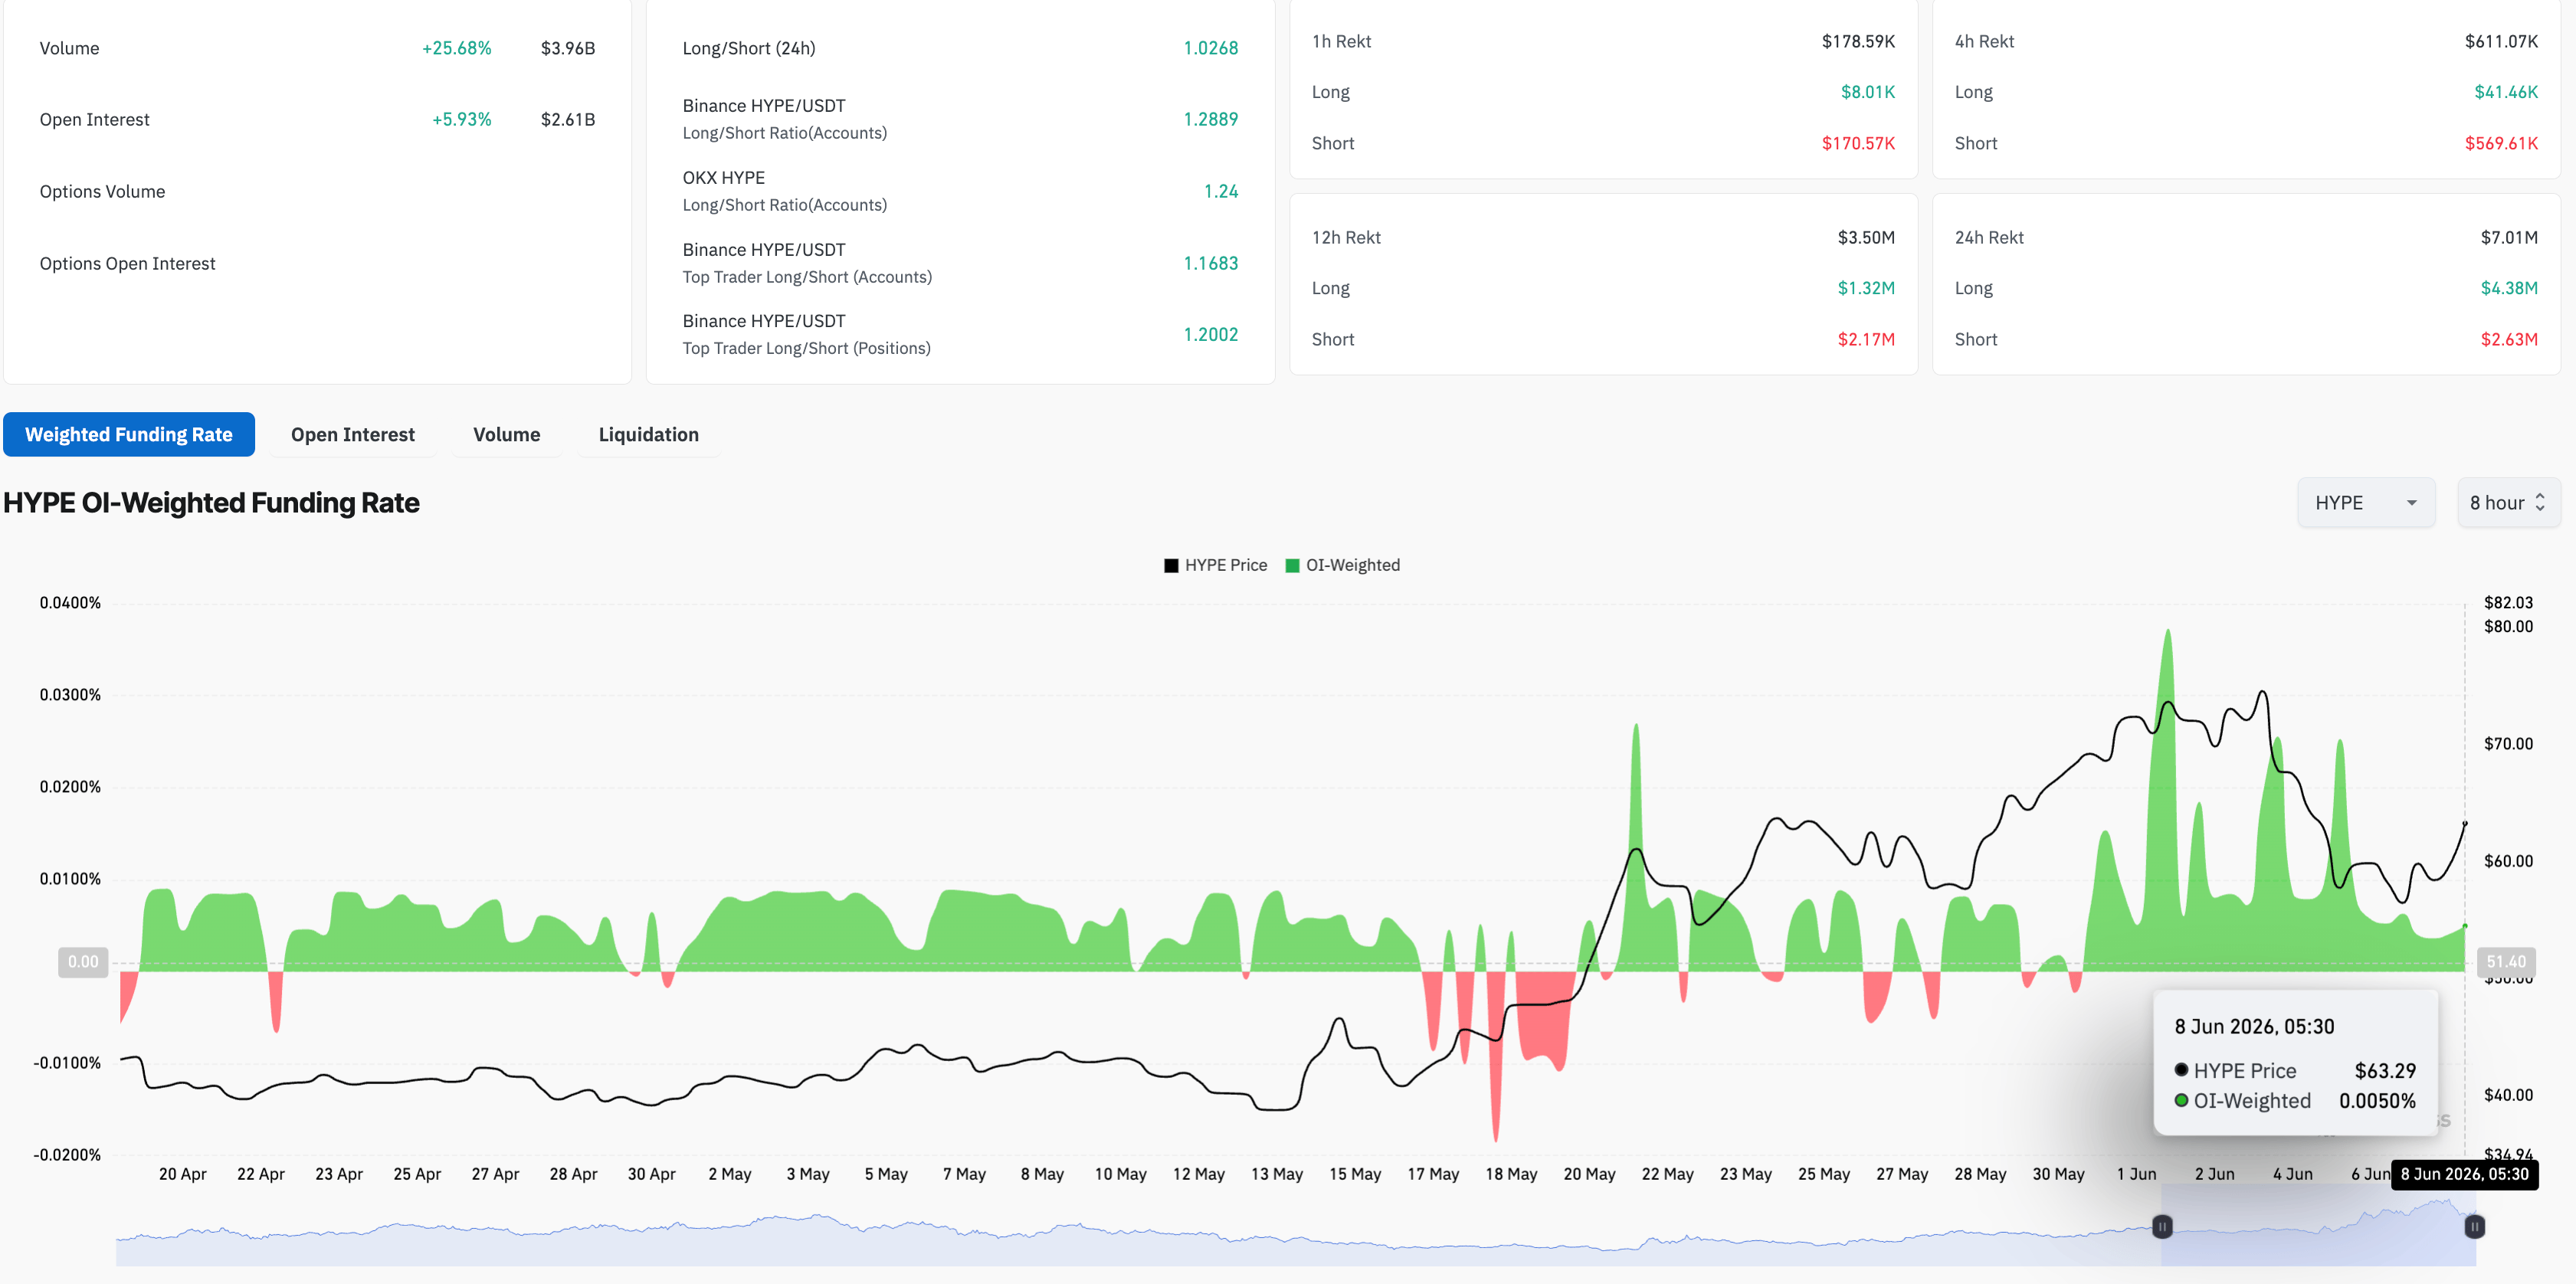
- Retail interest in HYPE rises amid the short-term rebound, with roughly a 6% increase in Open Interest over the last 24 hours.
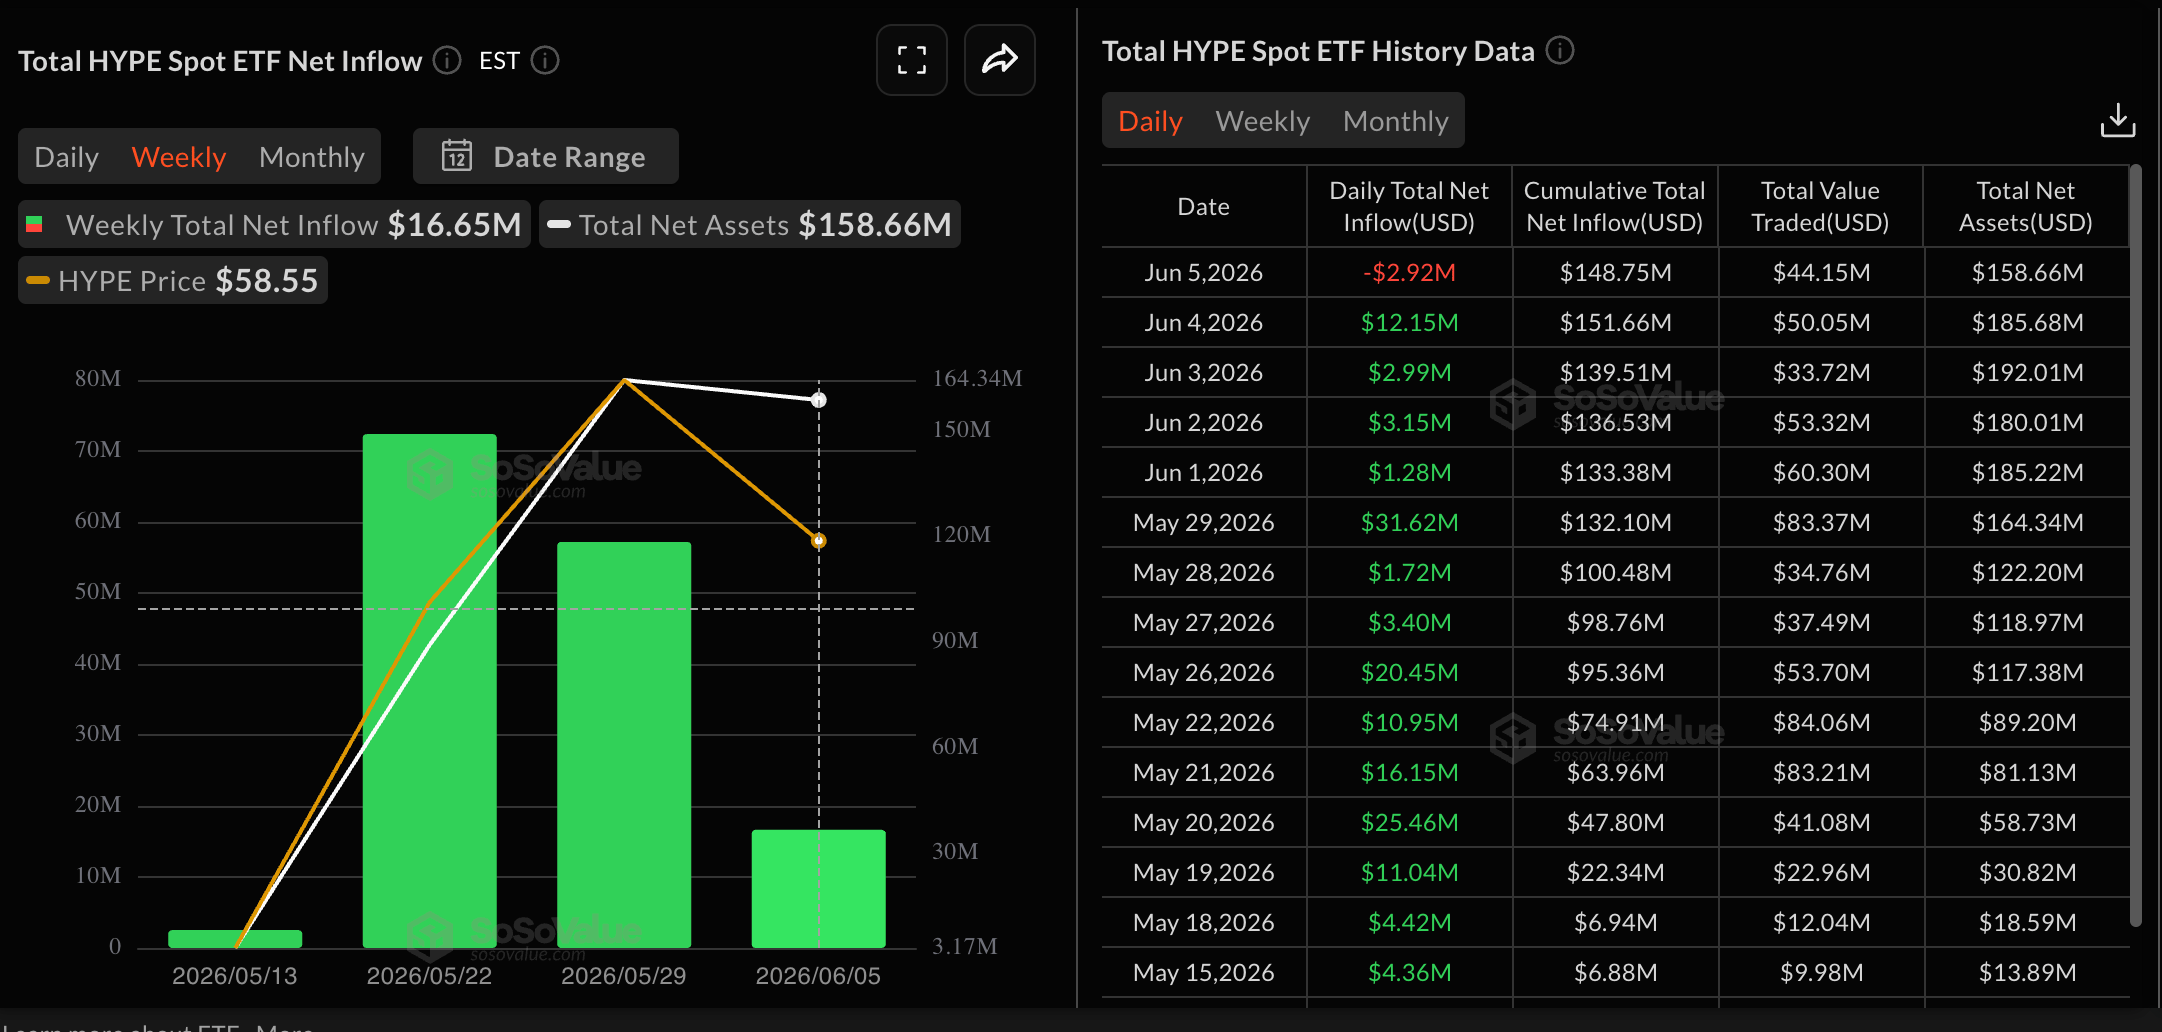
- HYPE ETFs recorded their first-ever daily outflow of about $2.92 million on Friday, pointing to a potential decline in institutional support.
Hyperliquid (HYPE) price is up 6% at press time on Monday, extending the 5% rebound from the previous day. The rebound aligns with HYPE's regaining retail strength in the derivatives market, offsetting the first-ever daily outflows from Exchange-Traded Funds (ETFs). The recovery in HYPE counters lingering downside momentum following the three-day decline of about 25% last week.
HYPE rebuilds retail demand, defying institutional outflow pressures
Hyperliquid starts the week on a recovering note, extending Sunday’s 5% rebound with renewed retail support. CoinGlass data show that HYPE futures Open Interest (OI) is up roughly 6% over the last 24 hours to $2.61 billion, reflecting an increase in leverage-linked positional buildup. This buildup often reflects a boost in risk-on sentiment, which, in this case, supports the upside bias.
That said, the OI-weighted funding rate has stabilized around 0.0050%, down from the 0.0253% peak on Friday, suggesting that buying pressure has eased but remains dominant.
On the institutional side, the HYPE-focused ETFs recorded their first-ever daily outflow of $2.92 million on Friday, signaling that professional investors are beginning to de-risk.
Taken together, the short-term rebound in retail interest, likely anticipating further upside, remains at risk if the institutional de-risking extends this week.
Hyperliquid upholds upward trend at key support level
Hyperliquid resurfaces above $60 at press time on Monday, maintaining its broadly bullish bias above the 50-, 100-, and 200-day Exponential Moving Averages (EMAs) at $53.41, $46.75, and $41.16, respectively. The stacked configuration of these EMAs, with the shorter tenors above the longer ones, continues to suggest an underlying uptrend.
That said, the Moving Average Convergence Divergence (MACD) indicator has slipped below its signal line on the daily chart, hinting that upside momentum has cooled. Meanwhile, the Relative Strength Index (RSI) at 55 shows an uptick from the midline, keeping a neutral-to-positive tone.
Looking up, the near-term resistance at the May 24 high at $64.48 caps the upside to HYPE's all-time high price of $75.76 from June 1. Beyond this, the upward trend in HYPE could target the R1 Pivot Point at $84.07.
On the downside, initial support is seen at the May 24 low of $54.74, close to the 50-day EMA at $53.41, where a deeper pullback could prompt dip buyers to re-engage in line with the broader trend. Below, the 100-day EMA at $46.75 and the 200-day EMA at $41.16 form subsequent support levels that should limit a more aggressive correction while the longer-term upward structure remains intact.
(The technical analysis of this story was written with the help of an AI tool.)

Über eine Million Nutzer verlassen sich auf FXStreet für Echtzeit-Marktdaten, Charting-Tools, Experteneinblicke und Forex-News. Der umfassende Wirtschaftskalender und die Bildungs-Webinare helfen Tradern, informiert zu bleiben und fundierte Entscheidungen zu treffen. FXStreet wird von einem Team von rund 60 Fachleuten getragen, verteilt auf den Hauptsitz in Barcelona und verschiedene Regionen weltweit.
Weiterlesen


