
NZD/USD Price Forecast: New Zealand Dollar falls to near 0.5650 as bearish bias prevails
Von Akhtar Faruqui
Aktualisiert: 25 Jun 2026


BELIEBTE ARTIKEL

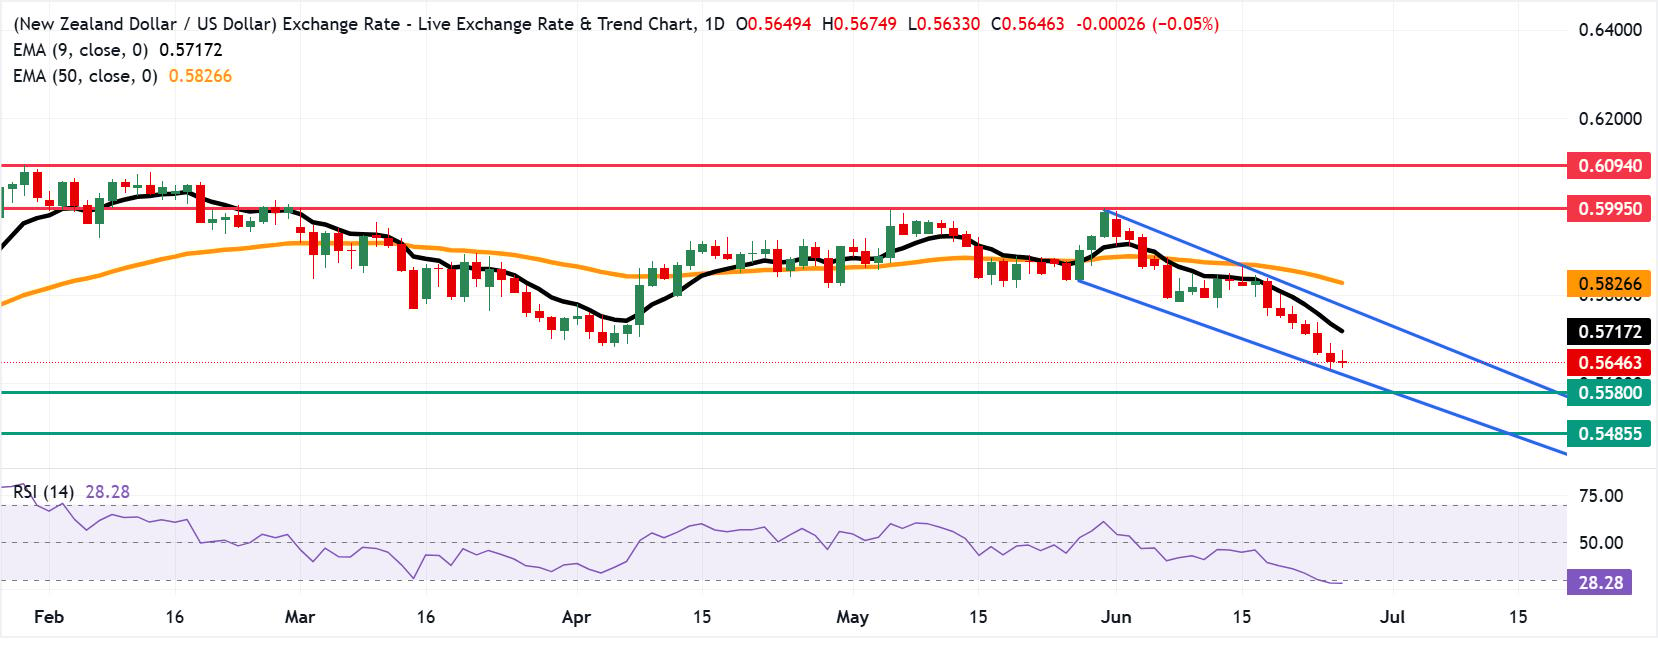
NZD/USD remains weaker for the seventh successive day, trading around 0.5650 during the Asian hours on Thursday. Technical analysis of the daily chart suggests the spot price is moving downwards within the descending channel, reflecting a persistent bearish bias.
- NZD/USD may find the immediate support at the descending channel's lower boundary around 0.5630.
- The 14-day Relative Strength Index at 28 signals oversold conditions.
- The primary barrier lies at the nine-day EMA of 0.5717.
NZD/USD remains weaker for the seventh successive day, trading around 0.5650 during the Asian hours on Thursday. Technical analysis of the daily chart suggests the spot price is moving downwards within the descending channel, reflecting a persistent bearish bias.
The NZD/USD pair is extending a clear bearish near-term bias as spot remains below both the nine-day and 50-day Exponential Moving Averages (EMAs), which now act as dynamic resistance. The slope of these EMAs is turning lower, reinforcing downside pressure, while the 14-day Relative Strength Index (RSI) languishes around 28, signaling oversold conditions that could slow, but not yet reverse, the prevailing decline.
The NZD/USD pair may find initial support at the lower boundary of the descending channel around 0.5630, followed by the 14-month low of 0.5580, which was recorded in November 2025. Further declines below this confluence support zone would strengthen the bearish bias and lead the pair to test the 0.5485, the lowest since March 2020.
On the upside, the NZD/USD pair may rise toward the primary barrier at the nine-day EMA of 0.5717, followed by the upper boundary of the descending channel around 0.5790. Further resistance lies at the 50-day EMA of 0.5826.
(The technical analysis of this story was written with the help of an AI tool.)
New Zealand Dollar Price Today
The table below shows the percentage change of New Zealand Dollar (NZD) against listed major currencies today. New Zealand Dollar was the weakest against the Swiss Franc.
| USD | EUR | GBP | JPY | CAD | AUD | NZD | CHF | |
|---|---|---|---|---|---|---|---|---|
| USD | -0.02% | -0.08% | -0.05% | -0.02% | -0.00% | 0.02% | -0.12% | |
| EUR | 0.02% | -0.03% | 0.04% | 0.03% | 0.07% | 0.09% | -0.07% | |
| GBP | 0.08% | 0.03% | 0.04% | 0.08% | 0.07% | 0.13% | -0.05% | |
| JPY | 0.05% | -0.04% | -0.04% | 0.02% | 0.03% | 0.05% | -0.10% | |
| CAD | 0.02% | -0.03% | -0.08% | -0.02% | 0.00% | 0.05% | -0.13% | |
| AUD | 0.00% | -0.07% | -0.07% | -0.03% | -0.00% | 0.03% | -0.10% | |
| NZD | -0.02% | -0.09% | -0.13% | -0.05% | -0.05% | -0.03% | -0.18% | |
| CHF | 0.12% | 0.07% | 0.05% | 0.10% | 0.13% | 0.10% | 0.18% |
The heat map shows percentage changes of major currencies against each other. The base currency is picked from the left column, while the quote currency is picked from the top row. For example, if you pick the New Zealand Dollar from the left column and move along the horizontal line to the US Dollar, the percentage change displayed in the box will represent NZD (base)/USD (quote).

Über eine Million Nutzer verlassen sich auf FXStreet für Echtzeit-Marktdaten, Charting-Tools, Experteneinblicke und Forex-News. Der umfassende Wirtschaftskalender und die Bildungs-Webinare helfen Tradern, informiert zu bleiben und fundierte Entscheidungen zu treffen. FXStreet wird von einem Team von rund 60 Fachleuten getragen, verteilt auf den Hauptsitz in Barcelona und verschiedene Regionen weltweit.
Weiterlesen


