
Pi Network Price Forecast: PI approaches key crossroads as bullish momentum wanes
Von Vishal Dixit
Aktualisiert: 24 Jun 2026


BELIEBTE ARTIKEL

Pi Network (PI) price trades below $0.1300 at press time on Wednesday, following a 4% decline the previous day. The PI token remains under intense selling pressure as the broader market risk-off sentiment weighs down.
- Pi Network hovers below $0.1300 on Wednesday, following a 4% drop the previous day.
- Broader market risk-off sentiment weighs on PI, with sellers remaining dominant.
- PI should sustain above $0.1280 to avoid a steeper decline toward its all-time low of $0.1184.
Pi Network (PI) price trades below $0.1300 at press time on Wednesday, following a 4% decline the previous day. The PI token remains under intense selling pressure as the broader market risk-off sentiment weighs down. Technically, PI should sustain above $0.1280 to avoid a steeper correction toward its record low of $0.1184.
Broader market stress weighs down on PI
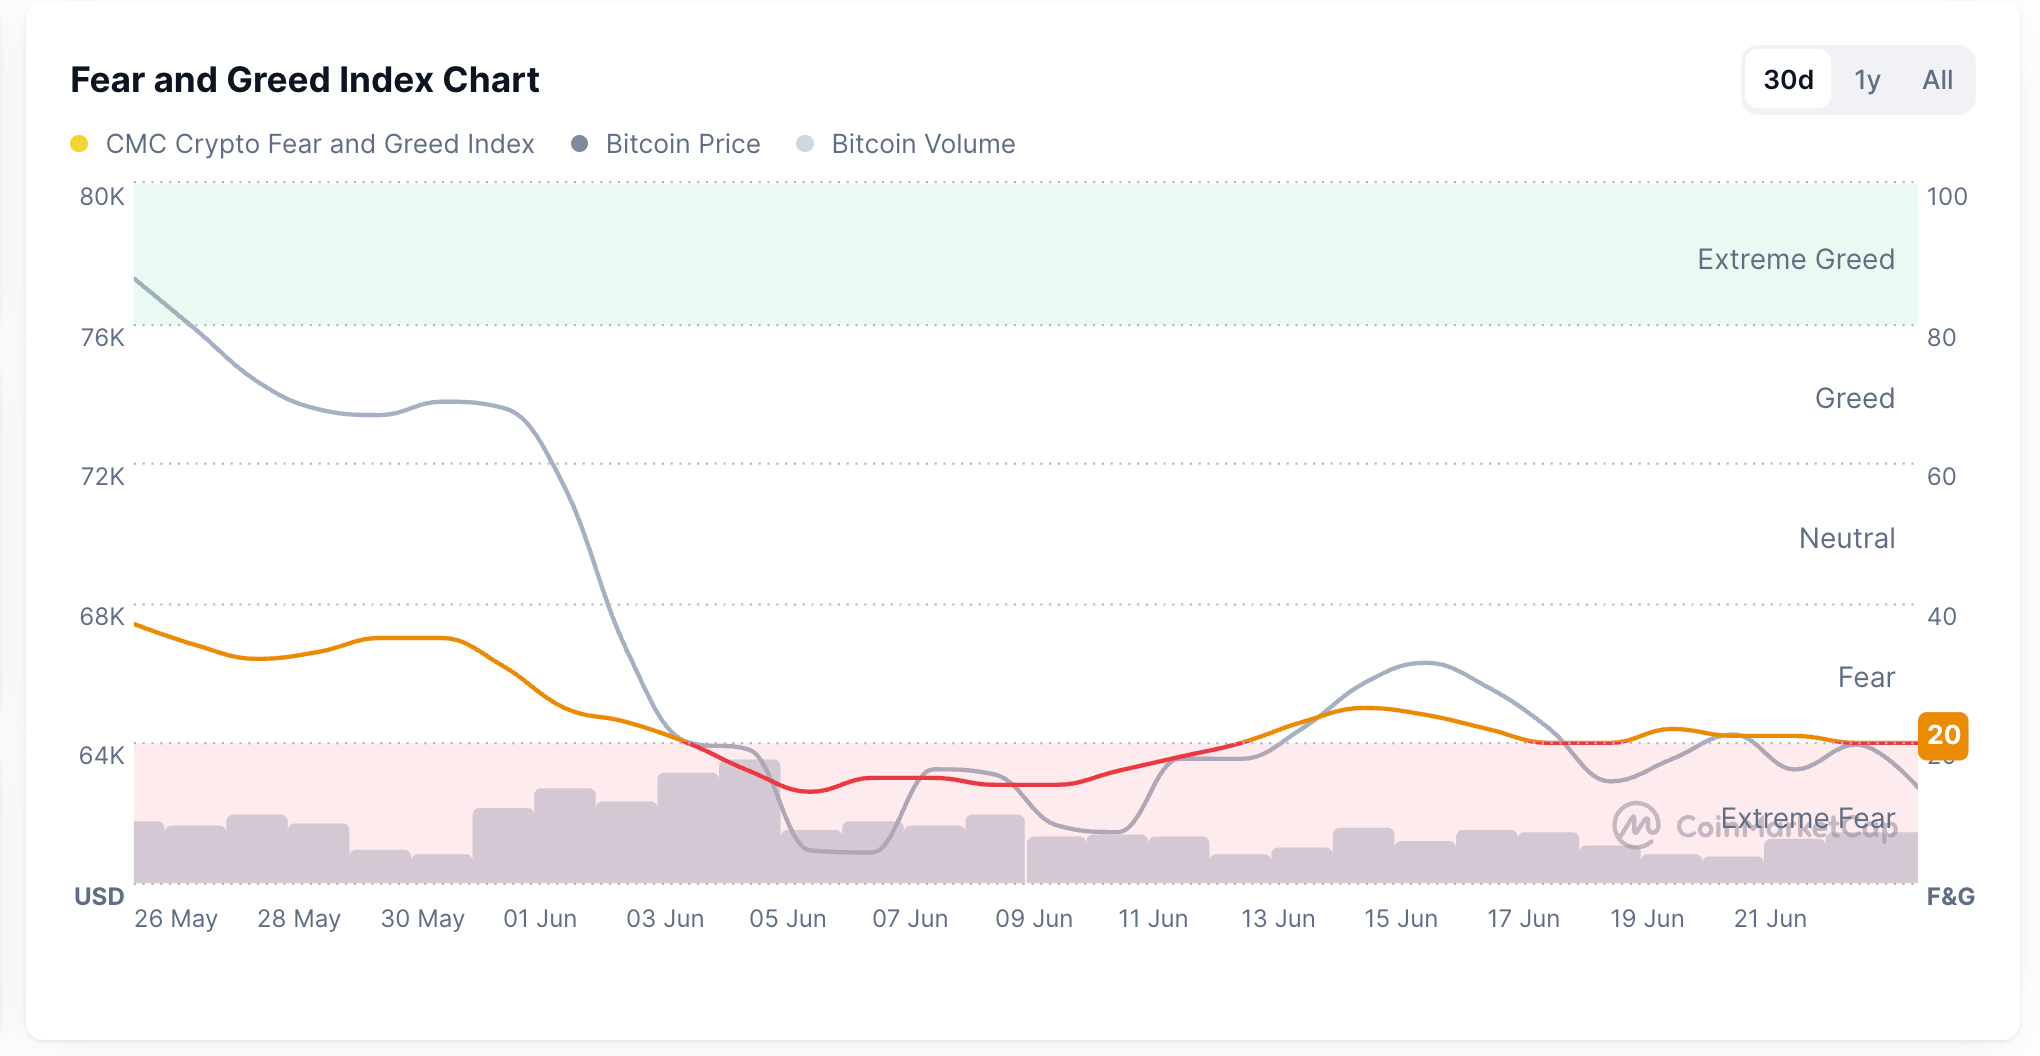
Pi Network remains under intense selling pressure as bearish sentiment spreads across the broader crypto market. CoinMarketCap’s Fear and Greed Index at 20 shows growing risk averse sentiment among investors, which typically implies reduced demand low market capitalization altcoins, such as Pi Network as investors pivot to Bitcoin (BTC) and other blue chip tokens.
Pi Network risks sinking below a key crossroads
Pi Network holds steady slightly below $0.1300 at press time on Wednesday, following its 4% drop the previous day. PI remains in a bearish environment, holding below the 50-day Exponential Moving Average (EMA) at $0.1440 and the 200-day EMA near $0.1890, which keeps the broader downtrend intact despite a modest rebound off recent lows.
From a technical perspective, price performs a secondary retest of a broken resistance trendline near $0.1250, which serves as the last line of defense for buyers to regain control. A decisive close below this zone could threaten a decline toward the June 6 low at $0.1184, and a slip below this level would push PI to find new lower support levels.
That said, the Relative Strength Index (RSI) at around 39 on the daily chart maintains a broadly short-term recovery but remains in weak territory below the midline. At the same time, the Moving Average Convergence Divergence (MACD) histogram contracts and remains marginally positive, suggesting residual upside pressure is easing.
On the topside, the 50-day EMA at $0.1440 is the first meaningful resistance, and a daily close above it would be needed to alleviate the immediate bearish bias, with the 200-day EMA near $0.1890 acting as a much higher hurdle for any sustained recovery.
(The technical analysis of this story was written with the help of an AI tool.)
Cryptocurrency prices FAQs
Token launches influence demand and adoption among market participants. Listings on crypto exchanges deepen the liquidity for an asset and add new participants to an asset’s network. This is typically bullish for a digital asset.
A hack is an event in which an attacker captures a large volume of the asset from a DeFi bridge or hot wallet of an exchange or any other crypto platform via exploits, bugs or other methods. The exploiter then transfers these tokens out of the exchange platforms to ultimately sell or swap the assets for other cryptocurrencies or stablecoins. Such events often involve an en masse panic triggering a sell-off in the affected assets.
Macroeconomic events like the US Federal Reserve’s decision on interest rates influence crypto assets mainly through the direct impact they have on the US Dollar. An increase in interest rate typically negatively influences Bitcoin and altcoin prices, and vice versa. If the US Dollar index declines, risk assets and associated leverage for trading gets cheaper, in turn driving crypto prices higher.
Halvings are typically considered bullish events as they slash the block reward in half for miners, constricting the supply of the asset. At consistent demand if the supply reduces, the asset’s price climbs.

Über eine Million Nutzer verlassen sich auf FXStreet für Echtzeit-Marktdaten, Charting-Tools, Experteneinblicke und Forex-News. Der umfassende Wirtschaftskalender und die Bildungs-Webinare helfen Tradern, informiert zu bleiben und fundierte Entscheidungen zu treffen. FXStreet wird von einem Team von rund 60 Fachleuten getragen, verteilt auf den Hauptsitz in Barcelona und verschiedene Regionen weltweit.
Weiterlesen


