
Ripple and Stellar outlook: Under selling pressure as cautious sentiment raises downside risks
Von Manish Chhetri
Aktualisiert: 23 Jun 2026


BELIEBTE ARTIKEL

Ripple (XRP) and Stellar (XLM) remain under selling pressure on Tuesday as cautious market sentiment continues to weigh on the broader crypto market. XRP struggles to reclaim the upper boundary of its falling channel, while XLM extends its decline for a fifth consecutive day.
- XRP trades at $1.12 after failing to break above the upper boundary of its falling channel pattern last week.
- XLM extends its correction on Tuesday, falling for a fifth consecutive day of losses over 15%.
- On-chain and derivatives data point to cautious investor sentiment, increasing the risk of further downside for both altcoins.
Ripple (XRP) and Stellar (XLM) remain under selling pressure on Tuesday as cautious market sentiment continues to weigh on the broader crypto market. XRP struggles to reclaim the upper boundary of its falling channel, while XLM extends its decline for a fifth consecutive day. Weak on-chain activity and cautious derivatives metrics raise the risk of a deeper correction.
Derivatives metrics support a fading interest among traders
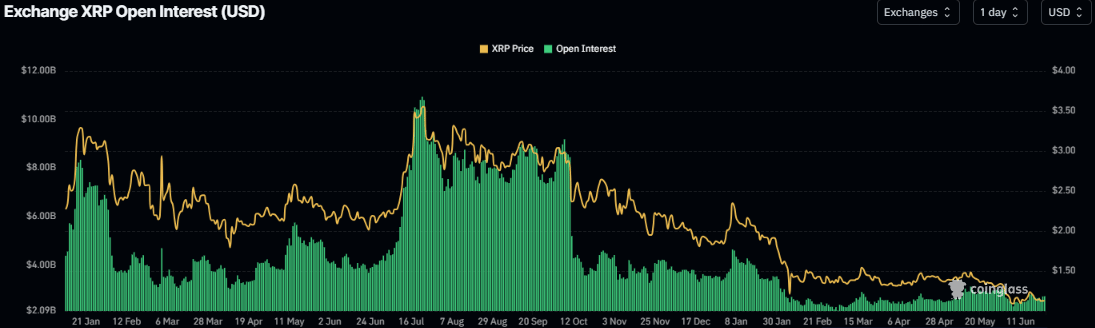
Derivatives metrics support a negative outlook for XRP and XLM. XLM’s futures Open Interest (OI) dropped to $2.70 billion on Tuesday after a mild rise in early June but has been continuously falling since October 2025. This drop in OI reflects waning investor participation and projects a bearish outlook.
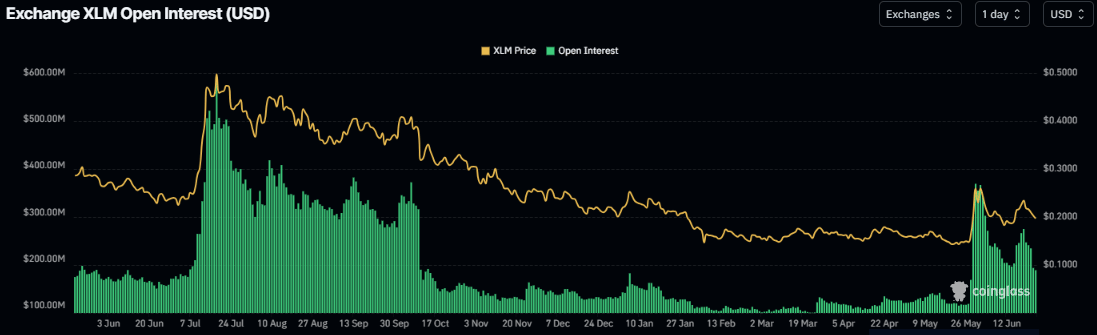
Similarly, XLM futures OI dropped to $175 million on Tuesday after sharp rises at the end of May and in mid-June, and has since steadily declined, supporting a bearish outlook.
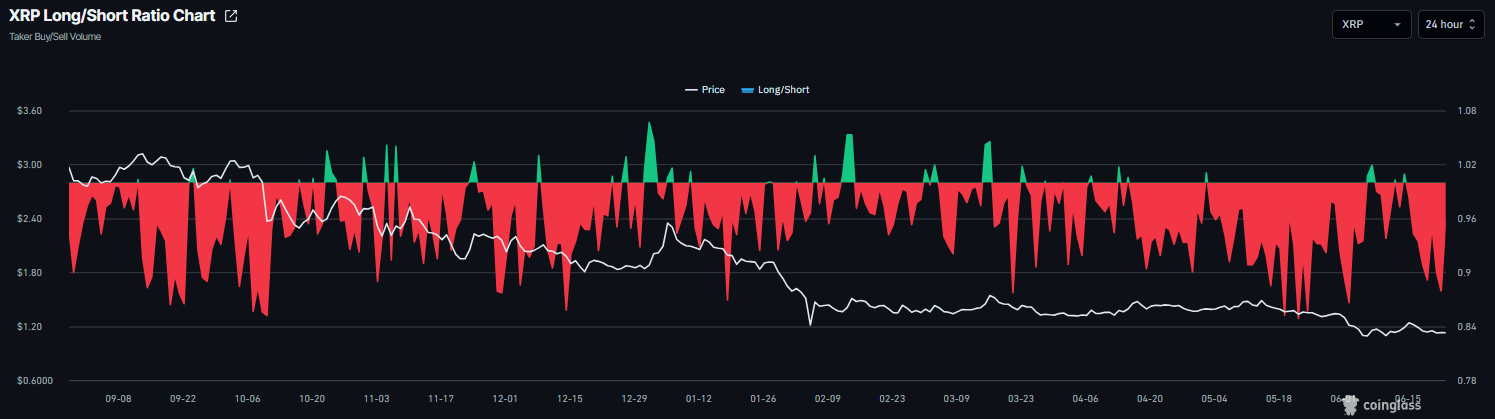
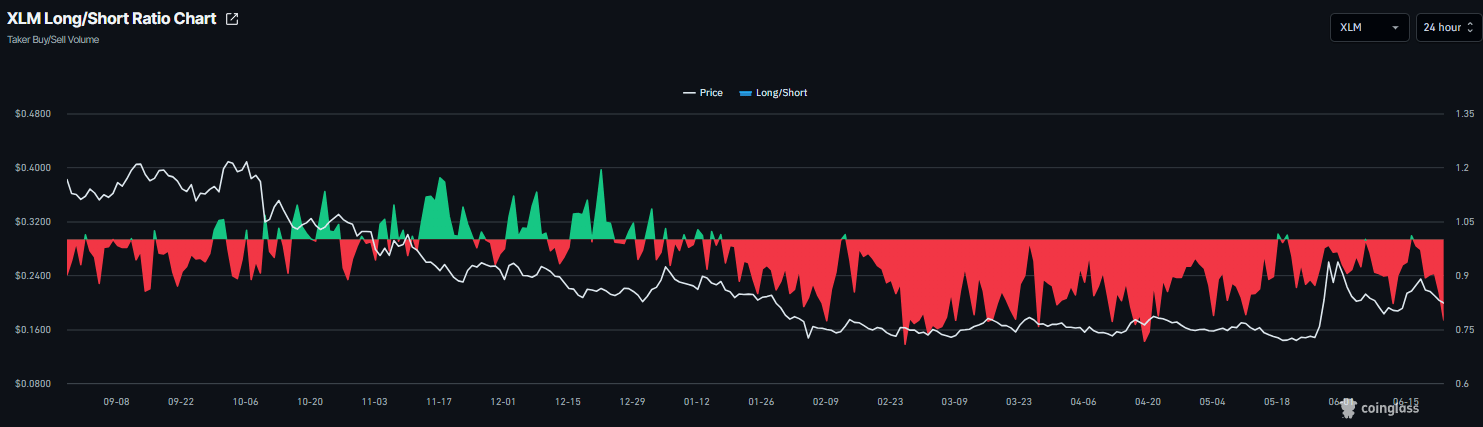
In addition, CoinGlass’ long-to-short ratio for XRP and XLM read 0.87 and 0.77, respectively, on Tuesday, nearing their lowest levels in over a month. This ratio, being below 1, reflects bearish sentiment in the market, as more traders are betting the asset’s price will fall.
Mixed data in on-chain caps upside move
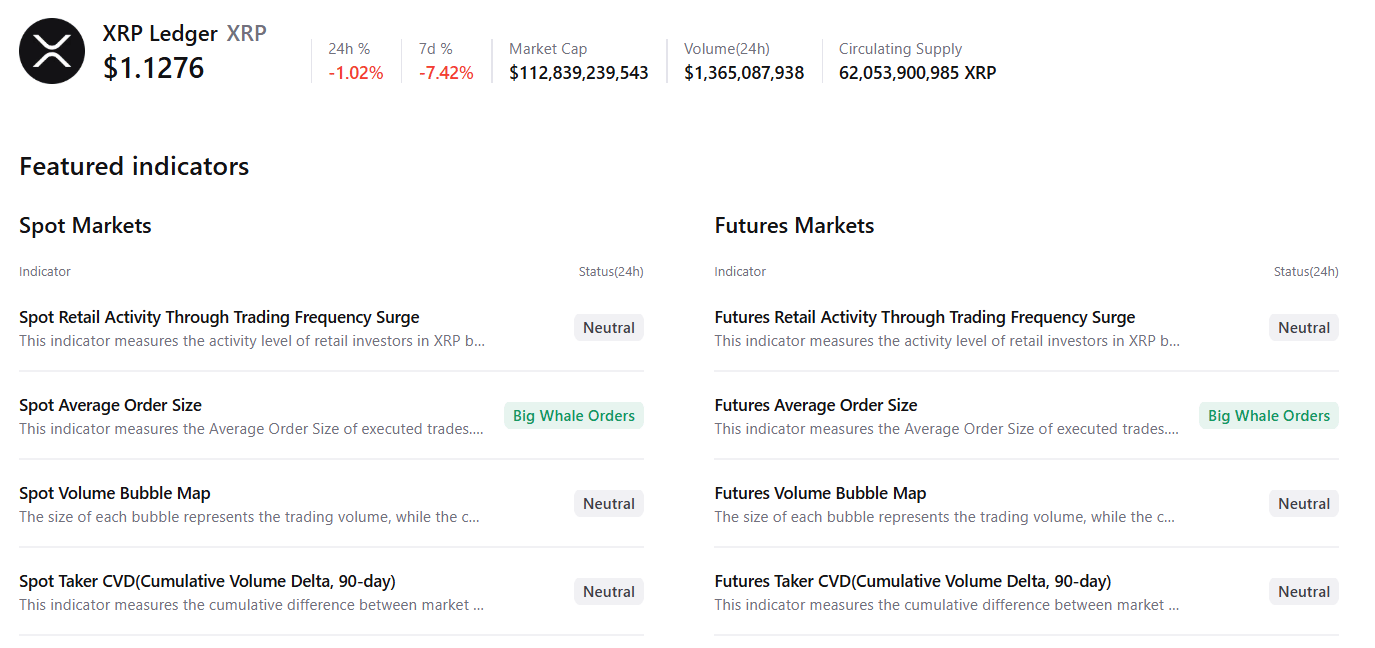
CryptoQuant’s summary data shows mixed sentiment. XRP’s spot markets show large whales' orders with neutral conditions in other metrics, supporting a potential recovery.
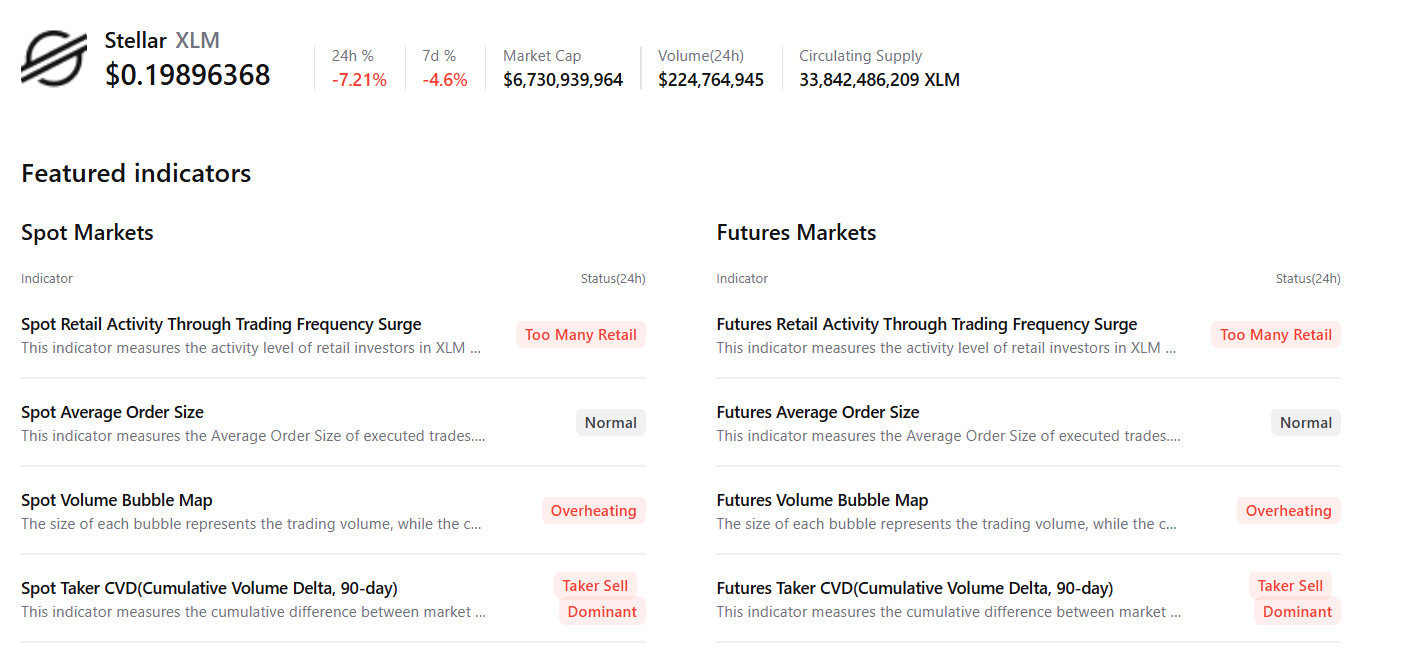
However, XLM shows an overheating condition in the spot and futures markets, with rising retail activity and sell-side dominance, hinting at bearish sentiment among traders and capping any potential recovery.
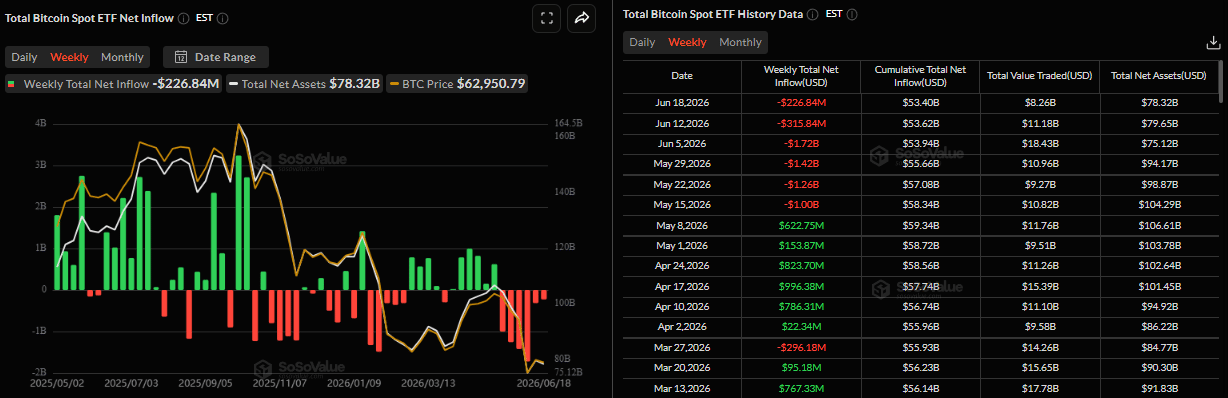
Meanwhile, SoSoValue data shows some signs of optimism. Spot Exchange Traded Funds (ETFs) recorded an inflow of $5.31 million on Monday, marking the second consecutive day of inflow since last week. If this inflow trend continues and intensifies, XRP could see a recovery ahead.
XRP technical outlook: Momentum indicators show early bearish signs
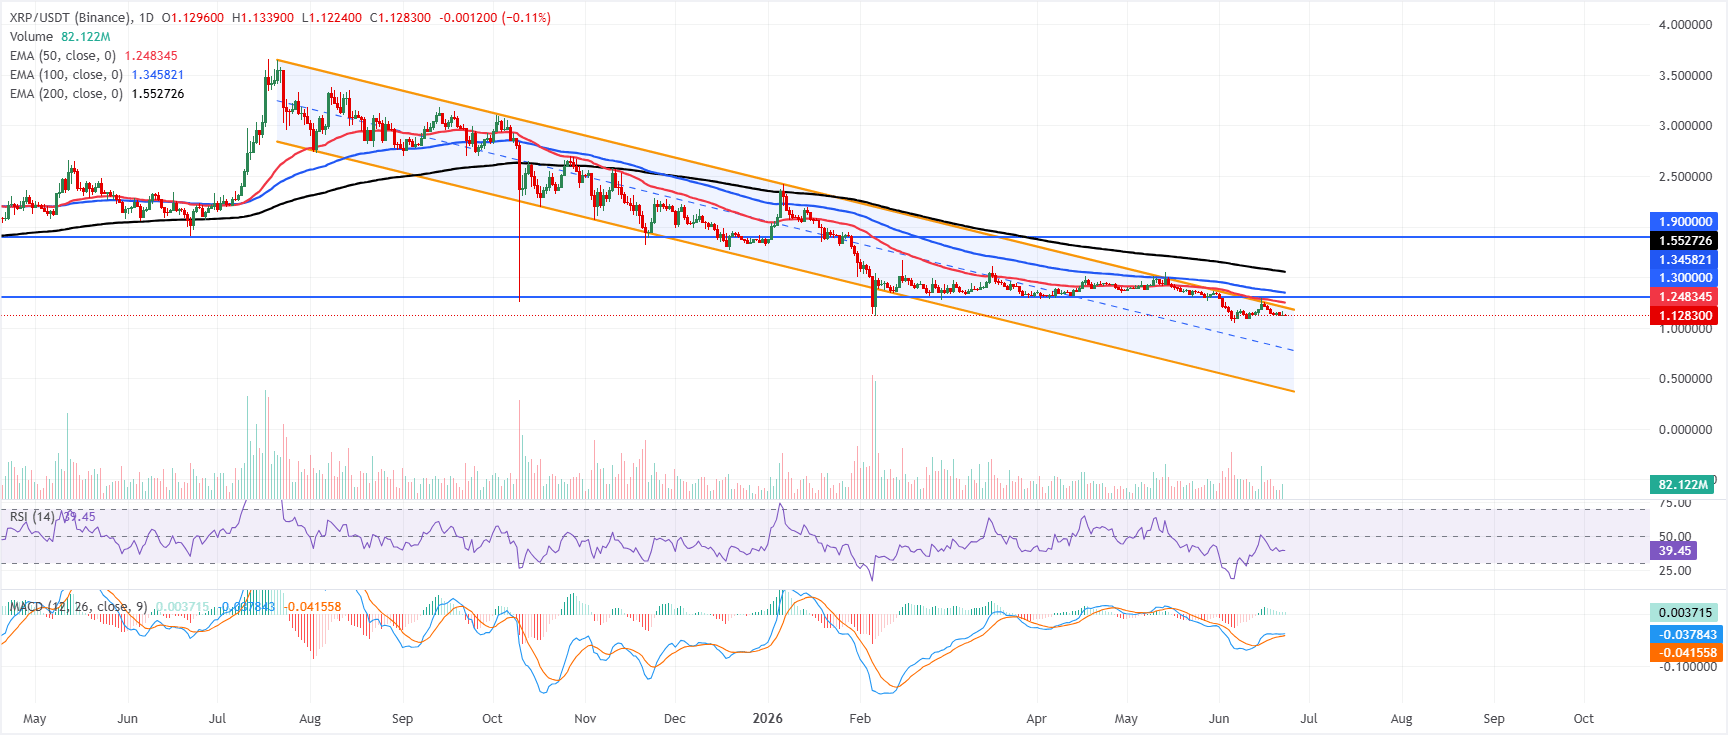
XRP price trades at $1.128 on Tuesday after being rejected from the upper boundary of the falling channel in the previous week. XRP remains under clear bearish pressure, holding well below the 50-day, 100-day, and 200-day Exponential Moving Averages (EMAs) at $1.248, $1.345, and $1.552, respectively, reinforcing a downside bias. At the same time, the price stays capped beneath this bearish stack.
Momentum has stabilized, with the Relative Strength Index (RSI) hovering near 39 and Moving Average Convergence Divergence (MACD) in mildly positive territory but flattening, suggesting only tentative recovery attempts within a still-dominant downtrend channel.
On the topside, initial resistance aligns with the upper boundary of the downward parallel channel around $1.199, where sellers are likely to defend the recent breakdown. Above that, the 50-day EMA at $1.248 is the next hurdle before the horizontal barrier at $1.300, followed by the 100-day EMA at $1.345 and the 200-day EMA at $1.552, ahead of a more distant resistance level at $1.900. With no nearby technical floors visible below the current price, any renewed selling would leave XRP vulnerable to finding fresh support at uncharted lower levels unless it can quickly reclaim the $1.199 area.
XLM technical outlook: Technical indicators show bearish signs
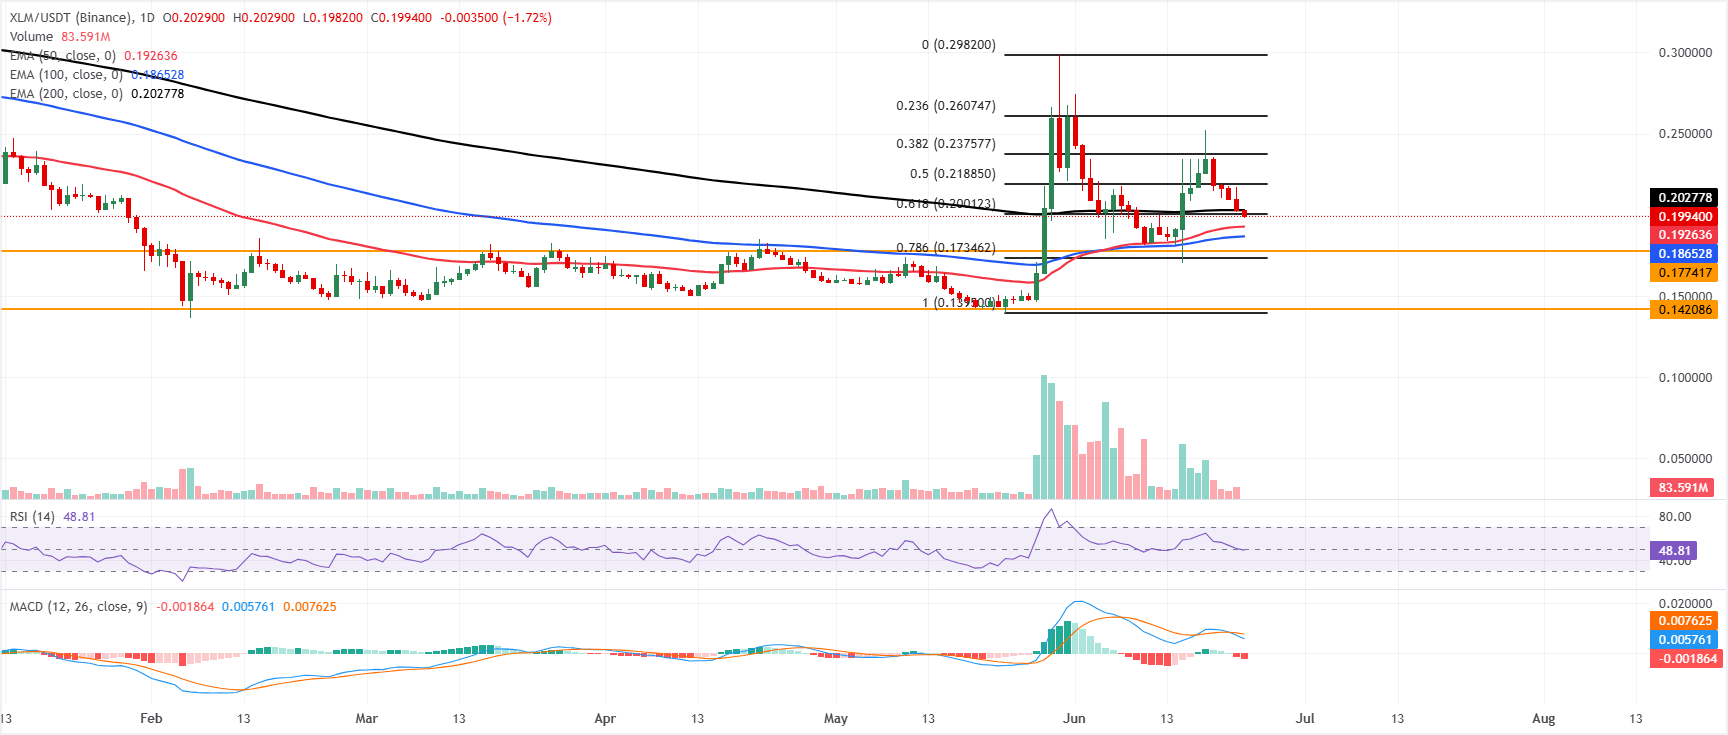
XLM trades at $0.1994 on Tuesday, holding below the 200-day EMA at $0.2028 and just under the 61.8% Fibonacci retracement at $0.2001, which together cap the upside and keep the near-term bias mildly bearish. XLM remains above the 50-day EMA at $0.1926 and the 100-day EMA at $0.1865, suggesting an ongoing consolidation inside a broader corrective phase. At the same time, the RSI at 48 is neutral, and the MACD has slipped slightly into negative territory, hinting that upside momentum is fading.
On the topside, initial resistance is aligned at the 61.8% Fibonacci retracement at $0.2001, followed closely by the 200-day EMA at $0.2028; a sustained break higher would expose the 50% retracement near $0.2188 and then $0.2376 and $0.2607, corresponding to the 38.2% and 23.6% Fibonacci retracements of the latest swing.
On the downside, immediate support emerges at the 50-day EMA at $0.1926, ahead of the 100-day EMA at $0.1865; a deeper pullback would turn focus toward the horizontal floor around $0.1774 and the 78.6% Fibonacci retracement at $0.1735, with more distant supports at $0.1421 and the cycle low area near $0.1395.
(The technical analysis of this story was written with the help of an AI tool.)

Über eine Million Nutzer verlassen sich auf FXStreet für Echtzeit-Marktdaten, Charting-Tools, Experteneinblicke und Forex-News. Der umfassende Wirtschaftskalender und die Bildungs-Webinare helfen Tradern, informiert zu bleiben und fundierte Entscheidungen zu treffen. FXStreet wird von einem Team von rund 60 Fachleuten getragen, verteilt auf den Hauptsitz in Barcelona und verschiedene Regionen weltweit.
Weiterlesen


