
Ripple Price Forecast: XRP on the verge of a 7% increase amid improving on-chain outlook
Von John Isige
Aktualisiert: 21 Apr 2026


BELIEBTE ARTIKEL

Ripple (XRP) shows signs of extending gains while trading above $1.43 at the time of writing on Tuesday. Several key support levels uphold the neutral-to-bullish bias, including the demand zone between $1.40 and $1.42.
- XRP extends gains for the second consecutive day, trading above $1.43 on Tuesday as bulls tighten their grip.
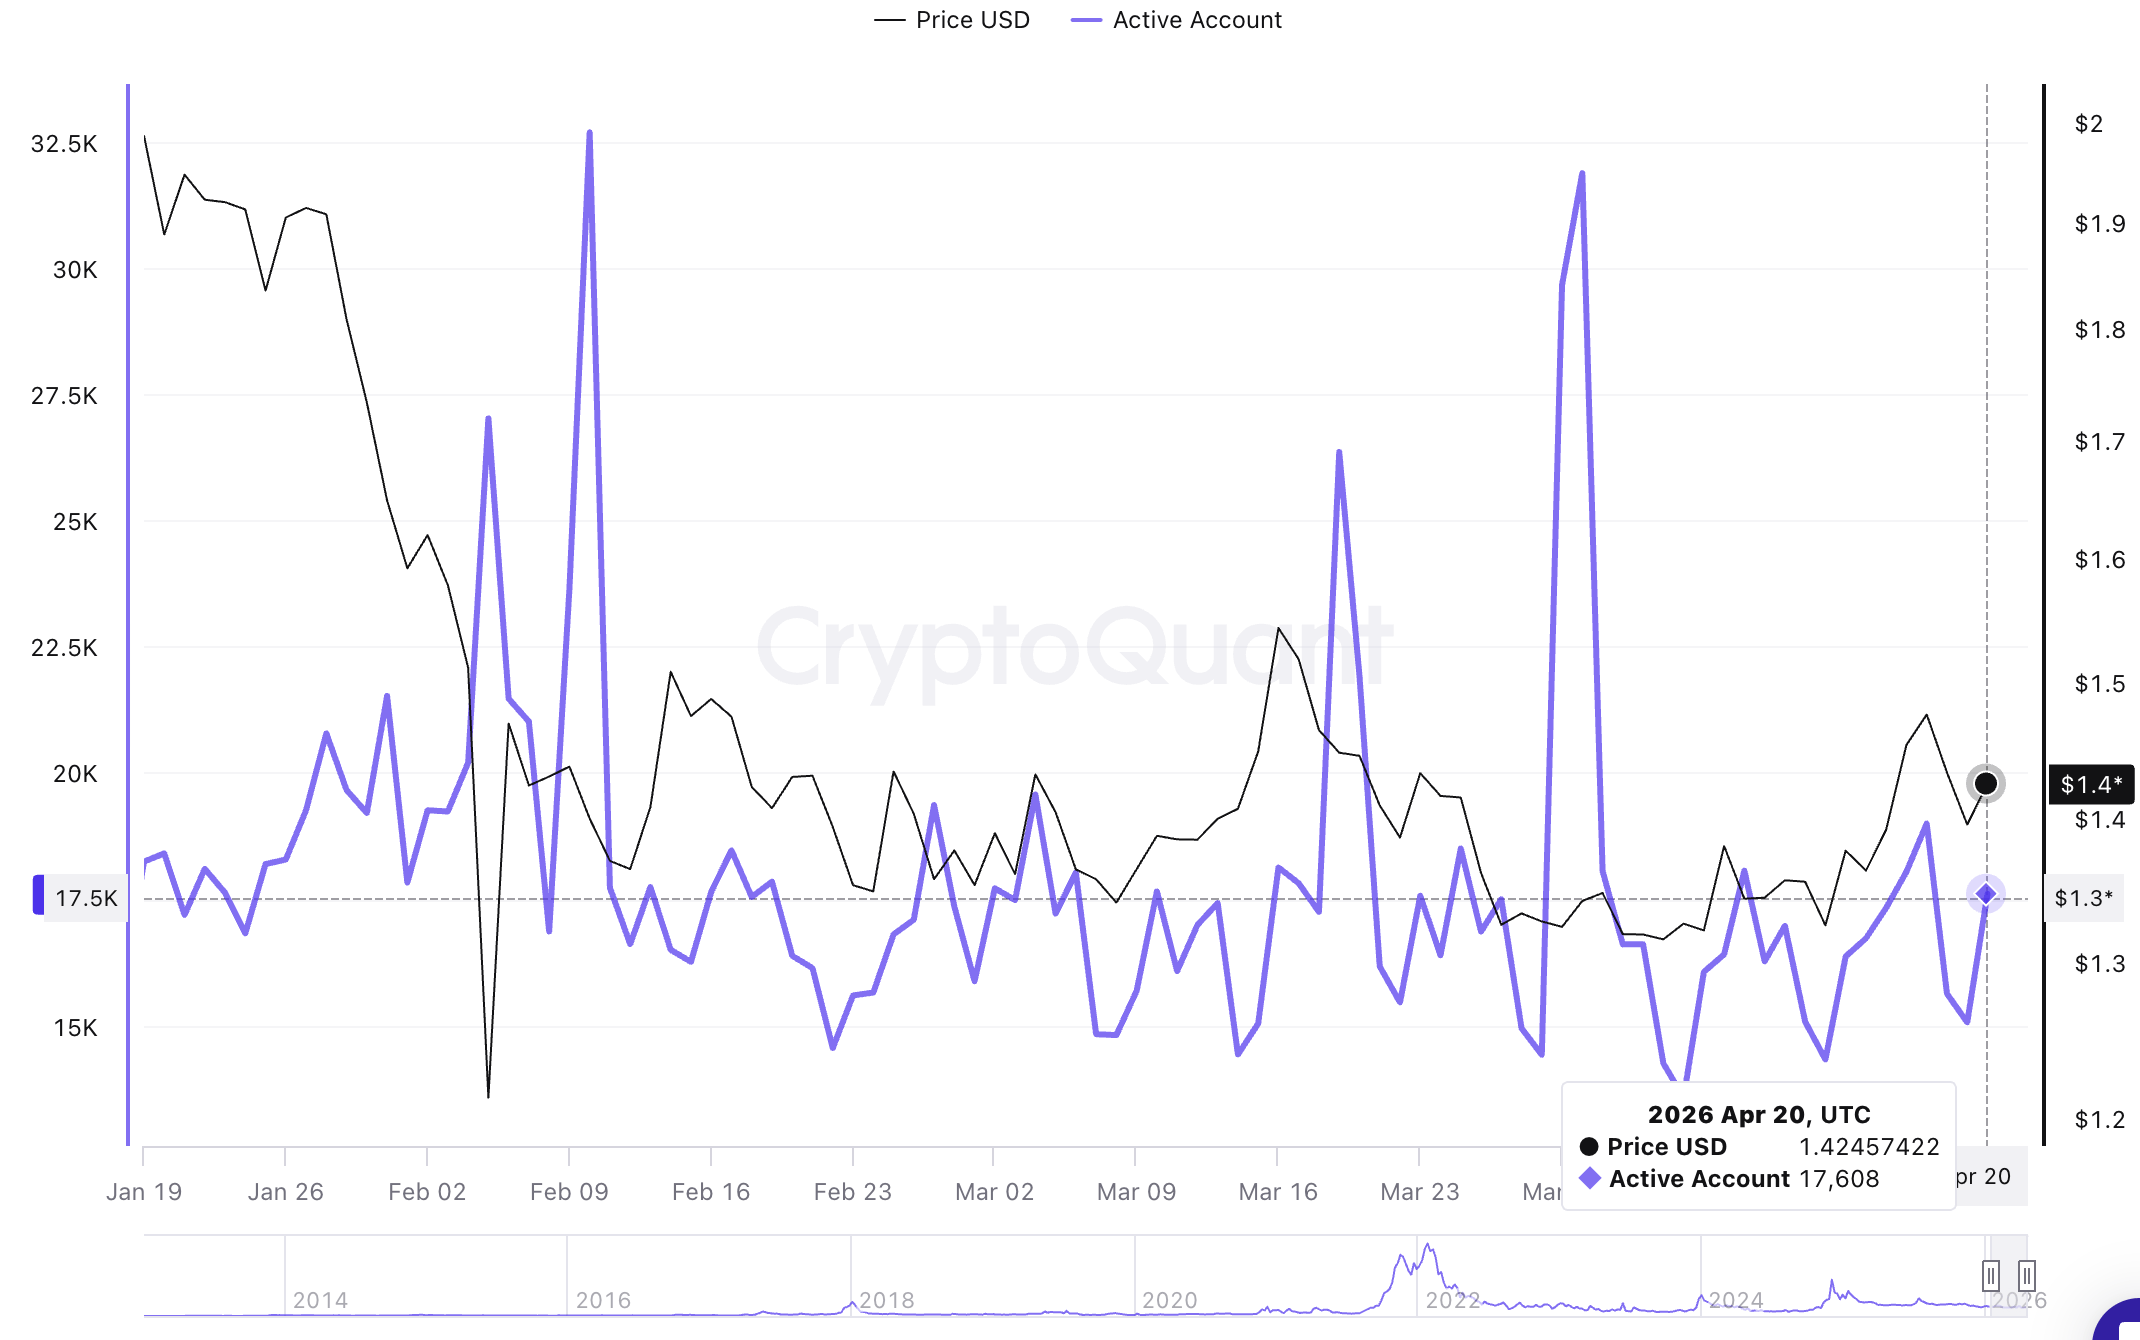
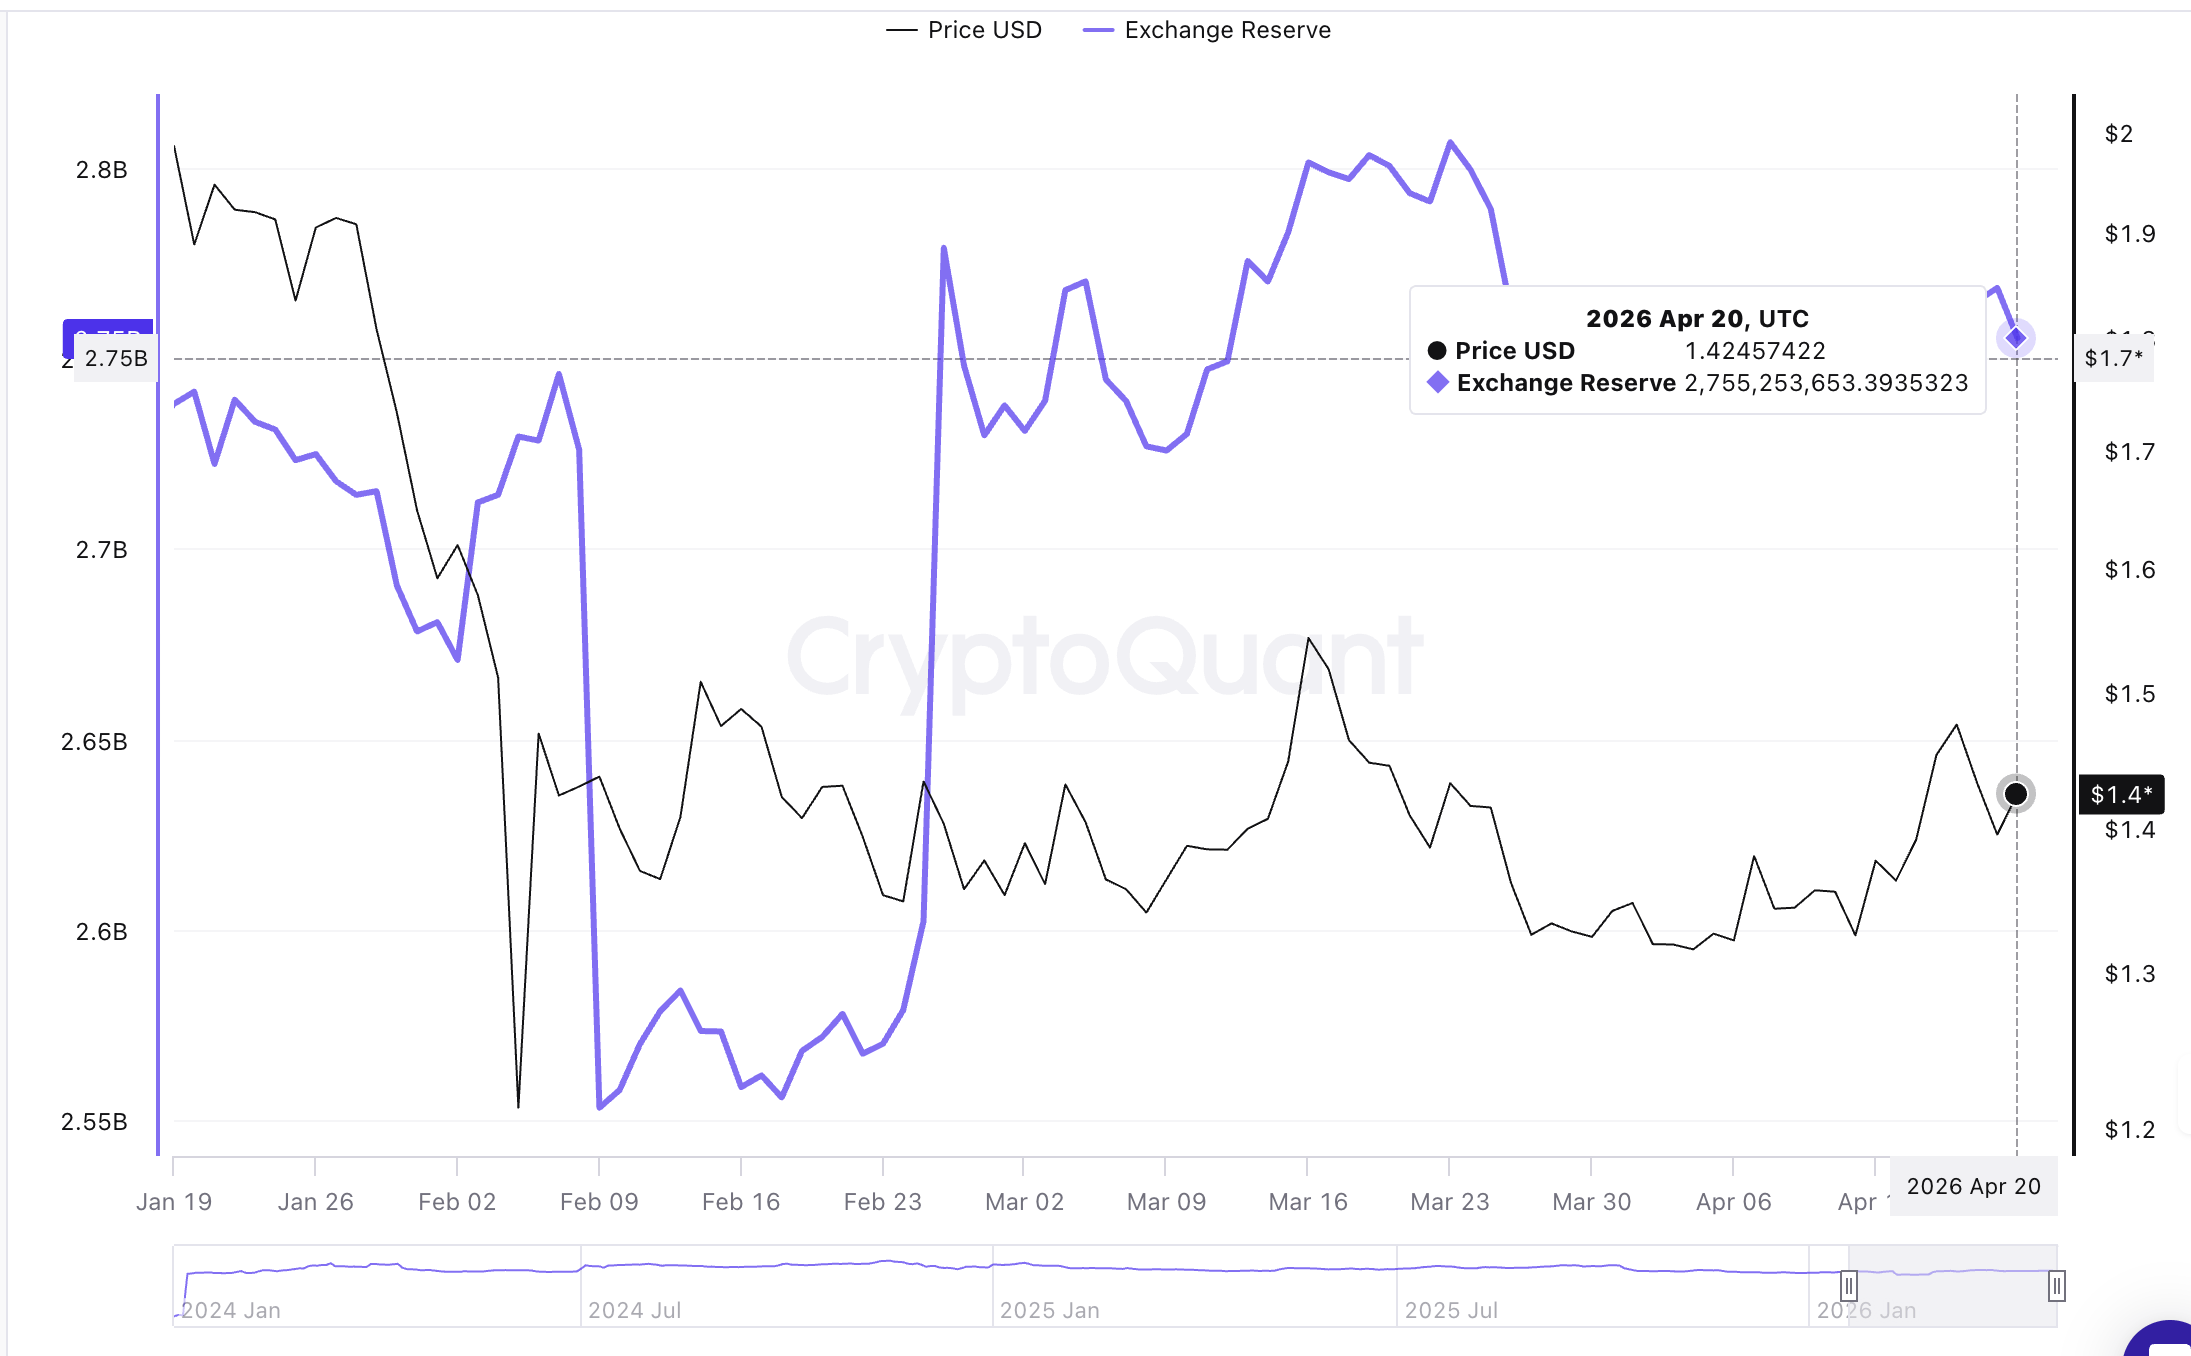
- XRP’s on-chain metrics show modest improvement, with the number of active addresses climbing to near 18,000 and Binance exchange reserves declining to 2.76 billion tokens.
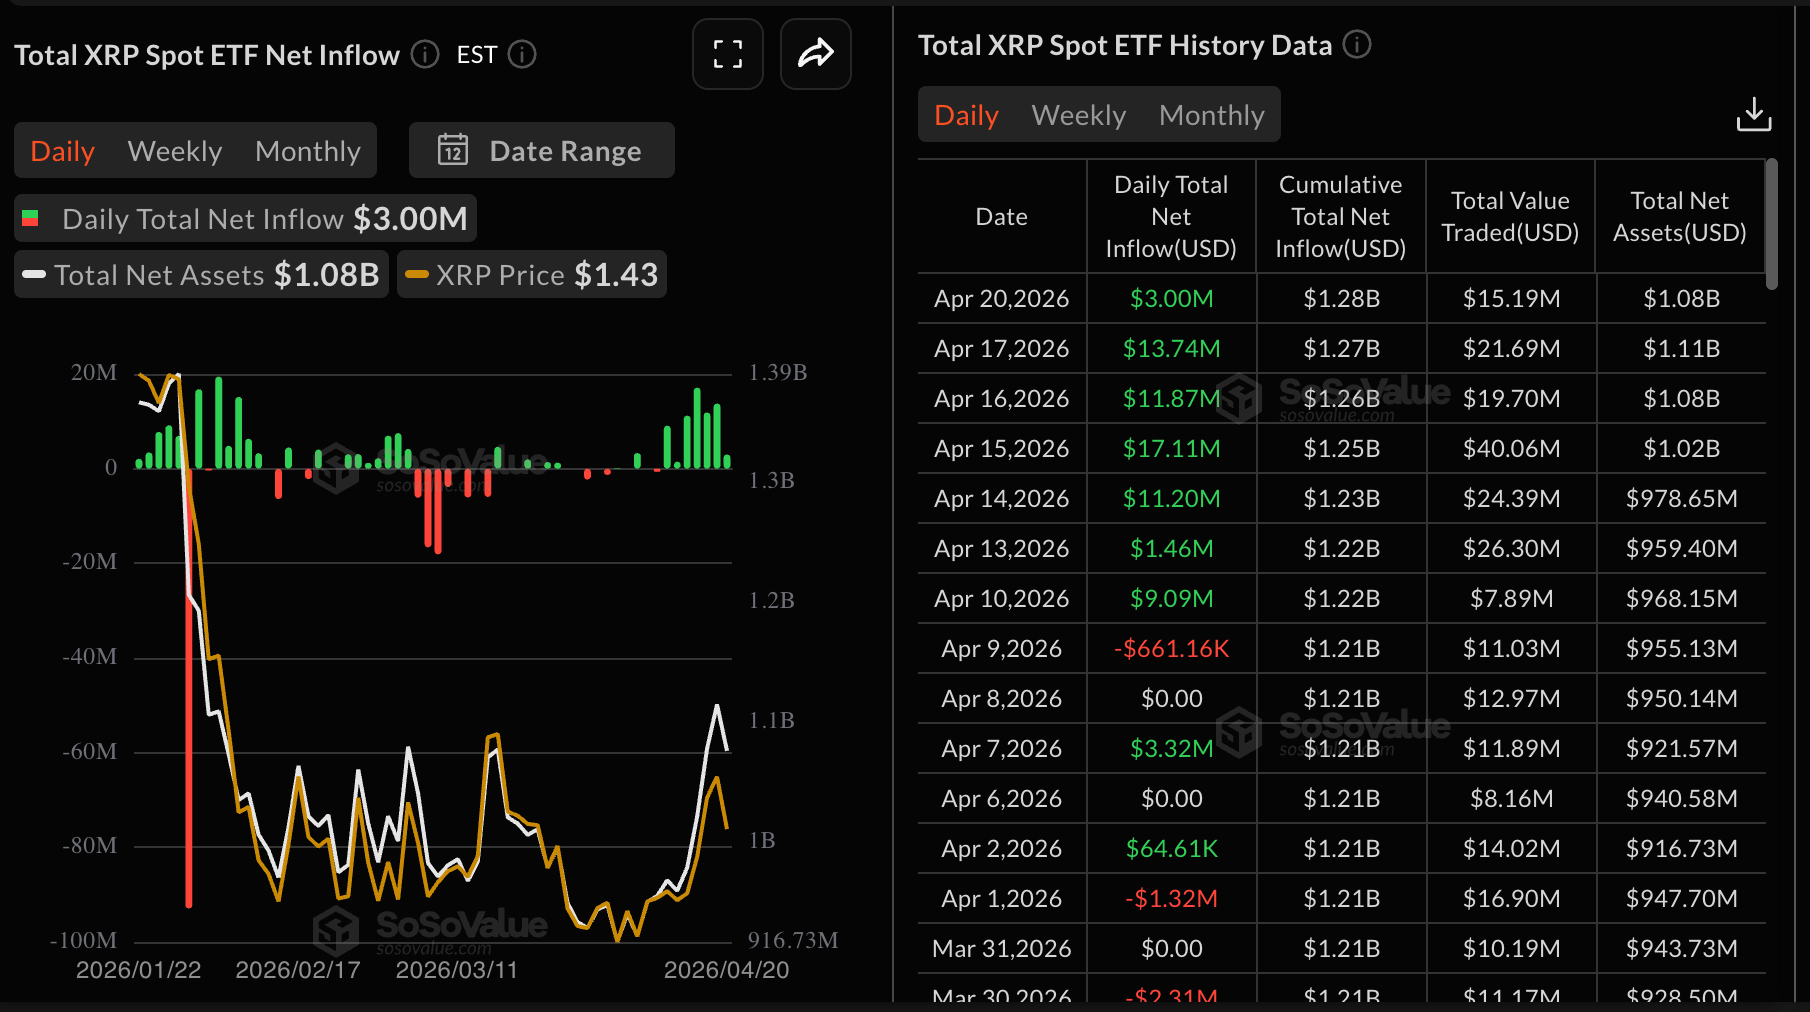
- US-listed spot ETFs extended their bullish streak with $3 million in inflows on Monday.
Ripple (XRP) shows signs of extending gains while trading above $1.43 at the time of writing on Tuesday. Several key support levels uphold the neutral-to-bullish bias, including the demand zone between $1.40 and $1.42.
On the upside, bulls need to flip the supply area at $1.45 into support to extend the uptrend by 7% and reach the short-term objective at $1.54.
On-chain activity bolsters XRP’s recovery outlook
XRP active addresses show a marginal improvement, rising above 17,600 on Monday, up from roughly 15,000 the previous day. Historically, sustained growth in the Active Addresses metric points to increased user participation, demand for XRP and a strengthening fundamental outlook. As observed in the chart below, the price often rises alongside steady growth in active addresses.
XRP Binance exchange reserves, on the other hand, appear to be edging lower, averaging 2.76 billion tokens as of Monday, from roughly 2.77 billion tokens the previous day.
As sentiment improves in the broader crypto market, investors gain confidence to hold onto their XRP assets by transferring them from exchanges to self-custody platforms. Notably, reduced supply on exchanges suggests fading selling pressure, which can positively impact the price.
Meanwhile, institutional interest in related investment products has remained steady, as evidenced by XRP spot Exchange-Traded Funds (ETFs) attracting $3 million in inflows on Monday. This marked the seventh consecutive day of inflows since April 10, according to SoSoValue data.
Cumulative inflows stand at $1.28 billion, with net assets under management averaging $1.08 billion. Steady risk appetite among institutional investors supports risk-on sentiment, increasing the likelihood of a sustained price recovery.
Technical outlook: XRP holds key support as bulls tighten their grip
XRP trades near $1.44, sitting above the 50-day Exponential Moving Average (EMA) at $1.41 and the 23.6% Fibonacci retracement at $1.42, applied between the January 6 high of $2.42 and the February low of $1.12, which together offer nearby downside support. Still, the remittance token remains well below the 100-day EMA at $1.54 and higher Fibonacci retracement levels.
The Relative Strength Index (RSI) is near 57 on the daily chart, and a positive Moving Average Convergence Divergence (MACD) histogram suggests moderate, yet constructive, bullish momentum.
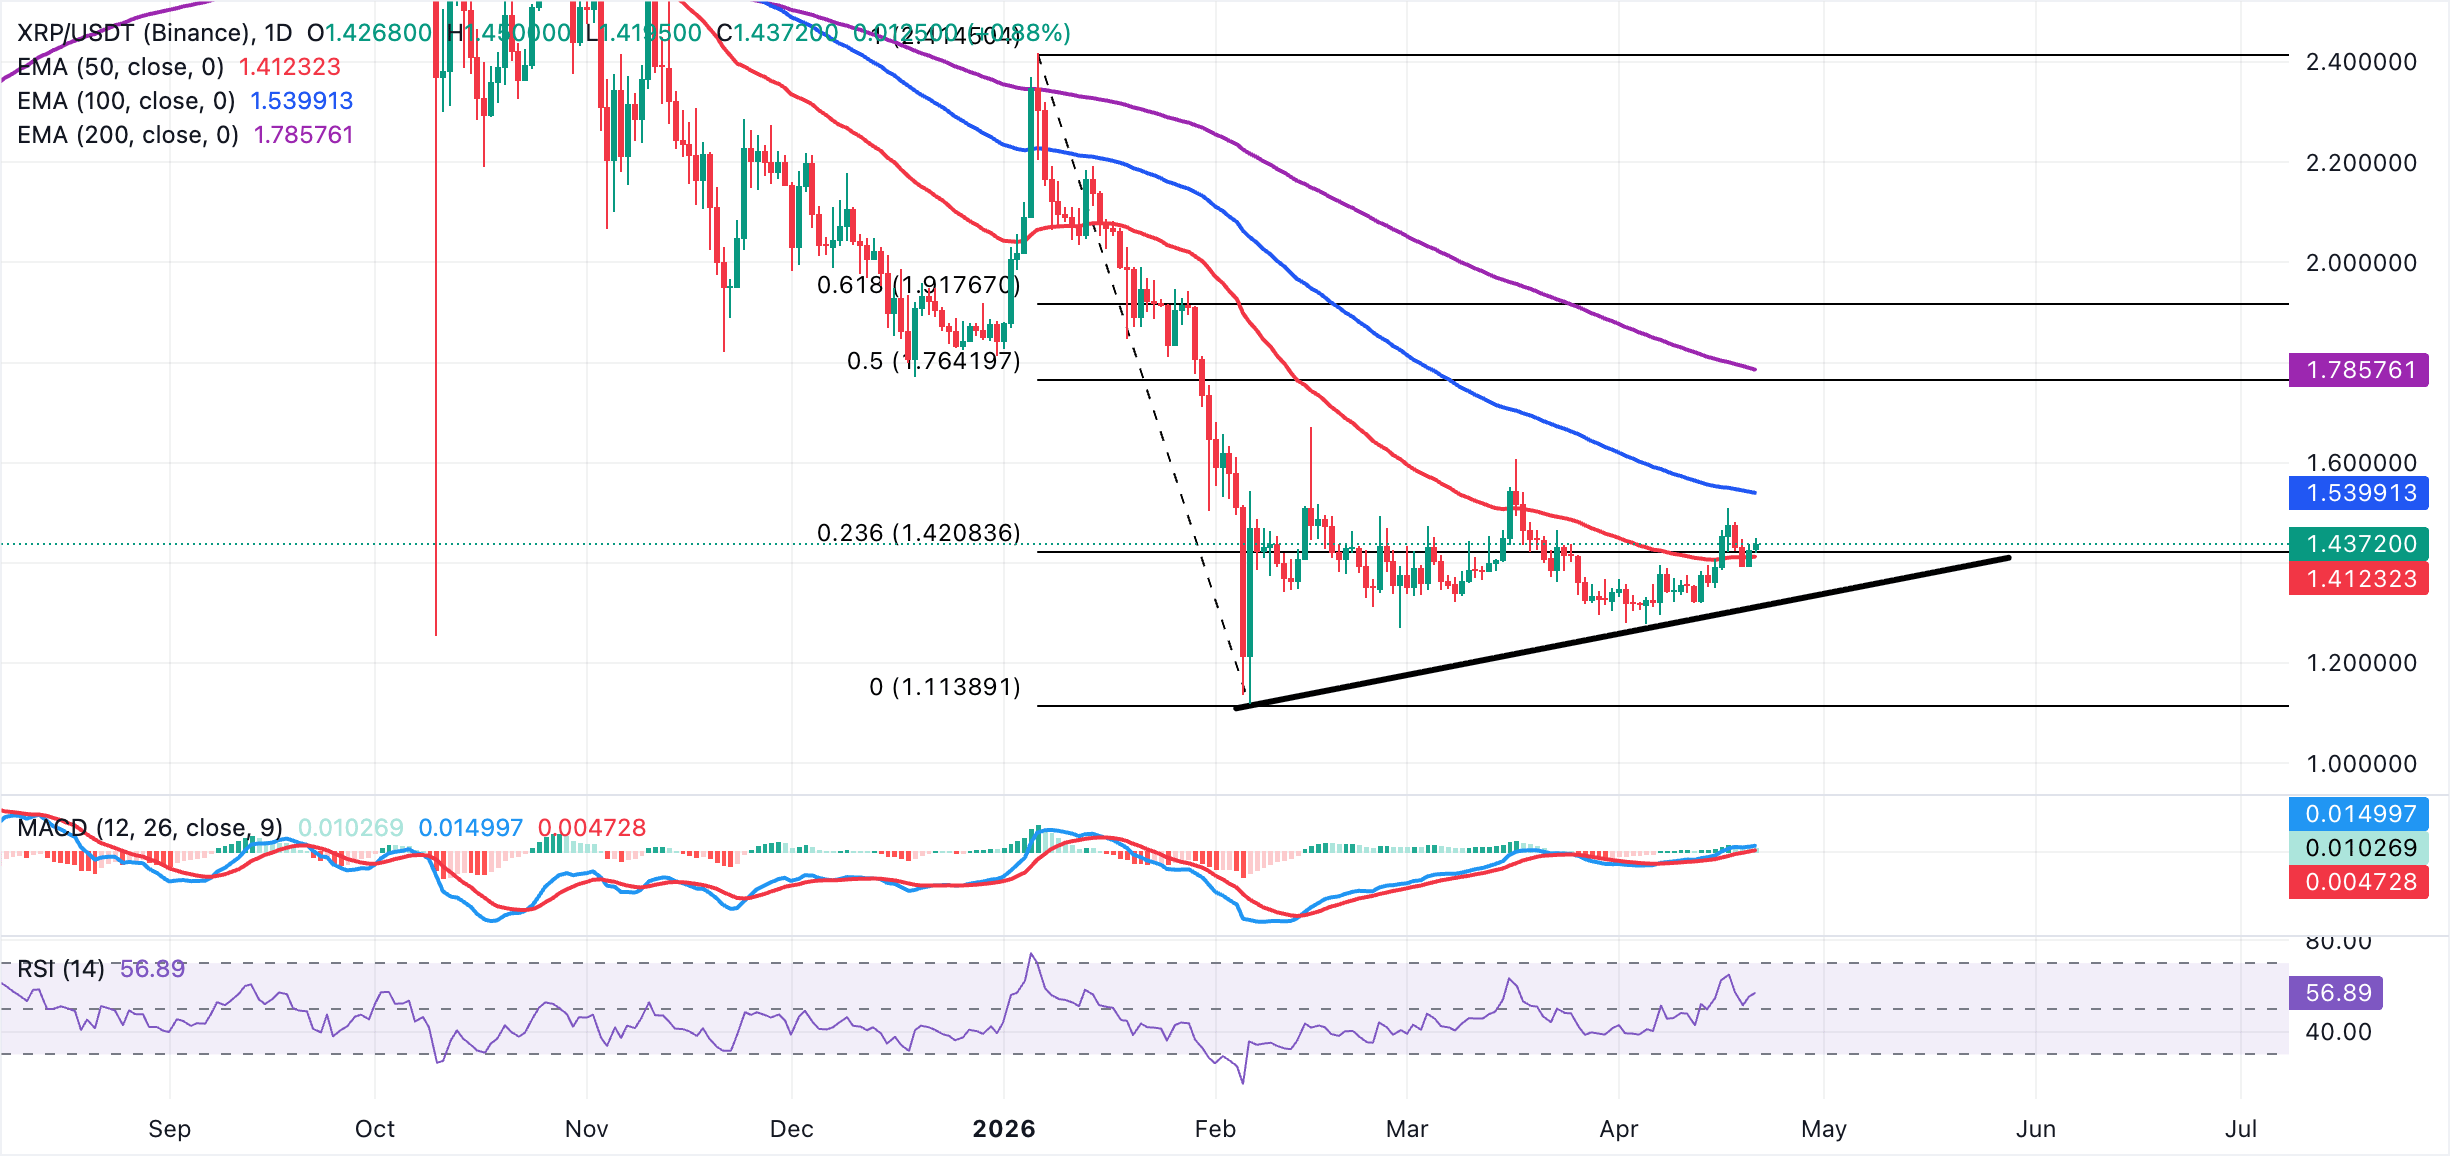
On the topside, initial resistance lies at the 100-day EMA around $1.54, ahead of a more substantial cap formed by the 38.2% Fibonacci retracement at $1.61 and the 50.0% Fibonacci retracement at $1.76. The 200-day EMA near $1.79 and the 61.8% Fibonacci retracement at $1.92 define a broader medium-term supply zone.
On the downside, immediate support is provided by the 23.6% Fibonacci retracement at $1.42 and the 50-day EMA at $1.41. A break below these would expose the upward-sloping trendline near $1.32. If selling deepens, the February 6 low at $1.12 could be the next downside objective.
(The technical analysis of this story was written with the help of an AI tool.)
Cryptocurrency metrics FAQs
The developer or creator of each cryptocurrency decides on the total number of tokens that can be minted or issued. Only a certain number of these assets can be minted by mining, staking or other mechanisms. This is defined by the algorithm of the underlying blockchain technology. On the other hand, circulating supply can also be decreased via actions such as burning tokens, or mistakenly sending assets to addresses of other incompatible blockchains.
Market capitalization is the result of multiplying the circulating supply of a certain asset by the asset’s current market value.
Trading volume refers to the total number of tokens for a specific asset that has been transacted or exchanged between buyers and sellers within set trading hours, for example, 24 hours. It is used to gauge market sentiment, this metric combines all volumes on centralized exchanges and decentralized exchanges. Increasing trading volume often denotes the demand for a certain asset as more people are buying and selling the cryptocurrency.
Funding rates are a concept designed to encourage traders to take positions and ensure perpetual contract prices match spot markets. It defines a mechanism by exchanges to ensure that future prices and index prices periodic payments regularly converge. When the funding rate is positive, the price of the perpetual contract is higher than the mark price. This means traders who are bullish and have opened long positions pay traders who are in short positions. On the other hand, a negative funding rate means perpetual prices are below the mark price, and hence traders with short positions pay traders who have opened long positions.

Über eine Million Nutzer verlassen sich auf FXStreet für Echtzeit-Marktdaten, Charting-Tools, Experteneinblicke und Forex-News. Der umfassende Wirtschaftskalender und die Bildungs-Webinare helfen Tradern, informiert zu bleiben und fundierte Entscheidungen zu treffen. FXStreet wird von einem Team von rund 60 Fachleuten getragen, verteilt auf den Hauptsitz in Barcelona und verschiedene Regionen weltweit.
Weiterlesen


