
Solana Price Forecast: SOL slips below $100, risks deeper correction
Von Manish Chhetri
Veröffentlichungsdatum: 2 Feb 2026 | Änderungsdatum: 2 Feb 2026


BELIEBTE ARTIKEL

Solana (SOL) price extends its correction, trading below $100 on Monday after losing more than 15% in the previous week. The bearish price action is further backed by derivatives data, which shows rising short bets and negative funding rates.
- Solana price extends its decline on Monday, following a more than 15% correction the previous week.
- Derivatives data supports the sell-off, with short bets rising and funding rates negative.
- The technical outlook suggests further correction, with a firm close below $100 likely to deepen it.
Solana (SOL) price extends its correction, trading below $100 on Monday after losing more than 15% in the previous week. The bearish price action is further backed by derivatives data, which shows rising short bets and negative funding rates. On the technical side, a daily close below $100 could extend a deeper correction in SOL.
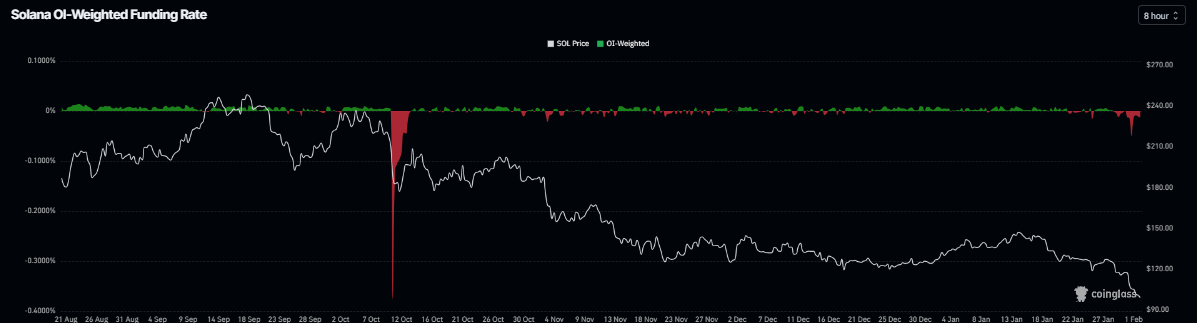
Derivatives data supports deeper correction
Derivatives data for Solana supports a bearish outlook. Coinglass’s OI-Weighted Funding Rate data shows that the number of traders betting that the price of SOL will slide further is higher than those anticipating a price increase.
The metric flipped to a negative rate on Saturday and stands at -0.0080% on Monday, indicating shorts are paying longs and suggesting bearish sentiment toward SOL.
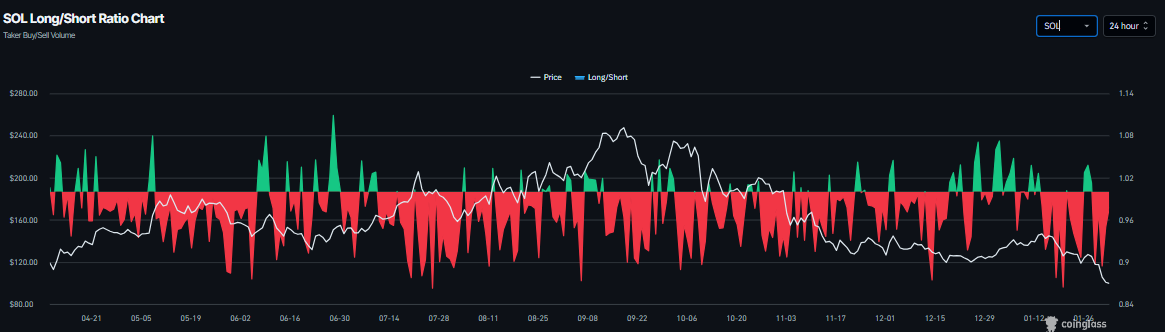
In addition, Coinglass’s long-to-short ratio for SOL reads 0.97 on Monday. The ratio below one suggests bearish sentiment in the market, as more traders are betting on the SOL price to fall.
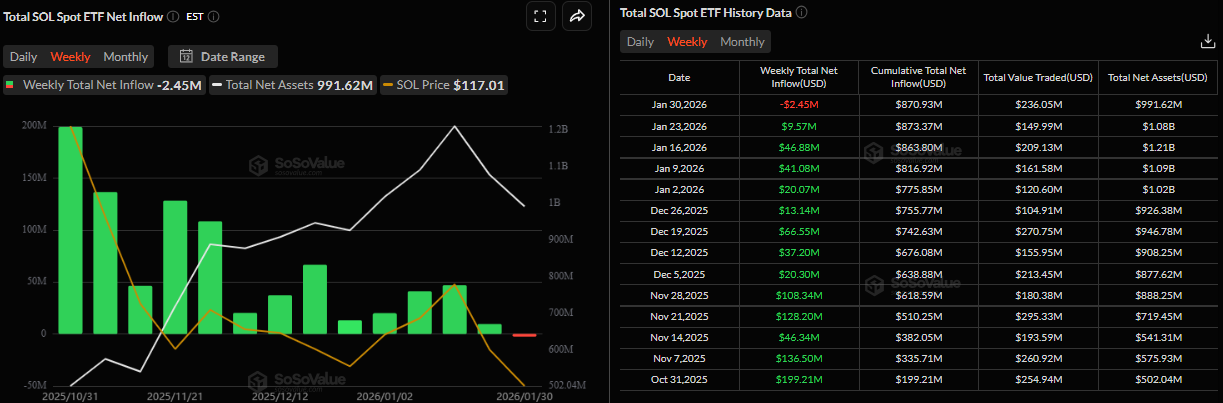
Fading institutional demand
Institutional demand for Solana also weakened last week. SoSoValue data showed that spot Exchange Traded Funds (ETFs) recorded an outflow of $2.45 million last week, marking the first weekly withdrawals since their launch. If these outflows continue and intensify, SOL could likely correct further.
Solana Price Forecast: SOL slips below $100
Solana price was rejected at the weekly resistance at $126.65 on Wednesday and declined by over 15% through Sunday, slipping below the $100 key psychological level. As of Monday, SOL is trading at $99.60.
If Solana closes below $100 on a daily basis, it could extend the decline toward the April 7 low at $95.26. A close below this could extend further losses toward the January 23, 2024, low at $79.
The Relative Strength Index (RSI) on the daily chart reads 25, an extreme oversold condition, indicating strong bearish momentum. The Moving Average Convergence Divergence (MACD) also showed a bearish crossover on January 19, which remains intact with rising red histogram bars below the neutral level, further supporting the negative outlook.
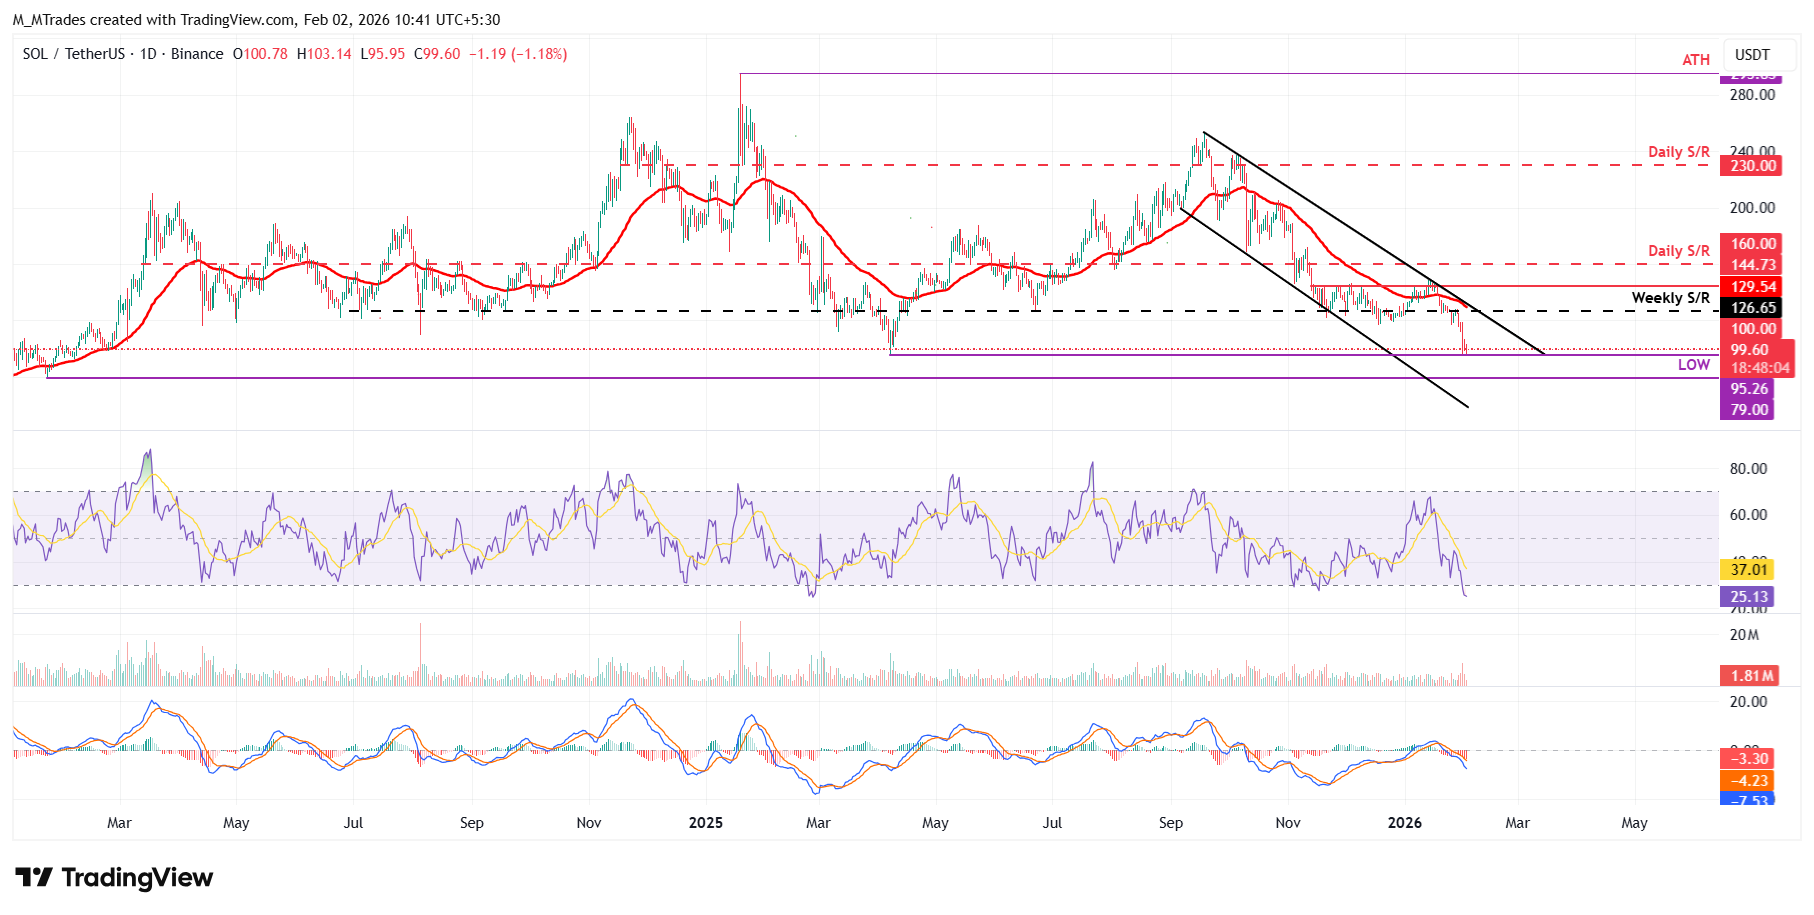
On the other hand, if SOL recovers, it could extend the advance toward the weekly resistance at $126.65.

Über eine Million Nutzer verlassen sich auf FXStreet für Echtzeit-Marktdaten, Charting-Tools, Experteneinblicke und Forex-News. Der umfassende Wirtschaftskalender und die Bildungs-Webinare helfen Tradern, informiert zu bleiben und fundierte Entscheidungen zu treffen. FXStreet wird von einem Team von rund 60 Fachleuten getragen, verteilt auf den Hauptsitz in Barcelona und verschiedene Regionen weltweit.
Weiterlesen


